%20(1).png "illiteracy case study")
- May 31, 2022

Hidden in Plain Sight: The Secret Epidemic of Illiteracy in the United States
America has a literacy problem, and it’s worse than you think.
Amelia Lake | [email protected]
The ability to read is an essential skill for navigating the modern world, yet millions of adults in the United States have such poor literacy skills that they are unable to read basic sentences, fill out a job application form, or understand the instructions on their prescription labels. Without intervention, illiteracy has wide-reaching and devastating consequences, condemning its sufferers to shame, isolation, and poverty. Kirsten Levinsohn, executive director of New Haven Reads, a New Haven-based organization that works to foster children’s literacy skills, explains current legislative and community efforts to address this issue.

Text messages. Emails. News articles. Road signs. There is a good chance that you have encountered one of these things today, and odds are, decoding them from letters, to words, to meaning took about as much effort as breathing. The ability to read is something the majority of us take for granted, and yet it is one of the most fundamental skills needed to navigate and be successful in our modern world. But for all too many people—maybe some you know—it is an insurmountable barrier and a source of deep shame.
The numbers are staggering. As of 2022, ThinkImpact reports that an estimated 79% of American adults are literate. To put it another way, one out of every five American adults are functionally illiterate, meaning that today in the United States, almost 65 million people are unable to read basic sentences, fill out a job application form, or understand the instructions on their prescription labels. This is not merely a crisis of the illiterate, but also of the underliterate: a whopping 54 percent of all American adults read at or below a sixth grade level.
“Literacy is a basic human right,” says Kirsten Levinsohn , executive director of the New Haven-based nonprofit New Haven Reads. “Reading is fundamental. You can’t be successful by any measure if you don’t first learn to read…It’s easy not to think about it, especially if it doesn’t impact you. But it’s a tragedy for every child who doesn’t learn how to read, and it’s a tragedy for the family, the community, and the state as well.”
The root of the problem is in early childhood. All too often, students who perform poorly in school are allowed to fall through the cracks. Without proper access to services that can help a struggling reader or identify an undiagnosed reading disability early on, children who are most in need of intervention are simply passed over. “If you haven’t been taught how to read before third grade,” says Levinsohn, “it’s unlikely that you ever will, because teachers are moving on. You miss the transition from ‘learning to read’ to ‘reading to learn’.”
The social and economic toll is nothing short of devastating. Starting in school, illiteracy leads to feelings of inadequacy, shame, and isolation. Students with low levels of literacy are more likely to be chronically absent, suffer behavioral problems, and drop out of school, leading to a cascading chain reaction of negative consequences. Literacy Mid-South estimates that high school dropouts , lacking employment prospects, are almost four times more likely to be arrested and 63 percent more likely to be incarcerated than their peers. The burden is lifelong, with morbid outcomes—illiteracy has strong links to poverty , with some 43 percent of illiterate adults living under the poverty line, and a reduced ability to access health services. According to a study by Nursing , elderly individuals who are illiterate are more likely to die within 6 years than those who can read well enough to understand basic health information.
This suffering is not felt evenly across the board. Illiteracy is strongly generational, meaning that individuals who are illiterate are much more likely to have been raised by illiterate and undereducated parents. “Some people say, ‘Oh, the kids can’t read because the parents don’t care,’ ” says Levinsohn. “First of all, the parents do care. They care a lot—they just don’t have the opportunities that higher-earners have access to.” Indeed, family wealth, along with parental literacy level, is among the strongest predictors of a child’s academic success. According to Regis College , exposure to literature—specifically, being read to and having access to age-appropriate books—is a critical part of fostering a child’s reading skills outside the classroom. Yet more than half of all American families living in poverty (who are disproportionately likely to be people of color, rural, Indigenous, or foreign-born) do not have children’s books in the home. Low-income earners, facing additional financial stress and grueling working hours, have less energy and time to engage in their child’s education. As the saying goes, you don’t know what you don’t know, and this is no less true when it comes to education; illiterate adults often lack the knowledge to recognize when their child is falling behind. The end result is that parents who themselves are illiterate, through no fault of their own, are simply ill-equipped to properly support a child’s academic development.
Says Levinsohn, “what’s happening now in Connecticut is that there are huge gaps in reading attainment, often having to do with disparities in income and race, which reflect the inequities in our society. In New Haven right now, about 30 percent of kids are reading at grade level or better—which, if you say it the other way, means 70 percent aren’t, which is horrendous.”
It is worth noting that these statistics are all pre-pandemic. With school closures interrupting the education of millions of students, the situation has only worsened.
The blame lies partly in curriculum design. “This is not to bash teachers,” says Levinsohn, a former teacher herself. “They went into this field for a reason. They’re all working so hard. But not all of them have been trained in the science of reading, and the science of reading is not universally accepted.”
Levinsohn is referring to the so-called “reading wars” , an ongoing debate over how reading should be taught. This rivalry, which dates back to the 1800s, consists of two opposing schools of thought: whole-language and phonics. Proponents of whole-language theory see learning to read and write English as analogous to learning to speak—“a natural, unconscious process” that is best taught through “unstructured immersion”. Words are taught individually, much like Chinese characters, and children are encouraged to decipher their meaning through context clues. Phonics, on the other hand, sees written language more as a code to be deciphered. This method emphasizes phonemic awareness, meaning that it teaches children to identify the constituent sounds of words to sound them out. Despite overwhelming evidence that the phonics approach leads to better reading outcomes, there is no federal requirement for schools to implement it in their curricula.
For the past 20 years, there has been little change in reading outcomes. As Levinsohn puts it: “Obviously, doing the same thing over and over is not working.”
The “ Right to Read ” Act, passed last June by the Connecticut General Assembly under the sponsorship of Senator Patricia Miller, aims to close some of the gaps. With its $12.8 million budget, the bill makes provisions to ensure school districts can hire reading coaches for students who are falling behind. Furthermore, it establishes a Center for Literacy Research and Reading Success, which will oversee the development of reading curricula for students in grades PreK-3. Its focus is, in part, on ensuring that school districts—which previously had complete autonomy in designing their reading curricula—adhere to evidence-based practices of reading instruction. “There is a proven method for literacy instruction,” wrote Miller in an opinion piece for the Stamford Advocate, “and that we need to use it in all of our Connecticut classrooms. Our students are entitled to it.”
Levinsohn is optimistic about the bill’s potential. “It just needs to become a priority,” she says. “There needs to be money and resources at the lowest level so kids are getting the support they need.”
But legislation isn’t the only means of intervention. Community-based organizations like New Haven Reads can and do have a tremendous impact . The nonprofit, initially founded as a book bank, has been a part of the New Haven community for over 20 years and offers a number of programs intended to support literacy development in struggling children. Prior to the Covid-19 pandemic, it sponsored school field trips for grades PreK-5 where students got to pick out five books to take home with them. “Unfortunately, a lot of kids don’t have books at home, or maybe they only have one or two,” Levinsohn explains. “We really try to put out books that would be at their grade level and their interest level. We also try very hard with this program and our tutoring program to have books that are diverse and have characters that represent our child readers.” All in all, New Haven Reads donates over 100,000 books a year , and has donated almost 2 million since its founding.
While the pandemic has forced New Haven Reads to temporarily shutter some of its usual activities, “we are still giving out books,” says Levinsohn. “Frankly, a lot to teachers. A lot of them don’t have books in their classrooms, which is quite sad. And even more sad is that a lot of schools have had to close their libraries for financial reasons, so the kids have less access to books.”
In addition to its book bank, New Haven Reads also offers a one-on-one tutoring program, which trains volunteers and matches them with a student with the intention of creating a long-lasting partnership. The program, which serves about 600 children per week, relies on the support of its roughly 400 volunteer tutors, many of them Yale affiliated—students and faculty alike. “For most of the children who come to us, all they need is a little extra individualized help,” Levinsohn says. “A lot of it is confidence for these kids. They feel that they’re stupid if they can’t read, and it’s so far from the truth. To see them grow and become more confident, it’s amazing.”
Despite the squeeze of the pandemic, New Haven Reads only intends to expand its array of services. In the works is an upcoming program intended to serve recent immigrants through a partnership with Integrated Refugee & Immigrant Services . And volunteers are always welcome.
“It’s the community at its best,” says Levinsohn. “It’s people from all walks of life coming together to support our city’s greatest asset—our kids.”
Writer’s reflection:
As a lover of language and a passionate learner, it’s difficult for me to fathom what it must be like to navigate everyday life, never mind education or work, without the ability to read. Yet for millions of Americans—our community members, friends, maybe even our own family—that is their reality. I want to extend my sincerest thanks to Kirsten Levinsohn for sharing her knowledge with me, and encourage readers to consider volunteering or donating to New Haven Reads and other organizations doing important work to tackle this issue.
- 2022 Spring Issue
- United States
Recent Posts
Breathing as a Human Right: Cancer Alley as a Case Study of Environmental Racism
The State of Reproductive Rights in Latin America-Ripples and Rollbacks
Resettlement and the Road Ahead
- Search Menu
- Sign in through your institution
- Advance articles
- Editor's Choice
- Continuing Education
- Author Guidelines
- Submission Site
- Open Access
- Why publish with this journal?
- About Archives of Clinical Neuropsychology
- About the National Academy of Neuropsychology
- Journals Career Network
- Editorial Board
- Advertising and Corporate Services
- Self-Archiving Policy
- Dispatch Dates
- Journals on Oxford Academic
- Books on Oxford Academic
Article Contents
Introduction, conceptual issues in the study of illiteracy, the illiterate brain, neuropsychological test performance in illiterates, educational effects in test performance, brain damage and illiteracy, conclusions regarding human cognition through the study of illiteracy, conflict of interest.
- < Previous
Illiteracy: The Neuropsychology of Cognition Without Reading
- Article contents
- Figures & tables
- Supplementary Data
Alfredo Ardila, Paulo H. Bertolucci, Lucia W. Braga, Alexander Castro-Caldas, Tedd Judd, Mary H. Kosmidis, Esmeralda Matute, Ricardo Nitrini, Feggy Ostrosky-Solis, Monica Rosselli, Illiteracy: The Neuropsychology of Cognition Without Reading, Archives of Clinical Neuropsychology , Volume 25, Issue 8, December 2010, Pages 689–712, https://doi.org/10.1093/arclin/acq079
- Permissions Icon Permissions
Illiterates represent a significant proportion of the world's population. Written language not only plays a role in mediating cognition, but also extends our knowledge of the world. Two major reasons for illiteracy can be distinguished, social (e.g., absence of schools), and personal (e.g., learning difficulties). Without written language, our knowledge of the external world is partially limited by immediate sensory information and concrete environmental conditions. Literacy is significantly associated with virtually all neuropsychological measures, even though the correlation between education and neuropsychological test scores depends on the specific test. The impact of literacy is reflected in different spheres of cognitive functioning. Learning to read reinforces and modifies certain fundamental abilities, such as verbal and visual memory, phonological awareness, and visuospatial and visuomotor skills. Functional imaging studies are now demonstrating that literacy and education influence the pathways used by the brain for problem-solving. The existence of partially specific neuronal networks as a probable consequence of the literacy level supports the hypothesis that education impacts not only the individual's day-to-day strategies, but also the brain networks. A review of the issues related to dementia in illiterates is presented, emphasizing that the association between the education level and age-related cognitive changes and education remains controversial. The analysis of the impact of illiteracy on neuropsychological test performance represents a crucial approach to understanding human cognition and its brain organization under normal and abnormal conditions.
Illiterates represent a significant proportion of the world's population. In 2000–2004, close to onefifth of the world's population was illiterate: 13% of men over 15 years of age and 23% of women ( UNESCO, 2005 ). Only a few centuries ago, reading and writing abilities were simply uncommon among the general population. Writing has only a 6,000-year history; for about 95% of our history, Homo sapiens were preliterate. We hypothesize that the acquisition of literacy skills has somehow changed the brain organization of cognition.
When studying illiteracy, the most obvious factor is the generational effect found in most countries (Table 1 ). Elders in most societies generally have a lower-educational level than their children and grandchildren. Moving back in history, the duration of education is progressively shorter on average.
World-wide illiteracy rate during 1970–2015 (projected) ( UNESCO, 2005 )
| Year . | Illiteracy rate (%) . |
|---|---|
| 1970 | 37 |
| 1980 | 30 |
| 1990 | 25 |
| 2000 | 20 |
| 2005 | 18 |
| 2010 | 16 |
| 2015 | 15 |
| Year . | Illiteracy rate (%) . |
|---|---|
| 1970 | 37 |
| 1980 | 30 |
| 1990 | 25 |
| 2000 | 20 |
| 2005 | 18 |
| 2010 | 16 |
| 2015 | 15 |
Reasons for Illiteracy
Two major classes of reasons account for illiteracy: There is a significant diversity in literacy rates among countries, from 99% (e.g., Japan, Canada, and Finland) to below 20% (e.g., Mali, Niger, and Burkina Faso; International Adult Literacy Survey, 1998 ). Illiteracy due to personal reasons (learning difficulties, mental retardation, significant motor and/or sensory problems, early central nervous system pathologies, and similar conditions) likely accounts for only a small percentage of illiteracy in industrialized countries and potentially somewhat higher in poor countries with increased prevalence of early central nervous system pathologies.
Social reasons. Illiteracy may be due to the absence of schools, social disapproval of literacy, child labor, and/or poverty.
Personal reasons . For a subgroup of illiterates, learning difficulties, mental retardation, significant motor and/or sensory problems, early central nervous system pathologies, and similar conditions may account for their failure to learn to read despite adequate exposure to education.
These two main classes of reasons for illiteracy present potential confounds for research. Populations that are illiterate for social reasons are likely to differ in important ways other than literacy from the schooled, literate populations that have been the subjects of most research in cognitive psychology (prototypically U.S. college students). In general, illiterates are more likely to be of a lower socioeconomic class, they may have a variety of health problems, they may have less exposure to media of communication, and they may have limited experience with testing and, thus, distrust of researchers, among other differences. Those who are illiterate due to personal reasons are quite likely to have atypically functioning brains and cognitive systems.
One way around this problem is to compare individuals to themselves rather than to other populations. Studies of adults before and after they acquire literacy can help to control for these factors and can furthermore control, to a large extent, for the effects of development. An alternative is the sample used in a series of Portuguese studies (e.g., Reis & Castro-Caldas, 1997 ) comparing sisters, one of whom is literate and the other illiterate due to social demands placed on the eldest daughter to take on the responsibility of child care of younger siblings.
Why Is It Important to Study Illiteracy?
Different fundamental and practical reasons to study illiteracy could be distinguished ( Olson & Torrance, 2009 ). There are, however, at least four important reasons to study the neuropsychology of illiteracy: This article will focus primarily on those aspects of the study of illiteracy most pertinent to the neurocognitive theory, and clinical neuropsychology, as well as the analysis of the effects of education on neuropsychological functioning.
(Neuro)cognitive Theory. The study of illiteracy can contribute to a broader understanding of the organization of cognition.
Clinical Neuropsychology. The analysis of illiteracy can help to discern the influence of both literacy and schooling on cognitive test performance. Educational variables significantly influence performance on a diversity of neuropsychological tests ( Lezak, Howieson, & Loring, 2004 ).
Teaching Literacy. Understanding the basic brain mechanisms, subserving cognition in illiterates may contribute to improving reading and writing teaching methods for illiterate adults (e.g., Ardila, Ostrosky & Mendoza, 2000 ).
Literacy and Neuropsychological Functioning. Exploring the effects of education on literacy and neuropsychological functioning.
A fundamental conceptual presumption of neuropsychology is that the potential for basic cognitive abilities, and correspondingly, their brain mechanisms, are universal and inherent for any human being with normal brain development, regardless of the specific language spoken and one's environmental conditions. Literacy (i.e., extending spoken language to a symbolic visual representation) plays a major role in mediating cognitive processes. Luria (1931 , 1933 , 1966 , 1973 ) and Vygotsky (1934/1978) developed the concept of extracortical “organization of higher mental functions” to account for the interaction of biological and cultural factors in the development of human cognition ( Kotik-Friedgut & Ardila, 2004 ).
Historical Development of Writing and Schools
Several existing writing systems use a mixture of logograms, syllabic graphemes, phonemic graphemes, and extraphonemic markers such as capitalization, punctuation, and spatial layout. The relative emphasis on each level of representation varies from system to system. For example, the Chinese system is predominantly based on logograms with some phonemic graphemes, and extraphonetic markers, and with an alternate phonemic grapheme system available. Likewise, the above sequence is not meant to imply that any one system is more efficient or superior.
Thus, initial writing (or rather, prewriting) was a visuoconstructive ability (i.e., representing external elements visually), and only later did it become an ideomotor praxis ability (i.e., making specific learned and fixed sequences of movements with the hand to create a pictogram—a standardized representation of external elements). Still later, writing became a linguistic ability (i.e., associating the pictogram with a word, and further analyzing the word into its constituent sounds; Ardila, 2004 ). It is not surprising that three major disorders in writing can be observed as a result of brain pathology: Visuoconstructive (spatial or visuospatial agraphia: Impairment in letter, word, and text formation due to disturbed visuospatial skills), ideomotor (apraxic agraphia: Selective disorder of letter formation caused by ideomotor apraxia), and linguistic (aphasic agraphia: Writing impairment due to a language disturbance; Table 2 ). The evolution of writing has continued with the development of different technical instruments for writing: The stylus for etching in clay, feathers, the pencil, the typewriter, and the computer, as well as the development of different writing styles (e.g., handwriting, script, uppercase, lowercase) and different media (e.g., clay, papyrus, paper, computer screens). Moreover, images first and writing later allowed the possibility of representation; thus, they enable humans to think and act beyond their immediate needs ( Suddendorf & Corballis, 1997 ) and promote abstract thinking.
Representational forms of writing and corresponding cognitive skills
| Representational form . | Historical example . | Neurocognitive skill . | Form of agraphia . |
|---|---|---|---|
| Drawings pictograms | Cave paintings Egyptian hieroglyphics | Visuoconstructive ability | Visuospatial |
| Logograms | Sumerian | Ideomotor praxis | Apraxic |
| Syllabic graphemes | Japanese Kana | Linguistic ability | Aphasic |
| Phonemic graphemes | Spanish |
Defining Literacy
The definition of literacy is not definitive, nor is there an overt cut-off point; consequently, intermediate stages, such as semiliteracy and functional illiteracy, are often recognized. UNESCO ( http://www.uis.unesco.org/i_pages/indspec/TecSpe_literacy.htm ) defines adult illiteracy as the percentage of the population aged 15 years and over who cannot both read and write a comprehensible short simple statement on their everyday life. Literate does not necessarily mean schooled, even though literacy is usually highly associated with formal schooling. Reading can be transmitted from parents or tutors to children without formal school attendance ( Berry & Bennett, 1992 ; Scribner & Cole, 1981 ). Under normal conditions, reading is not learned by simple exposure, even though illiterates can develop some ability to holistically recognize a few highly frequent words, such as the name of their country, and the name of some popular commercial products ( Goldblum & Matute, 1986 ). Extremely infrequently, the ability to read can be acquired without any deliberate training (so-called “hyperlexia” usually associated with autism, Martos-Perez & Ayuda-Pascual, 2003 ; Nation, 1999 ).
The degree to which contemporary illiterates are confined to access to immediate sensory information probably also reflects the degree to which they are confined in their access to various media of information and communication and, possibly, also to formal education. Da Silva, Petersson, Faísca, Ingvar, and Reis (2004) demonstrated in Portugal that whereas literates and illiterates perform equally well on a fluency task asking for elements known through direct sensory information (“items that can be found in a supermarket”), the two groups differed on a semantic fluency task requiring naming animals. In contrast, literate people can name dinosaurs, camels, or kangaroos, evidently unknown in Portugal, but learned by reading; whereas illiterates can only name cats, dogs, horses, and other animals existing in the immediate surrounding environment and known through direct sensory experience. When the information is related to real life and direct experience, it can be considerably easier to understand. Thus, for the illiterate person, it is easier to repeat a word than to repeat a pseudoword ( Castro-Caldas, Petersson, Reis, Stone-Elander, et al., 1998 ; Kosmidis, Tsapkini, & Folia, 2006 ) and to remember objects presented to them visually than word lists ( Folia & Kosmidis, 2003 ).
The impact of literacy is reflected in all spheres of cognitive functioning. Learning to read reinforces certain fundamental abilities, such as verbal and visual memory, phonological awareness, executive functioning, and visuospatial and visuomotor skills ( Bramão et al., 2007 ; Matute, Leal, Zarabozo, Robles, & Cedillo, 2000 ; Petersson, Reis, Askelof, Castro-Caldas, & Ingvar, 2000 ; Petersson et al., 2001 ). It is not surprising that illiterate people underachieve on cognitive tests that assess these particular abilities. Furthermore, attending school also reinforces certain attitudes and values that may speed the learning process, such as the attitude that memorizing information is important or that knowledge is highly valuable; that learning is a step-by-step process moving from the simple to the more complex. It has been emphasized that schooling improves an individual's ability to explain the basis of performance in cognitive tasks ( Laboratory of Comparative Human Cognition, 1983 ). Whether a fundamental aim of education, or a by-product, the fact remains that all schools and schooling, regardless of their location, have a common influence on those who go through the system, namely, they train students and reinforce certain values. Hence, school may be seen as a culture unto itself, a transnational culture, and the culture of school.
School not only teaches, but also helps in developing certain strategies and attitudes that will be useful for future learning. Ciborowski (1979) observed that schooled and nonschooled children can learn a new rule equally well, but once acquired, schooled children tend to apply it more frequently in subsequent similar cases. School attendance, however, does not mean that educated people simply possess certain abilities that less-educated individuals lack. It does not mean that highly educated people have the same abilities as less-educated individuals, plus something else ( Ardila, Ostrosky & Mendoza, 2000 ). The individual with no formal education most likely has acquired knowledge, skills, and values that educated people have not. Nonetheless, formal cognitive testing evaluates those abilities in which educated people were trained; therefore, it is not surprising that they will outperform those with no formal education. In fact, one study demonstrated that once the effects of education and literacy were separated from each other, some types of language processing were enhanced by any level of literacy, whereas others continued to improve with an increasing level of education ( Kosmidis et al., 2006 ). It is noteworthy that the educational level has a substantial relationship with performance on some cognitive tests, but is not systematically related to everyday problem-solving (functional criterion of intelligence; Cornelious & Caspi, 1987 ). As a matter of fact, when functionally oriented tests, such as the Rivermead Behavioural Memory Test ( Wilson, Cockburn, & Baddeley, 1985 ) and the Fuld Object Memory Evaluation ( Fuld, 1980 ), are administered to people with low education, no significant differences with high-educated people have been observed ( Yassuda et al., 2009 ).
Although schooling represents, in some respects, a transnational culture, that culture is not uniform. Literacy and numeracy are almost universal as the major focus of primary education, but beyond that the qualities of the educational experience vary considerably. Wealthy educational systems are likely to have low student:teacher ratios, abundant teaching materials, extensive communication outside the school (Internet, field trips, visiting instructors), ancillary services (psychologists, therapists, parent services), and instruction in a wide variety of subjects and skills. Schools with less funding often lack these resources. Manly (2006) has demonstrated a relationship between school expenditure and neuropsychological test performance.
School qualities depend on much more than funding. Schools vary greatly in their formal curricula and also in unwritten characteristics. There is much variability in schools’ behavioral expectations and institutional cultures, as well as in their emphasis on bilingualism, visual-spatial skills, abstract reasoning, problem-solving, speeded performance, social skills, individualism, collectivism, moral values, and religious instruction, among other themes. These varying characteristics can reasonably be expected to have an impact on neuropsychological test performance, and this impact is not likely to be entirely linear nor unifactorial, but these relationships have not yet been systematically explored.
Contemporary illiteracy is not the same as historical preliteracy. Literacy facilitates a number of cognitive technologies that may have replaced preliterate cognitive skills. Those preliterate cognitive skills may require intact preliterate societies and may be extinct or vestigial in the contemporary world and in contemporary marginalized illiterates. A functioning illiterate or preliterate society may be required to foster the full flowering of such skills. For example, there are many cultural traditions of bards who memorize long poems and pass them on through generations ( Lord, 1995 ). We tend to think of illiterates as concrete thinkers, yet the fables, proverbs, myths, idioms, and even the metaphors built into the very structure of our languages that have come to us from largely preliterate societies from millennia ago are often quite abstract.
Literacy Versus Schooling
Very important cognitive consequences of learning to read and write have been suggested: Changes in visual perception, logical reasoning (i.e., executive functions), remembering strategies ( Laboratory of Comparative Human Cognition, 1983 ), as well as access to lexical storage and explicit phonological processing ( Kosmidis et al., 2006 ) and improved working memory. Schooling appears to influence formal operational thinking ( Laurendeau-Bendavid, 1977 ) and functional brain organization ( Castro-Caldas, Petersson, Reis, Stone-Elander, et al., 1998 ; Ostrosky-Solis, Ramirez, Lozano, Picasso, & Velez, 2004 ) and to reinforce particular attitudes and values related to learning. Conversely, training these abilities may make it easier to learn to read and write. Interestingly, adults who received training in those abilities in which illiterates significantly underscore (e.g., verbal memory, phonological abstraction, etc.) showed a significant improvement in neuropsychological test scores and a facilitation in their learning-to-read process ( Ostrosky-Solís et al., 2003 ).
Literacy without schooling: The Vai
Scribner and Cole (1981) attempted to separate the effects of literacy from the effects of formal schooling by studying Vai people in Liberia who were literate in the Vai script, but who had not attended school. Vai people have their own script. The script is taught at home, rather than school, allowing the researchers to separate school-based education from literacy. Indeed, there are three educational systems in the Vai culture: (a) Traditional socialization—the bush school, taught by men for boys, and by women for girls; (b) English schooling—much like American schooling, and (c) Quranic schooling—conducted in Arabic. They found that there were no general effects of literacy on a battery of cognitive tests, but performance on some tests was related to particular features of the Vai script and literacy practices. Scribner and Cole proposed that there are definite cognitive skills associated with literacy, but not necessarily with classroom learning. And these cognitive skills are dictated by each culture and situation. Berry and Bennet (1989) carried out a partial replication of this study among the Cree of Northern Ontario.
Comparison of groups with low and high education
Kosmidis, Tsapkini, Folia, Vlahou, and Kiosseoglou (2004 ) and Kosmidis et al. (2006 ) attempted to disentangle the effect of education from literacy in a sample of urban dwellers (illiterates, low-education literates, and high-education literates). They found that education influenced lexical decision-making, concluding that the greater the amount of education, the more effective access to, and, perhaps, the greater the size of the lexical store. In contrast, literacy influenced the capacity of the phonological loop: Low- and high-education literates performed equally well on pseudoword repetition, and better than illiterates. Therefore, they concluded that literacy influences the effectiveness of the direct route from the auditory analysis system to the phoneme level, whereas education influences lexical processing. Similarly, Kosmidis and colleagues (2004) found that semantic processing was affected by the level of education attained, whereas phonological processing depended on whether the individual had attained symbolic representation per se through learning grapheme–phoneme correspondence or had been exposed to formal schooling.
Neither literacy nor school attendance is a simple and linear variable. Reading ability is not only correlated with training time, but also with the idiosyncrasies of the reading system. For example, learning to read is easier in a transparent writing system (regular spelling, e.g., Spanish, German, Greek) than in an opaque writing system (irregular spelling, e.g., English, French; Paulesu et al., 2001 ). Furthermore, school attendance goes far beyond learning to read, write, and calculate. School provides background knowledge in many areas (geography, history, language, etc.), but also contributes to developing learning skills. In school, children are exposed to information that is neither part of their immediate environment nor part of their direct experience. They learn how to establish taxonomies of their newly learned concepts, they learn to use paper and pencil, and they use a language different from that used in their everyday life ( Montiel & Matute 2006 ). School develops and reinforces certain cultural and socialization values by creating alternative parental and authority images; certain forms of group behavior; attitudes toward government, church, or other institutions sponsoring their education; and the process of being tested ( Serpell, 1993 ). Children learn from their teachers, their peers, the group activities at school, and the new context.
Two different approaches can be used to understand the potential differences between the literate and the illiterate brain: Functional and anatomic measures.
Traditional Functional Measures: Dichotic Listening
Several studies have used dichotic listening paradigms to study the potential influence of literacy on cerebral lateralization for language ( Castro & Morais, 1987 ; Damasio, Damasio, Castro-Caldas, & Ferro, 1979 ; Karavatos et al., 1984 ; Kosmidis et al., 2004 ; Tzavaras, Kaprinis, & Gatzoyas, 1981 ) yielding conflicting results. Some investigators reported decreased laterality for language among illiterates relative to literates ( Joanette et al., 1983 ), others no laterality differences ( Damasio, Castro-Caldas, Grosso, & Ferro, 1976 ; Kosmidis et al., 2004 ), and yet others stronger lateralization among illiterates relative to literates ( Tzavaras et al., 1981 ). Potential reasons for the conflicting results may relate to characteristics of the stimuli used in each investigation, such as the nature of the stimuli (i.e., words, pseudowords, numbers, syllables), the phonetic and the acoustic characteristics of the sounds (i.e., stop, nasal, fricative and liquid consonants, or consonants with abrupt onset), and differences in onset and intensity of stimuli in a pair ( Ahonniska et al., 1993 ; Castro & Morais, 1987 ). More recent investigations of the dichotic listening process (among literate individuals) have highlighted the role of attentional resource activity in addition to cerebral dominance for language ( Reinvang et al., 1994 ; van Ettinger-Veenstra et al., 2010 ; Westerhausen & Hugdahl, 2008 ). Unfortunately, none of the studies of dichotic listening in illiteracy took this parameter into account. Therefore, although not informative with regard to the question of hemispheric dominance for language processing in illiterates in general, past studies on dichotic listening among illiterates highlight the need for breaking down language processing into more specific cognitive mechanisms.
Contemporary Functional Measures
Recent studies using different functional measures have demonstrated that literacy and education influence the pathways used by the brain for problem-solving. Schooled literates and illiterates show equivalent left hemisphere attenuation of cortical event-related potentials during a verbal memory task (for instance, memorizing words), but intrahemispheric differences at parietotemporal areas, suggesting that learning literacy produces intrahemispheric specialization ( Ostrosky-Solis et al., 2004 ).
Similarly, several studies using positron emission tomography (PET) and statistical parametric mapping or functional magnetic resonance imaging (fMRI) found additional differences between schooled literates and illiterates in the brain areas activated during language-based tests (i.e., left hemisphere perisylvian area). Interestingly, in one study using repetition of words and repetition of pseudowords, these differences were much more relevant during pseudoword repetition suggesting that the inability to process phonological segmentation was the inability to activate the brain regions responsible for doing it; the only activation in words versus pseudowords that was greater in the literate than in the illiterate group was the more prominent left-sided posterior parietal activation. In particular, when masking with the activation pattern defined by the words–pseudowords contrast in literates, there was increased activation of a left inferior parietal region (BA 40) in literates compared with illiterates in words versus pseudowords. During real-word repetition, the difference was confined to a left parietal region that can be related to the process of writing ( Castro-Caldas, Petersson, Reis, Stone-Elander, et al., 1998 ; Fig. 1 ). This differential activation of neural structures to real versus nonreal words suggested fundamental differences in cognitive processing based on phonological information. A subsequent replication of the aforementioned PET findings ( Petersson et al., 2000 ) traced differences in the neuronal networks used by illiterates versus schooled literates in pseudoword repetition to the interaction between Broca's area and the inferior parietal lobe, as well as the posterior-midinsula bridge between Wernicke's and Broca's areas. Finally, education-related differences were reported in an fMRI study of the effects of education on neural activation in healthy right-handed Chinese subjects ( Li et al., 2006) . These differences in activation patterns emerged in the left inferior/middle frontal gyrus and both sides of the superior temporal gyrus for a silent word recognition task and in the bilateral inferior/middle frontal gyrus and limbic cingulate gyrus for a silent word and picture-naming task. It was suggested that these results indicate that the patterns of neural activation associated with language tasks are strongly influenced by education. Education appears to have enhanced cognitive processing efficiency in language tasks.

Maximum intensity projections of all significant activations thresholded. Results of the interaction analysis (A) word repetition (literate–illiterate) and (B) pseudo-word repetition (literate–illiterate; adapted from Castro-Caldas, Petersson, Reis, Stone-Elander, et al., 1998 ).
Even when their cognitive performance is equivalent, schooled literates and illiterates appear to use different brain activation patterns to perform the same task. Deloche, Souza, Braga, and Dellatolas (1999 ) studied healthy right-handed Brazilians (unschooled illiterates and college graduates) on a task judging the magnitude of numbers within a familiar context (e.g., 10 people in a standard-sized car, 9 students in a school: Is this a lot, average, or too little?). Both groups performed similarly well with regard to the correctness of their judgments. Functional MRI scans, however, demonstrated different brain activation patterns: The college graduates used the left hemisphere exclusively, specifically, the left frontal (BA 47), inferior parietal (BA 40), and temporal lobes (BA 42, 21, and 22). In contrast, the illiterates activated both hemispheres during the task, specifically, the temporal (BA 39, 20, and 22) and the occipital lobes (BA 19 and 37) bilaterally. Activation of the left temporal lobe (BA 21 and 22) was the only finding common to both groups in the number processing task. In post-fMRI interviews inquiring about the strategies that the participants used to perform the judgment task, 95% of the illiterates reported having used visual images, which may explain the activation of the occipital lobe in this group. The college graduates predominantly used abstraction to solve the problems, which corresponds to their left hemisphere activation.
Carreiras and colleagues (2009) compared structural brain scans from those who learned to read as adults (late literates) with matched illiterates. It was observed that late literates had more white matter in the splenium of the corpus callosum and more grey matter in bilateral angular, dorsal occipital, middle temporal, and left supramarginal and superior temporal gyri. It was also disclosed that the anatomical connections linking the left and right angular and dorsal occipital gyri through the area of the corpus callosum white matter was larger in late literates than in illiterates. Results were interpreted to suggest that reading increased the interhemispheric functional connectivity between the left and right angular gyri.
In sum, the data produced by functional imaging studies on brain activation during cognitive tasks support the contention that learning literacy impacts not only the individual's day-to-day strategies, but also influences the functional architecture of the adult human brain.
Anatomical Interhemispheric Comparisons
Comparing schooled literates and illiterates, Castro-Caldas and colleagues (1999) observed a slightly thinner corpus callosum in illiterates, specifically the region where parietal fibers are thought to cross. The morphology of the corpus callosum appears sensitive to the quality of the information content of the brain. The corpus callosum is larger for instance, in musicians presumably because their performance with musical instruments requires the involvement of both hemispheres ( Norton et al., 2005 ). In the aforementioned PET scan study ( Castro-Caldas, Petersson, Reis, Stone-Elander, et al., 1998 ), differences between groups indicated a dissociation between the superior and the inferior parts of the angular-supramarginal regions, that is, the superior parts being more active on the left than on the right in illiterates compared with literates, whereas the reverse was the case for the inferior parts and the precuneus. This suggests differential recruitment of right and left regions of the parietal lobe related to literacy and is in accordance with the finding reported above for magnitude judgments.
Some authors have postulated that hemispheric specialization is dependent on the nature of the task rather than the nature of the stimulus; for instance, Stephan and colleagues (2003) used fMRI in a group of normal subjects during letter and visuospatial decision tasks with identical word stimuli to address two unresolved problems. It was noted that hemispheric specialization depended on the nature of the task rather than on the nature of the stimulus. Furthermore, the increased coupling between left anterior cingulate cortex and left inferior frontal gyrus during letter decisions was observed, whereas right anterior cingulate cortex showed enhanced coupling with right parietal areas during visuospatial decisions; these authors suggested that cognitive control is thus localized in the same hemisphere as task execution. We would propose an additional point based on the aforementioned findings: Hemispheric specialization may also be related to the strategy used to solve the problem (verbal, spatial, etc.), which is dependent on the individual's skills acquired by learning.
General Cognitive Functioning
Mini-mental state exam.
The Mini-Mental State Examination (MMSE) is a brief exam widely used by physicians primarily to screen for the level of delirium or dementia. It consists of items of orientation, memory, attention, drawing, reading, writing, repetition, naming, and following directions, scored on a 30-point scale ( Folstein, Folstein, & Mchugh, 1975 ). The total MMSE scores for illiterate samples average around 15–20 points (Table 3 ), in the range of severe cognitive alterations according to the 23 of 24 point cut-off suggested by Folstein and colleagues (1975) .
Given its widespread use as a screening instrument for cognitive dysfunction, potential effects of literacy on performance may be biased against those who are illiterate (Table 3 ). In fact, Bertolucci, Brucki, Campacci, and Juliano (1994) found that illiterates differed from schooled literates on the MMSE not only on items related to writing and arithmetic (calculation, reading a command, writing a sentence, and copying a line drawing), but also on orientation to time. Other studies have found even more extensive differences; in one study, 16 of 19 questions differentiated schooled literates from illiterates at a level of significance of P < .001, where only repetition, recall, and naming were unrelated to literacy ( Rosselli et al., 2000 ), with differences in performance being observed even between illiterates and people with as little as 1 year of education at a level of significance of P < .0001 ( Brucki, Nitrini, Caramelli, Bertolucci, & Okamoto, 2003 ).
Scores for illiterates on the MMSE in different normative studies
| Author . | Age . | . | . |
|---|---|---|---|
| Ostrosky and colleagues (2000) | 16–50 | 19.7 | 3.7 |
| 51–65 | 16.7 | 4.4 | |
| 66–89 | 16.4 | 4.2 | |
| ) | 65–92 | 18.8 | 2.9 |
| Laks and colleagues (2003) | 65–84 | 17.2 | 4.4 |
| >84 | 14.3 | 3.9 |
| Author . | Age . | . | . |
|---|---|---|---|
| Ostrosky and colleagues (2000) | 16–50 | 19.7 | 3.7 |
| 51–65 | 16.7 | 4.4 | |
| 66–89 | 16.4 | 4.2 | |
| ) | 65–92 | 18.8 | 2.9 |
| Laks and colleagues (2003) | 65–84 | 17.2 | 4.4 |
| >84 | 14.3 | 3.9 |
Note: MMSE = Mini Mental State Exam.
Motor Functions
Writing is a fine movement activity; therefore, illiterate people may be less proficient with complex motor tests when compared with people able to write. In fact, several studies have supported this hypothesis. Rosselli, Ardila, and Rosas (1990) found statistically significant differences between illiterates and university-educated individuals in clinical tests of apraxia (buccofacial and ideomotor praxis, finger alternating movements, meaningless movements, coordinated movements with both hands, and motor impersistence tasks). When mimicking movements, illiterates frequently used the hand as instrument (body-part-as-object). Illiterates also tended to replace the movement for the corresponding verbalization. Nitrini, Caramelli, Herrera, Charchat-Fichman, and Porto (2005) administered Luria's fist-edge-palm test to 745 individuals with different educational levels, including 238 illiterates. Logistic regression showed that illiteracy was associated with failure, whereas gender and age were not. The proportion of individuals failing was inversely related to years of schooling. For those able to reproduce the sequence, the number of demonstrations for successful reproduction was also inversely related to years of schooling. Finally, Ostrosky, Ardila, and Rosselli (1999) investigated performance on four motor tests—changing left–hand position, changing right–hand position, alternating movements with both hands, and Luria's opposite reactions test—across different educational levels. On all four motor tests, performance was higher in the participants with a higher educational level. The effect of level of education was robust on the first three tests, but minimal on the fourth.
Bramäo and colleagues (2007) corroborated the association between reading skills and performance on visuomotor tasks. They instructed illiterate and literate (Portuguese) participants to use the right or the left index finger to touch a randomly presented target on the right or left side of a touch screen. The literate subjects were significantly faster in detecting and touching targets on the left compared with the right side of the screen. Presentation side did not affect performance of the illiterate group.
In conclusion, illiterates demonstrate poorer performance in a diversity of motor tests, including reproducing movements and sequences of movements, alternating movements with both hands, and imitating meaningless movements.
Calculation and Number Processing
The assessment of calculation and number processing in illiterates and semiliterates after a brain injury is often a complex task because these processes are closely linked to education. On the other hand, calculation is present in myriad daily life situations, such as in the use of money, means of transportation (bus routes, subways, trains), telephone numbers, and mental calculations.
An international group of neuropsychologists created a battery of tests (EC 301) for evaluating calculation and number processing in literate brain-damaged adults ( Deloche et al., 1994 ). This instrument was adapted into several languages (English, Finnish, French, German, Greek, Italian, Portuguese, and Spanish), thus providing a common tool for structurally equivalent evaluations of examinees’ abilities. Nevertheless, the use of this tool in illiterates and semiliterates was shown to be ineffective. A standardized, validated version of the original EC 301 Battery in Portuguese was developed in Brazil. Ten simple tasks assessing counting, number processing, elementary calculation, and quantity estimation were presented to 122 normal Brazilian adults, aged between 18 and 58 years with 0, 1, 2, 3, or 4 years of education ( Deloche et al., 1999 ). Tasks such as counting the number of elements in small sets were almost perfectly mastered by these illiterates and semiliterates; however, a sizeable proportion of the sample made errors on other tasks (e.g., those assessing knowledge of the correspondence between numbers and banknotes).
Language abilities have been strongly correlated with a socioeducational level. Low socioeconomic parents use more nonverbal than verbal strategies with children ( Robinson, 1974 ). Along the same lines, the language used by people with a low socioeconomic level is less fluent and has a simpler grammatical structure; it relies much more on emotional than on logical strategies ( Bernstein, 1974 ). Similarly, rural, unschooled children may lack symbolic representation skills because their linguistic ability is tied to the immediate context of the referent ( Bruner, Oliver, & Greenfield, 1966 ). Thus, it appears that formal education facilitates the development of language into a fully symbolic tool. At least one study ( Lantz, 1979 ), however, showed that rural unschooled children performed better than schooled Indian or American children in coding and decoding culturally relevant objects, such as grain, and seeds. Thus, children without formal schooling were able to separate language symbols from the physical referent and to use those symbols for communicating accurately, but display of this ability depended on the cultural relevance of the stimuli used ( Laboratory of Comparative Human Cognition, 1983 ). In fact, the significance of schooling lies not just in the acquisition of new knowledge, but in the creation of new motives and formal modes of discursive verbal and logical thinking divorced from immediate practical experience ( Luria, 1976 ).
Verbal fluency tests have been administered to illiterate populations in several countries. Table 4 presents the results of the available normative studies for the category “animals.” Most frequently, the number of animals found in 1 min is about 10–12. With increasing education, the number of items progressively increases.
Animal fluency in illiterates
| Author . | Place . | . | Mean age . | . | Animals . | . |
|---|---|---|---|---|---|---|
| Aruaco Indians (Colombia) | 5 | 26.2 | 2.9 | 9.8 | 1.5 | |
| Brazil | — | — | — | 11.9 | — | |
| Brazil | — | — | — | 12.1 | — | |
| Greece | 19 | 72.0 | 7.6 | 11.8 | 3.2 | |
| USA | 43 | 74.8 | 5.7 | 11.5 | 3.1 | |
| Mexico | 10 | 38.2 | 10.7 | 13.5 | 3.0 | |
| Mexico | 25 | 46 | — | 10.4 | — | |
| Mexico | 50 | 21.3 | 3.3 | 13.2 | 3.7 | |
| Mexico | 50 | 39.6 | 6.7 | 13.7 | 4.5 | |
| Mexico | 49 | 58.8 | 4.1 | 12.7 | 5.0 | |
| Mexico | 50 | 71.2 | 4.0 | 13.1 | 7.1 | |
| Ostrosky and colleagues (2004) | Maya Indians (Mexico) | 7 | 58.4 | 8.8 | 11.0 | 2.5 |
| Ostrosky, Ramirez, and Ardila (2004) | Pame Indians | 7 | 53.6 | 6.1 | 11.8 | 4.0 |
| ) | Portugal | 23 F | 62.0 | 7.1 | 10.8 | 3.7 |
| Colombia | 100 | 16–65 | — | 10.6 | 3.4 |
Performance on phonemic or letter fluency tests is extremely difficult for illiterates. Available data suggest that letter fluency in illiterates may be about 3–4 words in 1 min, at least for Spanish and Greek, although this could vary by language (e.g., Kosmidis et al., 2004 ; Montiel & Matute, 2006 ; Ostrosky et al., 1999 , 2004).
Language repetition ability in illiterates is equivalent to that of schooled literates if real, high-frequency words are presented. However, when using pseudowords, difficulties are observed ( Kosmidis et al., 2004 ; Petersson et al., 2000 ; Reis & Castro-Caldas, 1997 ). Similarly, illiterates repeat high-frequency, but not low-frequency, words normally ( Rosselli et al., 1990 ). Of course, low-frequency words may be equivalent to pseudowords for a person with a limited vocabulary. Reis and Castro-Caldas (1997) proposed that illiterate individuals (a) have difficulties in repeating pseudowords, (b) are worse at memorizing pairs of phonologically related words compared with pairs of semantically related words, and (c) have difficulties in generating words according to a formal criterion. Illiterate persons use strategies that are good for semantic processing, but inadequate for explicit phonological analysis, while literate individuals are able to use several parallel running strategies.
It can be conjectured that vocabulary size is significantly correlated with educational level, considering that current educational systems are especially directed toward reinforcing verbal abilities and verbal knowledge. Reis, Guerreiro, and Castro-Caldas (1994 ) and Reis, Petersson, Castro-Caldas, and Ingvar (2001) compared schooled literates and illiterates on the task of naming real objects, naming photographs of these objects, and naming drawings of them. Results showed that although both groups performed similarly at naming real objects, illiterates performed more poorly on naming photographs and even more poorly on naming drawings. The authors suggested that introducing color information was useful in improving the performance of illiterates in naming drawings ( Reis et al., 2001 ). Therefore, increasing the amount of information contributed to better access to the name.
Metalinguistic Awareness
It has been observed that illiterate versus literate people do not differ in categorical perception of phonemes, but illiterate people display a less precise categorical boundary and a stronger lexical bias ( Serniclaes et al., 2005 ; Ventura, Kolinsky, Querido, Fernandes, & Morais, 2007 ). Literacy, however, has been related to metalinguistic awareness (which can be regarded as an executive function), since it is by means of the latter that it is possible to turn aspects of language into objects of reflection. Specifically, studies associated with phonological awareness suggest that learning to read leads children to dissect language into small, nonmeaningful units. Illiterate adults find it difficult to consider words and nonwords as sequences of phonemes ( Morais, Cary, Alegria, & Bertelson, 1979 ) and, as a consequence, they underperform on tasks that require thinking about the words’ phonemic characteristics (e.g., phonemic fluency tasks; Kosmidis et al., 2004 ; Reis & Castro Caldas, 1997 ).
However, illiterate performance is better, although still inferior to that of schooled literates, when the critical unit is the syllable rather than a phoneme, as well as on rhyme detection ( Morais, Bertelson, Cary, & Alegria, 1987 ). When comparing illiterate to literate nonschooled groups on explicit phonological awareness tasks, Montiel and Matute (2006) found equivalent performance between groups when dealing with syllables, but differences on the onset detection task and on the initial phoneme detection test. Nonetheless, both groups diverge from the schooled literate group on more complex phonemic awareness tasks, such as phonemic segmentation, phoneme blending, and initial phoneme deletion. Illiterate children had difficulty in identifying the number of words in an oral sentence, suggesting that illiterate children find it difficult to think about language as a string of words.
The aforementioned findings suggest that the influence of literacy extends beyond mere explicit phonemic awareness to affect metalinguistic awareness, as well.
Visuoperceptual and Spatial Abilities
One visual-spatial effect of reading is the training of a specific direction of visual scanning (left to right, for most European-origin writing systems). Using nonlinguistic stimuli, Ostrosky-Solís, Efron, and Yund (1991) studied the scanning mechanism through a computer target detection paradigm in 60 illiterate and 60 literate individuals matched on a socioeconomic level. Although target detection accuracy was identical in the two groups, there were significant differences between the dectectability gradients of the literate and illiterate groups, suggesting that learning to read trains the scanning mechanisms toward more consistent scan paths. Padakannaya and colleagues (2002) administered a picture array naming and recall task to three groups of child readers—unidirectional right-to-left readers of Arabic, unidirectional left-to-right readers of Kannada, and bidirectional readers of Urdu and English—and one group of Urdu illiterate adults. The results showed a right-to-left direction of visual scanning in the Arabic and Urdu readers. In the latter group, the strength of the scanning effect decreased with more schooling in English. No right-to-left effect was observed in Kannada readers or Urdu illiterates. These results suggest that the reading direction can affect scan habits in nonlinguistic tasks. The same effect has been documented in drawing.
Vaid, Singh, Sakhuja, and Gupta (2002) analyzed the influence of reading/writing direction and handedness on the direction of stroke movement in free-hand figure drawing. Adult readers of scripts with opposing directionality (Hindi vs. Urdu) and illiterate controls were observed while drawing a tree, a hand, a house, an arrow, a pencil, and a fish. Right-handers (including right-handed illiterates) and left-to-right readers drew most figures from left to right, whereas left-handers (including left handed illiterates) and right-to-left readers more often drew the figures from right to left.
Various neuropsychological studies have shown significant differences between schooled literates and illiterates in performing spatial and visuoperceptual tests. Ardila, Rosselli, and Rosas (1989 ) administered a basic neuropsychological test battery to two extreme educational groups: Illiterate and professional adults, matched by sex and age. All of the visuospatial tasks (copying a cube, a house, and the Rey–Osterrieth Complex Figure; telling the time on a clock; recognizing superimposed figures; recognizing the national map; and drawing the plan of the room) differentiated the two extreme educational groups. Matute and colleagues (2000) used four stick construction tasks (a test with a higher ecological validity for illiterates than copying figures) in illiterate, semiliterate, and literate participants. Although illiterates generally made more errors than semiliterates and semiliterates more than schooled literates, only some of these differences were statistically significant. Significant differences were found for lack of global fidelity and disarticulation errors when all four figures were considered together. Dansilio and Charamelo (2005) used both figure copying and constructional abilities in 15 illiterates and a matched group with about 6–7 years of school. The most frequent and relevant findings in illiterates in figure copying were an inability to reproduce the perspective (13 of 15), unfolding (4 of 15), and unstructured copying (3 of 15). No errors were observed on the stick construction task.
Gonçalves (2004) emphasized the difficulty illiterates had in copying drawings. As can be seen in Fig. 2 (reproduced from Castro-Caldas, 2004 ), an illiterate copied one of the Bender drawings following a sequence that did not respect the idea of two separate but connected elements, which is the way literate individuals tend to read the drawing. This resembles the concept of integrative agnosia proposed by Riddoch and Humphreys (1987) . Visually guided hand motor behavior may also be biased by literacy. In a test paradigm in which literate and illiterate individuals were asked to direct the cursor toward a target on the screen of a computer using the mouse, illiterate individuals were slower then literate controls, in particular when the right hand had to move the cursor to the left side of the screen. This crossed condition is apparently trained by writing ( Reis & Castro-Caldas, 1997 ).

Sequence of copying (right) of a Bender drawing (left).
Culture and literacy can affect strategies used to recall information. Barltlett (1932) proposed that illiterates more frequently use rote learning whereas literate people use more active information integration procedures (“metamemory”). Cole and Scribner (1974) observed that when memorizing information, schooled literates and illiterates make use of their own groupings to structure their recall; for instance, high-school students rely mainly on taxonomic categories, whereas illiterate bush farmers make little use of this principle. The authors argue that cultural differences in memorizing do not consist in the presence or the absence of mnemonic techniques in general, but in the utilization of a specific technique: Reorganization of the to-be-remembered material. This particular strategy for recall could be tied to school learning experiences.
Illiterates generally perform more poorly than schooled literates on conventional neuropsychological memory measures such as wordlist learning and recall ( Ardila et al., 1989 ; Cole, Frankel, & Sharp, 1971 ; Cole, Gay, Glick, & Sharp, 1971 ; Folia & Kosmidis, 2003 ; Montiel & Matute, 2006 ; Nitrini et al., 2004 ), story learning and recall ( Montiel & Matute, 2006 ), verbal paired associates ( Montiel & Matute, 2006 ; Reis & Castro-Caldas, 1997 ), digits backwards ( Montiel & Matute, 2006 ), number-months (an adaptation of the Wechsler Memory Scale III Letter-Number Sequencing task), and complex figure drawing ( Ardila et al., 1989 ). However, the performance of illiterates seems to approach that of literates on object memory ( Folia & Kosmidis, 2003 ; Nitrini, Caramelli, Herrera, Porto, et al., 2004 ) and wordlist recognition memory ( Ardila et al., 1989 ). Illiterates’ low performance in memory tests may be specific to some of the psychometric procedures generally used in testing memory.
The discrepancy observed between poor free recall and good recognition of illiterate individuals on object learning tasks suggests inefficient encoding and retrieval strategies or poor organization of the material to be learned ( Eslinger & Grattan, 1993 ). Recall of learned information generally occurs without cues or external support, requiring considerable self-initiated activity and executive skills in addition to memory abilities ( see Parkin & Leng, 1993 ). Among illiterates, these skills may be adequate for a relatively passive cognitive process such as efficient recognition of stimuli learned through repetition, yet inadequate to support a relatively active and effortful cognitive process such as free recall. This contention is supported by the findings of an improvement in cognitive functions, including verbal memory, not specifically targeted in an adult learning-to-read program; presumably, learning to read enhanced metacognitive abilities such as using analytic strategies, planning, and organizing output sequences, in this sample ( Ardila, Ostrosky & Mendoza, 2000 ). Whether this improvement is a direct result of literacy acquisition or of schooling is not clear.
A PET scan study found no group differences between schooled literates and illiterates on encoding and retrieving paired associate words ( Petersson et al., 2000 ). Both groups showed a positive correlation between cued-recall success and the activation of the left inferior prefrontal cortex and the medial temporal lobes during encoding, suggesting that literacy and schooling do not alter the basic neuroanatomy of encoding verbal material.
Test-Wiseness
Test-wiseness refers to the examinee's knowledge of how tests are designed, the expectations behind tests, and strategies for taking tests, independent of the content the tests are designed to measure Thorndike (1951) . It is seen as a nuisance variable that gives its possessors better scores on tests which may not necessarily reflect better abilities on the capacity being measured. Much of the literature on test-wiseness has investigated students well-entrenched in an educational career and examined relatively sophisticated test strategies in group administered tests, suggesting that effects are modest ( Green & Stewart, 1984 ). However, what few studies are available for very young children and for those from developing countries suggest that the effect is more substantial for these populations. Therefore, an important part of the differences between illiterates and literates on cognitive tests may have to do not so much with cognitive abilities per se , as with test-taking abilities and familiarity. Test taking and, consequently, test-wiseness are most likely skills learned primarily in school ( Nell, 2000 ).
The Effect of Increasing Schooling Time
Even 1 or 2 years of school can make a significant difference in performance on some neuropsychological tests. Ostrosky, Ardila, Rosselli, López-Arango, and Uriel-Mendoza (1998) examined 64 illiterates, 64 adults with 1–2 years of school, and 64 adults with 3–4 years of school with the NEUROPSI. Statistically significant differences were found between the illiterates versus 1–2 years of school—favoring the latter—on the Language Comprehension, Phonological Verbal Fluency, and Similarities subtests. Significant differences were observed between illiterates versus 3–4 years of school—favoring the latter—in the following subtests: Visual Detection, 20–3, Copy of a Semicomplex Figure, Calculation Abilities, Sequences, Alternating movements, Recall of words: Cueing, and Recall of a Semicomplex Figure (Table 5 ).
Mean ( SD ) performance and comparisons of groups by the level of education on NEUROPSI neuropsychological tests (adapted from Ostrosky et al., 1998 )
| Tests . | Score range . | Years of schooling | Significant differences . | ||
|---|---|---|---|---|---|
| . | . | 0 . | 1–2 . | 3–4 . | . |
| Visual detection | 0–16 | 9.9 (4.5) | 11.2 (4.1) | 12.5 (3.2) | G3 versus G1 |
| 20 minus 3 | 0–5 | 3.1 (1.9) | 3.1 (1.7) | 4.1 (1.2) | G3 versus G1,G2 |
| Semicomplex figure (copy) | 0–12 | 7.5 (2.0) | 8.8 (2.4) | 9.4 (1.9) | G3 versus G1,G2 |
| Language: Comprehension | 0–6 | 3.7 (1.2) | 4.4 (0.8) | 4.6 (1.0) | G1 versus G2,G3 |
| Phonological fluency | 0–15 | 3.1 (3.7) | 6.5 (4.0) | 7.0 (4.1) | G1 versus G2,G3 |
| Similarities | 0–6 | 2.1 (2.2) | 3.5 (2.1) | 3.9 (1.9) | G1 versus G2,G3 |
| Calculation abilities | 0–3 | 0.9 (1.0) | 1.5 (1.1) | 1.6 (1.1) | G3 versus G1,G2 |
| Sequences | 0–1 | 0.1 (0.3) | 0.2 (0.4) | 0.4 (0.5) | G3 versus G1,G2 |
| Alternating movements | 0–2 | 0.8 (0.7) | 1.1 (0.7) | 1.3 (0.7) | G3 versus G1 |
| Recall: Words Cueing | 0–6 | 4.1 (1.4) | 4.3 (1.4) | 4.7 (1.4) | G3 versus G1 |
| Semicomplex figure | 0–12 | 6.3 (2.2) | 7.0 (2.4) | 8.4 (2.3) | G3 versus G1,G2 |
Notes: G1 = illiterates; G2 = 1–2 years of school; G3 = 3–4 years of school.
Nonetheless, when comparing the scores in the same NEUROPSI test battery of participants with 10–12, 13–17, and 18–24 years of school, only a few significant differences were found. These observations indicate that the educational effect on neuropsychological test performance is “not” linear. Differences between zero and 3 years of education are usually highly significant; differences between 3 and 6 years of education can be lower; between 6 and 9 are even lower; and so forth, with virtually no differences between, for example, 12 and 15 years of education . This means that on neuropsychological tests, education effects represent a negatively accelerated curve, tending to plateau. This is not surprising, considering that, in general, neuropsychological tests have a low ceiling. Another consequence of this finding is that neuropsychological tests that show no education effect between, for example, North Americans with fewer and greater than 12 years of education (but with no fewer than 8 years of education) cannot be safely extrapolated to assume no educational effect for fewer than 8 or as low as 0 years of education.
The length, qualities, and content of the school day and year vary considerably from country to country and even from school to school. More refined measures of length and qualities of schooling are needed in future studies.
Studies in Illiterate Children
In almost all occidental cultures, formal reading acquisition starts as soon as aged 5–6. Thus, the process to become literate starts early in childhood; however, little attention has been paid to illiterate condition in children. A pioneer study in illiterate children was performed in Mexico, with the aim to investigate whether or not the effects of literacy on neuropsychological test performance are already evident during childhood, as has been reported previously for illiterate adult populations. Seeking that purpose, the performance of 21 illiterate children and 22 literate children aged 6–13 was compared on 13 cognitive domains of the “Evaluación Neuropsicológica Infantil” (ENI; “Child Neuropsychological Assessment”): Attention, constructional abilities, verbal memory coding and delayed recall, visual memory coding and delayed recall, tactile perception, visual perception, auditory perception, oral language, metalinguistic awareness, calculation, and spatial abilities. Demographic variables were controlled to avoid effect of socioeconomic characteristics. For the illiterate group, school nonattendance was due to social-family reasons, thus controlling learning disabilities effects. Results showed that the illiterate group significantly underperformed the literate group in mostly all measures except tactile perception. Moreover, age was a significant covariant, where higher scores were related to older ages in both groups. However, when analyzing the cognitive domains that it is known that are related to schooling (metalinguistic awareness and calculation), it was found that metalinguistic awareness task performance improve with age in literate children but it was not the case for the illiterate group; at the same time for the calculation abilities, an effect of age was evident in both groups suggesting that math learning is school and environment-dependent ( Matute et al., Submitted ).
Executive Function was also investigated in these two groups (Matute et al., unpublished) four domains were analyzed: Verbal fluency, mental flexibility, planning and concept formation, and reasoning where 8 measures were compared: Verbal fluency, semantic verbal fluency, phonemic verbal fluency, categories achieved in the card sorting test (mental flexibility test), number of correct designs done with the minimum number of movements in the Pyramid of Mexico Test (a planning and organization test), similarities, and matrices and arithmetic problems. With the exception of the matrices test, the illiterate children scored significantly below the literate children suggesting that differences in the development of executive functions between these two populations are already evident in childhood. The absence of difference in matrices test is related to low score in both groups; thus, it could be possible that those skills underlying this type of test are acquired at a later stage, and intergroup differences would not be evident in childhood.
Learning to Read in Children Versus Learning to Read in Adults
Several studies were designed to compare brain activation of individuals who learned to read and write in childhood at the usual age and those who learned in adulthood. In one of these studies, participants were asked to identify written words during magnetoencephalography (MEG). Results showed that late literates had more late sources of activity in right temporoparietal areas than their controls, who, on the other hand, had more early activation of left inferior frontal areas ( Castro-Caldas, Peterson, Reis, Askelof, et al., 1998 ; Castro-Caldas, Petersson, Reis, Stone-Elander, et al., 1998 ). This suggests that the mechanisms related to reading are different in late literates despite similar performance on the task for both groups. Castro-Caldas and colleagues (2009) in a further study compared late literates to controls to subjects that learned at school at the usual age. MEG was done while subjects were reading words. It was found that although the reading performance was the same in both groups while performing the task, the pattern of source distribution was different between groups. There were more late sources in the right temporoparietal areas of late literates compared with controls and more late sources in the left inferior frontal cortex in control subjects. It is concluded that learning to read in adulthood is a process supported by different brain structures from the ones used when learning occurs at the usual age. Castro-Caldas, et al., (2009) compared seven women who learned how to read and write after the age of 50 (ex-illiterates) and five women with 10 years of regular schooling (controls) in a language recognition test while brain activity was being recorded using MEG. It was found that both groups performed similarly on the task of identifying target words. Analysis of the number of sources of activity in the left and right hemispheres revealed significant differences between the two groups, showing that ex-illiterate subjects exhibited less brain functional asymmetry during the language task. These findings were interpreted as reinforcing the concept that poorly educated subjects tend to use the brain for information processing in a different way to subjects with a high-educational level or who were schooled at the regular time.
The Gender Effect
Gender differences in cognitive abilities have been widely analyzed during the last decades (e.g., Buffery & Gray, 1972 ; Caplan, Crawford, Hyde, & Richardson, 1997 ; Hedges & Nowell, 1995 ; Maccoby & Jacklin, 1974 ). Three major differences between men and women in cognitive abilities have usually been reported: (a) verbal abilities, favoring women; (b) spatial abilities, favoring men; and (c) arithmetical abilities, favoring men. Differences in calculation abilities have sometimes been interpreted as a result of men's superior spatial abilities ( Benbow, Libinski, Shea, & Eftekhari-Sanjani, 2000 ; Geary, 1996 ).
The origin of these differences is not clear, even though some neurological (e.g., Blanch Brennan, Condon, Santosh, & Hadley, 2004 ; Rilea, Roskos-Ewoldsen, & Boles, 2004 ) and environmental (e.g., Quaiser-Pohl & Lehmann, 2002 ) factors have been proposed. Gender differences have also been associated with hormonal influences (e.g., Aleman, Bronk, Kessels, Koppeschaar, & van Honk, 2004 ).
The collaborative Mexican–Colombian research program on the effects of education on neuropsychological test performance has consistently found over the last 30 years that education significantly interacted with gender (e.g., Ardila et al., 1989 , 1992 ; Ostrosky et al., 1985 , 1986 , 1998 ; Rosselli et al., 1990 ). On most neuropsychological tests, among illiterates or people with limited education, men outperformed women, a gender difference which decreased as the level of education increased and virtually disappeared at about the level of a high-school education. To the best of our knowledge, such an interaction between gender and education on cognitive testing has not been reported elsewhere. As an illustration, Fig. 3 presents the scores obtained from individuals with different levels of education in the Rey–Osterrieth Complex Figure. As clearly observed, scores are about 20% higher in illiterate men than in illiterate women. When increasing the education level, differences become progressively smaller and after about 12 years of school, performance is virtually identical.

Performance in the Rey–Osterrieth Complex Figure in normal adults with different levels of education (age = 21–75 years; N = 824) (adapted from Ardila et al., 1989 ; Rosselli & Ardila, 2003 ).
We may assume that this gender difference can be partially due to the characteristics of the population from which the sample was recruited. In Latin American countries, it is not unusual to find that low-educated women remain at home and are solely responsible for child care and house work, particularly for the historical age cohorts in which these studies were carried out. Men go to the factory (or elsewhere) to work and, thus, acquire a more complex understanding of their environment (navigating around the city, taking buses, and similar); they maintain a higher level of social interaction, they handle money, and they are much better informed about national and international events. Simply speaking, they have a higher level of stimulation and use a greater amount of information than women, at least regarding skills needed for the tests used. Studies in other populations are required in order to support or reject this interpretation. This effect suggests that, at least for this population, formal education may have an equalizing gender effect on some cognitive skills, rather than being responsible for gender differences. In any case, these findings suggest that education does have an impact on gender differences in cognitive tests.
Age-Related Cognitive Decline in Illiterates
Capitani, Barbarotto, and Laicana (1996) proposed three possible patterns of association between age–related decline and education: (a) Parallelism: Age–related decline runs the same course in different educational groups, that is, no interaction; (b) Protection: Age–related decline is attenuated in well–educated participants; and (c) Confluence: The initial advantage of well–educated groups in middle age is reduced in later life. The researchers explored these hypotheses in a group of 307 Italians aged 40–85 and mean education levels of 6 versus 13 years; their data supported the parallelism theory for verbal fluency, spatial memory, and Raven's Progressive Matrices, but the protection theory for visual attention and verbal memory. Confluence was not observed on any of their five tests. They concluded that the protective effect of education is not ubiquitous, but depends on the specific cognitive ability measured.
With a wider age and education range on the NEUROPSI, Ardila and colleagues (2000) found parallelism, protection, and two different subtypes of confluence (upward and downward; Table 6 ). For some subtests, a specific pattern was not evident. They, too, concluded that different patterns of age–related cognitive decline and education may be found, depending on the specific cognitive domain. These results agree with Capitani and colleagues for verbal memory, but not for verbal fluency, and other domains (and the participant samples) are not comparable. Furthermore, these are cross-sectional studies and subject to possible cohort effects.
Examples of different patterns of cognitive decline across age ranges; mean scores and standard deviations (in parentheses) are presented
| . | Age (years) | |||
|---|---|---|---|---|
| . | 16–30 . | 31–50 . | 51–65 . | 66–85 . |
| Parallelism: Copy of a Figure | ||||
| Over 10 years | 11.8 (0.5); 100% | 11.7 (0.5); 99% | 11.3 (1.2); 95% | 10.9 (1.4); 92% |
| Illiterates | 8.1 (2.1); 100% | 7.9 (1.8); 97% | 7.6 (2.2); 94% | 7.2 (2.7); 89% |
| Protection: Recall of Words | ||||
| Over 10 years | 5.3 (0.9); 100% | 4.9 (1.2); 92% | 4.6 (1.5); 87% | 3.7 (1.8); 70% |
| Illiterates | 4.3 (1.6); 100% | 3.6 (2.2); 84% | 2.4 (2.4); 56% | 2.1 (2.3); 49% |
| Confluence upwards: Digits Backwards | ||||
| Over 10 years | 4.3 (1.0); 100% | 4.4 (1.0); 102% | 4.0 (1.0); 93% | 3.9 (1.1); 90% |
| Illiterates | 2.2 (1.1); 100% | 2.8 (1.1); 127% | 2.9 (1.0); 132% | 2.7 (0.9); 123% |
| Confluence downwards: Semantic Verbal Fluency | ||||
| Over 10 years | 21.6 (5.4); 100% | 22.3 (5.0); 103% | 20.1 (5.1); 93% | 18.4 (4.8); 85% |
| Illiterates | 13.2 (3.7); 100% | 13.7 (4.5); 104% | 12.7 (5.0); 96% | 13.1 (7.1); 99% |
Note: In each case, performance at the 16–30 years is taken as 100% (adapted from Ardila, Ostrosky & Mendoza, 2000 ).
Dementia in Illiterates
Decreased prevalence and incidence of dementia among persons with a higher level of education have been reported by some population-based studies ( Qiu et al., 2001 ; Zhang et al., 1990 ), findings that have been explained by the cognitive reserve hypothesis, which holds that the individual differences in how tasks are processed provide differential resistance against brain pathology or age-related changes ( Katzman et al., 1989 ; Stern, 2006 ). According to this hypothesis, highly educated individuals may either have greater neural reserve, that is, brain networks that are less susceptible to disruption, or they may have more neural compensation, which renders them more capable of developing efficient strategies to cope with the negative effects of disease and ageing ( Stern, 2006 ). In a postmortem study of a large number of elderly individuals, between 12%–19% of the individuals fulfilled neuropathological criteria for Alzheimer's disease (AD), although they had not been considered demented during life. When the authors investigated this phenomenon, they found that as the number of years of formal education increases, the odds of a clinical dementia diagnosis decreases by approximately 0.82–0.87 with each additional year of education, thus supporting the cognitive reserve hypothesis ( Roe, Xiong, Miller, & Morris, 2007 ).
A positive association between AD and low education has been found in many studies (e.g., Callahan et al., 1996 ; Friedland, 1993 ; Katzman, 1993 ; Letenneur, Commenges, Dartigues, & Barberger-Gateau, 1994 ; Liu et al., 1994 ; Mortimer & Graves, 1993 ; Rocca et al., 1990 ; Yu et al., 1989 ; Zhang et al., 1990 ) carried out in different countries: Brazil ( Caramelli et al., 1997 ), China ( Hill et al., 1993 ; Yu et al., 1989 ), Finland ( Sulkava, Wikstrom, & Aromaa, 1985 ), France ( Dartigues, Gagnon, & Michel, 1991 ), Italy ( Bonaiuto, Rocca, & Lippi, 1990 ; Rocca et al., 1990 ), Israel ( Korczyn, Kahan, & Gulper, 1991 ), Sweden ( Fratiglioni et al., 1991 ), and the USA ( Stern et al., 1994 ). In a Brazilian population study ( Herrera, Caramelli, Silveira, & Nitrini, 2002 ), the prevalence ratio of dementia in illiterates was 3.5 times higher than in those with 8 or more years of schooling (Table 7 ). Given that the low-educational level is often coupled with the low socioeconomic level, the authors performed a multivariate analysis, which confirmed that the low-educational level was associated with the higher prevalence of dementia ( Herrera et al., 2002 ).
Prevalence of dementia in relation to educational level (adapted from Herrera et al., 2002 )
| Schooling . | . | Mean age ( ) . | Dementia ( ) . | Dementia (%) . | Prevalence ratio . |
|---|---|---|---|---|---|
| Illiterate | 567 | 74.6 (7.1) | 69 | 12.2 | 3.5 |
| 1–3 years | 590 | 72.2 (5.9) | 26 | 4.4 | 1.2 |
| 4–7 years | 356 | 72.1 (6.4) | 18 | 5.0 | 1.4 |
| 8 years or more | 143 | 72.5 (6.7) | 5 | 3.5 | 1 |
a The prevalence in this age group was taken as reference.
In a recent analysis of six Latin American studies, which included 26,199 elderly, dementia was two times more frequent in illiterate than in literate individuals, a relevant finding because the pooled data show that the rate of illiteracy among the elderly was approximately 10%. Significant differences of prevalence between illiterate and literate individuals were observed in seven out of the eight population studies ( Nitrini et al., 2009 )
Negative results, however, have also been reported (e.g., Christensen & Henderson, 1991 ; Knoefel et al., 1991 ; O'Connor, Pollitt, & Treasure, 1991 ; Rocca et al., 1990 ). For instance, the Framingham study found no association between the educational levels and the risk of AD ( Knoefel et al., 1991 ) in a predominantly literate population. Furthermore, a pooled analysis of European data ( Launer, Dinkgreve, Jonker, Hooijer, & Lindeboom, 1993 ) showed that the deleterious effect of a lower education was more marked in women than in men. Neither gender nor education was associated with a positive family history of dementia or the presence of the APOe4 allele ( Duara et al., 1996 ). Finally, a study of a predominantly illiterate population in the rural areas of India also failed to detect an influence of education on the prevalence of dementia ( Chandra et al., 1998 ).
The higher prevalence of dementia among illiterates could be explained by possible overdiagnosis in this group due to a lack of test-wiseness. However, a majority of studies adjusted cut-off scores or used tests more appropriate for populations with educational heterogeneity ( Zhang et al., 1990 ), as well as informant questionnaires ( Herrera et al., 2002 ; Nitrini et al., 2004 ), decreasing the likelihood of this possibility.
In an investigation of the factors affecting age of onset and rate of progression of AD, the researchers concluded that AD progresses steadily, regardless of education, occupation, and other factors tested ( Bowler, Munoz, Merskey, & Hachinski, 1998 ); however, the age of referral to a memory clinic, which was correlated with the age of onset, differed according to the educational level. Those with a high level of education tended to be younger upon referral than those with a low level of education. However, the scores in the extended scale for dementia on initial assessment were similar between patients with a low and those with a high level of education. The authors further investigated the influence of education and socioeconomic status in the autopsy-confirmed cases of AD (Munoz et al., 2000). They compared two groups of autopsied patients, 115 confirmed AD and 142 patients 65 years or older without dementia who died in the hospital without neurodegenerative disease. They found no substantial differences in education, occupation, and socioeconomic or income levels between groups.
Hendrie and colleagues (2001) and Ogunniyi and colleagues (2000) compared the prevalence rate of dementia of 2,494 elderly poorly educated Nigerian residents in Nigeria to the prevalence rate of 2,212 African Americans with similar education, living in the USA. The rates of the Nigerians (2.29%) were much lower than the rates for the U.S. group (8.24%), which suggests that education is not the relevant factor for dementia. Furthermore they report different risk factors in these two groups. In Nigeria, old age and female gender were revealed to be significant risk factors, whereas among African Americans old age, rural living below the age of 19 years, low education, and family history of dementia were the risk factors. In addition, the frequencies of the vascular risk factors investigated were lower in Nigerians, which may suggest involvement of environmental factors in disease processes.
In conclusion, the issue of the influence of the educational level on the clinical diagnosis, prevalence, progression, or severity of AD is still far from fully understood. Indeed, we may find some differences between the well-selected groups of participants. These differences may be a reflection of cognitive strategies used based on different levels of school achievement. More prospective and well-designed studies are needed to further clarify this topic.
Two opposing points of view have emerged in the neuropsychological literature regarding the influence of education on brain organization of language. Cameron, Currier, and Haerer (1971) reported a lower frequency of aphasias associated with injuries of the left hemisphere among right–handed illiterate patients than among educated ones. The authors concluded that language is more bilaterally represented in the illiterate group. In contrast, Damasio and colleagues (1976) claimed that there is no qualitative or quantitative difference between the aphasias of educated and illiterate patients. The aphasia of schooled literates or illiterates did not differ in the prevalence rate, distribution of clinical types, or semiological structure.
Matute's research (1988) supports the Damasio and colleagues (1976) conclusions. She compared three groups of right–handed Mexican adults: Brain–damaged illiterates, brain–damaged literates, and normal illiterates. An aphasia test was given to all three groups in the context of a more extensive neuropsychological assessment. No differences between the two brain damaged groups were evident in regard to language measures related to repetition, oral expression, and comprehension. However, when analyzing incidence of aphasia due to unilateral brain lesions, all left hemisphere–damaged illiterates presented aphasia, although the lesion locus for some of them were out of the perisylvian area, whereas none presented aphasia after right hemisphere damage. Thus, the data obtained in this study suggest a less intrahemispheric specialization for language on the left hemisphere in illiterates.
The hypothesis that illiterates might have a different cerebral organization for language and, therefore, deviate from literates in their clinical profile; the severity of their aphasia or their prognosis was evident as early as 1867 with Scoresby–Jackson's observation of an illiterate patient. This author presented a case of an illiterate patient with a severe motor aphasia. After the postmortem exam, the author found that although the lesion was very extended in the left hemisphere, the frontal lobe was attainted only in the posterior part of the third frontal circumvolution, where Broca had located the spoken language. Since it was only the posterior part of the third frontal circumvolution that was attainted, Scoresby–Jackson suggested that a bigger part of this circumvolution would participate in language only with a grater language acquisition (given by reading acquisition). Thus, in the illiterate people, it would be only the posterior extreme of the third frontal circumvolution that will be active in language expression, whereas in a literate person, all the circumvolution will be employed. Finally, the author stated that language and writing will be learned with the posterior part of the left third frontal circumvolution and with the experience given by the “exercise in the art of speaking and writing” a larger part of this circumvolution will be employed. Critchley (1956) was probably the first author to suggest that hemispheric functional asymmetry could be influenced by schooling. He suggested that low-educated persons tended to have less left hemispheric lateralization for language functions. This suggestion was supported by Wechsler's (1976) interpretation of the crossed aphasia in his illiterate patient ( Castro-Caldas et al., 1987 ).
Fonseca and Castro-Caldas (2002) compared the recovery process of literate and illiterate aphasics. They studied 24 illiterates and compared those with 42 schooled literates matched for age, gender, and type of aphasia. Generally, all scores obtained in subtests of the Aphasia battery were lower in illiterates than they were in literate controls. Patients were tested in the first month of their disease and 6 months later. The global scores of aphasia improved similarly in both groups; however, the correlation between the test scores suggested that the process of recovery was different for each group.
Lecours and colleagues (1987a , 1987b , 1988 ) studied the relationship between brain damage and schooling with regard to aphasic impairments of language. On the basis of their findings, the authors concluded that: (a) There was a greater right–hemisphere language involvement in illiterates than in the well–educated patients; and (b) left–stroke school–educated patients seemed to be “sicker,” as it were, than their illiterate counterparts, that is: (i) The classical symptoms of aphasia (suppression stereotype, jargon aphasia) were more apparent among left stroke schooled literates than among left–stroke illiterates; and (ii) auditory comprehension was more frequently impaired among the left stroke literate patients.
Lecours and colleagues (1987b) also studied the influence of education on unilateral neglect syndrome. They analyzed a large sample of right–handed unilingual brain–damaged individuals: Illiterates (left stroke and right stroke) and schooled literates (left stroke and right stroke). Evidence of a unilateral neglect syndrome was found in both left- and right-brain-damaged schooled literates and illiterates. Their results provided no indication that tropisms were globally stronger depending on the side of the lesion or on the educational level of the patients. Rosselli, Rosselli, Vergara, and Ardila (1985) , however, reported a higher frequency of right hemispatial neglect in low–educated patients.
In summary, studies of brain–damaged illiterates, when compared with brain–damaged literates, have indicated that: (a) Literacy does not change the dominance of the left hemisphere for language, illiterates as well as literates present aphasia most often after left brain damage, and not after right brain damage; and (b) the right hemisphere appears to have a disproportionate involvement in language in illiterate when compared with literate individuals. This is based on the following evidence: Left-damaged literates present a larger number of errors in aphasia tests than left-damaged illiterates ( Lecours et al., 1988 ; Matute, 1988 ) and right–damaged illiterates more frequently present poorer performance in aphasia tests than right-damaged literates ( Lecours et al., 1987a , 1987b ).
Some Clinical Implications
Brain injury, either due to stroke or TBI, may have various clinical manifestations, depending on the brain areas affected. The individual may develop isolated or associated disorders of language, reading, writing, calculation, memory, attention, vision, visuoconstruction, behavior, and/or movement. These problems need to be identified in order to establish an adequate rehabilitation program. However, identifying many of these disorders is sometimes difficult because there are still very few neuropsychological tools created for, standardized, and normed on illiterates. Furthermore, many existing tests depend on content or processes related to education. It is often challenging to distinguish whether test difficulties experienced by an illiterate individual are due to brain injury or if they are preexistent, because the individual never learned the skills being measured.
Tests that have already been standardized on illiterates in different countries, include the MMSE, NEUROPSI, NEUROPSI Attention and Memory, Rey–Osterrieth Complex Figure, Luria's fist-edge palm test, motor tests, verbal fluency tests, visuoperceptual and spatial tests, memory tests, executive function tests, calculation, number processing, and others ( Ardila et al., 1989 , 1992 , 2000, 2003; Bertolucci et al., 1994 ; Brucki et al., 2004; Dansilio et al., 2005; Deloche et al., 1999 ; Folia & Kosmidis, 2003 ; Kosmidis et al., 2004 ; Loureiro et al., 2004 ; Nitrini, Caramelli, Herrera, Porto, et al., 2004 ; Nitrini et al., 2004 , 2005 ; Ostrosky-Solis et al., 1985 , 1986, 1998, 1999, 2004; Rosselli et al., 1990 ). Additional research is needed to determine if these norms can be generalized to other illiterate populations and to determine their sensitivity to brain impairment and their prediction of functional abilities. More tools are also needed. However, tests not normed on these populations may be helpful in demonstrating preserved abilities and strengths.
Neuropsychological assessment of illiterates should emphasize history taking, understanding their functioning within their social and cultural context, and exploration of the ways in which that functioning differs from that of their peers and/or from their own premorbid functioning. That history should also include distinguishing whether their illiteracy is due to lack of opportunity or failure to learn.
The neurorehabilitation of illiterate people after brain injury or illness presents challenges to rehabilitation programs oriented toward literates. Neuropsychological rehabilitation yields much more effective results when it is adapted to the individual's specific context ( Lave, 1996 ; Rogoff, 1990 ). Consequently, any such program must take into consideration the person's work environment, family life, and cultural context to maximize success. Current cognitive rehabilitation techniques for memory, and, to some extent, executive functions, tend to favor written compensatory techniques such as memory books and written directions. Such techniques need to be adapted to serve the illiterate patient ( Judd & DeBoard, 2007 ).
Literacy is strongly reflected in the performance of tasks used in psychological, as well as neuropsychological evaluations. Acquiring literacy appears to influence visual perception, logical reasoning, remembering strategies ( Laboratory of Comparative Human Cognition, 1983 ), and formal operational thinking ( Laurendeau-Bendavid, 1977 ). It is a mistake to assume that the inability to perform simple cognitive tasks, such as those frequently incorporated in current neuropsychological test batteries, necessarily means abnormal brain function. The degree of literacy can often represent the crucial variable.
The influence of literacy seems to go further: Literacy may somehow change the brain organization of cognition. Studies of the consequences of brain damage in illiterate populations evidence a more bilateral representation among illiterates than literates not only for linguistic, but probably also for visuospatial abilities. Apparently, literacy does not change the direction of laterality in the brain organization of cognition, but the degree of this lateralization.
School attendance does not mean that educated people simply possess certain abilities that less-educated individuals lack. Reading ability rather seems to represent an additional instrument to extend cognition. Illiteracy does not mean either that highly educated people have the same abilities as less-educated individuals, plus something else. Nonetheless, formal cognitive testing evaluates those abilities in which the educated child was trained. Therefore, it is not surprising that he or she will outperform the child with no formal education. It must be emphasized that the educational level has a substantial relationship with performance on some cognitive tests, but is not systematically related to everyday problem-solving (functional criterion of intelligence; Cornelious & Caspi, 1987 ). It is not totally accurate to assume that people with low levels of education are somehow “deprived”. It may be more accurate to assume that they have developed different types of learning, more procedural, pragmatic and sensory oriented.
Therefore, the effects of literacy and schooling on cognition include the following: Consequently, many of “the effects of literacy are not only due to learning to read, but also to attending school,” and, thus, developing a way of interpreting the world—a cosmovision, so to speak—the cosmovision of learning and understanding.
Literacy provides an additional instrument for acquiring information . Information can be obtained not only using oral tradition, but also from books, journals, and so forth.
The process of learning to read and write may train specific additional abilities , such as explicit phonological awareness, spatial perception, and fine movements.
Reading and writing implies an additional instrument of conceptualization, interpretation, and mediation of the world ( Luria, 1966 ; Vygotsky, 1934/1978 ). Memory not only means being able to recall something, but also recording the information in a notebook (“auxiliary hippocampus”); social communication not only means speaking and listening, but also reading and writing. An explanation about how to improve agriculture can be replaced by a written pamphlet. The instruction about how to go to a particular place can be found through reading a paper or using written street names.
Attending school also has certain consequences on cognition, independent of reading and writing. It contributes to the development of specific attitudes toward knowing, understanding, and thinking. School provides training in reading, but also in mathematics, geography, drawing, history, and natural sciences. Furthermore, school represents a special type of setting centered on specific values: Learning, memorizing, understanding, and achieving. This is not necessarily valid to the same extent in every type of school (e.g., in a school of arts, a trade school or a religious school).
It also appears that lateralized fine motor skills develop in the process of learning to write. Habits in directions of visual scanning also appear to develop with the acquisition of literacy.
It is fairly clear that illiterates generally perform more poorly than literates on a variety of cognitive and neuropsychological tests. The reasons for this are not obvious, but candidate explanations are: The relative weight of each of these factors, or perhaps even other, unknown factors, on the neuropsychological performance of illiterates is not yet known. Future studies in this area are needed to determine the factors that may contribute to differential neuropsychological performance between literates and illiterates, as well as the relative role of the particular cognitive functions being tested, the educational system and philosophy to which examinees were exposed, the particular language, writing system, and/or population from which they have been influenced.
Acquiring literacy develops cognitive skills that are measured by the tests.
Cognitive instruction that is part of schooling but not specifically part of learning literacy develops some of the cognitive skills measured by the tests.
Schooling develops an understanding of what is expected in testing and how to go about taking tests effectively.
Schooling develops a predisposition toward achievement in testing.
The process of elucidating cognitive mechanisms particular to illiteracy, especially as they contrast with those involved in literacy, may help to expand our understanding of human cognition and functional brain organization as they relate to both normal and pathological conditions.
None declared.
Google Scholar
Google Preview
- educational status
| Month: | Total Views: |
|---|---|
| October 2016 | 6 |
| November 2016 | 7 |
| December 2016 | 12 |
| January 2017 | 34 |
| February 2017 | 34 |
| March 2017 | 38 |
| April 2017 | 28 |
| May 2017 | 45 |
| June 2017 | 27 |
| July 2017 | 26 |
| August 2017 | 26 |
| September 2017 | 47 |
| October 2017 | 43 |
| November 2017 | 62 |
| December 2017 | 221 |
| January 2018 | 283 |
| February 2018 | 253 |
| March 2018 | 347 |
| April 2018 | 346 |
| May 2018 | 298 |
| June 2018 | 309 |
| July 2018 | 275 |
| August 2018 | 316 |
| September 2018 | 253 |
| October 2018 | 240 |
| November 2018 | 354 |
| December 2018 | 376 |
| January 2019 | 562 |
| February 2019 | 953 |
| March 2019 | 1,017 |
| April 2019 | 929 |
| May 2019 | 860 |
| June 2019 | 741 |
| July 2019 | 633 |
| August 2019 | 729 |
| September 2019 | 749 |
| October 2019 | 595 |
| November 2019 | 488 |
| December 2019 | 392 |
| January 2020 | 300 |
| February 2020 | 342 |
| March 2020 | 244 |
| April 2020 | 361 |
| May 2020 | 179 |
| June 2020 | 268 |
| July 2020 | 258 |
| August 2020 | 233 |
| September 2020 | 280 |
| October 2020 | 365 |
| November 2020 | 397 |
| December 2020 | 485 |
| January 2021 | 563 |
| February 2021 | 323 |
| March 2021 | 363 |
| April 2021 | 347 |
| May 2021 | 411 |
| June 2021 | 227 |
| July 2021 | 234 |
| August 2021 | 304 |
| September 2021 | 405 |
| October 2021 | 364 |
| November 2021 | 318 |
| December 2021 | 359 |
| January 2022 | 306 |
| February 2022 | 385 |
| March 2022 | 449 |
| April 2022 | 355 |
| May 2022 | 397 |
| June 2022 | 279 |
| July 2022 | 278 |
| August 2022 | 255 |
| September 2022 | 354 |
| October 2022 | 418 |
| November 2022 | 361 |
| December 2022 | 371 |
| January 2023 | 296 |
| February 2023 | 367 |
| March 2023 | 441 |
| April 2023 | 437 |
| May 2023 | 386 |
| June 2023 | 355 |
| July 2023 | 317 |
| August 2023 | 336 |
| September 2023 | 454 |
| October 2023 | 461 |
| November 2023 | 387 |
| December 2023 | 423 |
| January 2024 | 615 |
| February 2024 | 559 |
| March 2024 | 550 |
| April 2024 | 444 |
| May 2024 | 523 |
| June 2024 | 313 |
| July 2024 | 289 |
| August 2024 | 107 |
Email alerts
Citing articles via.
- Recommend to your Library
Affiliations
- Online ISSN 1873-5843
- Copyright © 2024 Oxford University Press
- About Oxford Academic
- Publish journals with us
- University press partners
- What we publish
- New features
- Open access
- Institutional account management
- Rights and permissions
- Get help with access
- Accessibility
- Advertising
- Media enquiries
- Oxford University Press
- Oxford Languages
- University of Oxford
Oxford University Press is a department of the University of Oxford. It furthers the University's objective of excellence in research, scholarship, and education by publishing worldwide
- Copyright © 2024 Oxford University Press
- Cookie settings
- Cookie policy
- Privacy policy
- Legal notice
This Feature Is Available To Subscribers Only
Sign In or Create an Account
This PDF is available to Subscribers Only
For full access to this pdf, sign in to an existing account, or purchase an annual subscription.
Advertisement
Diversity of functional illiterate cases: Results from a multiple-single case study
Diversität funktionaler Analphabeten: Ergebnisse einer multiplen Fallstudie
- Schwerpunkt
- Published: 30 January 2019
- Volume 22 , pages 123–151, ( 2019 )
Cite this article

- Réka Vágvölgyi 1 ,
- Luise Marie Rohland 2 ,
- Moritz Sahlender 3 ,
- Thomas Dresler 1 , 4 ,
- Josef Schrader 1 , 3 , 5 &
- Hans-Christoph Nuerk 1 , 6 , 7
709 Accesses
2 Citations
1 Altmetric
Explore all metrics
Functional illiteracy characterizes people who, despite formal education, do not possess the basic literacy skills to deal with everyday life requirements. Although a few studies have shown the heterogeneity of functional illiteracy, empirical research to differentiate these people at the individual level of more basic skills is lacking. The goal of this study is to assess the linguistic, cognitive, and numerical skills of functional illiterates: first, by comparing cases to each other; second, by comparing them to a literate control group across these domains. For this purpose, a multiple single-case methodology commonly used in neuropsychological case studies was employed, in the field of educational research. The results revealed heterogeneity in one of the literacy tests (leo.), in lexical access, in auditory story comprehension, and in spatial representation of numbers, while the pattern of results indicated more homogeneity in the other literacy test (ELFE 1-6), in non-verbal IQ, in phonological processing, in auditory grammatical comprehension, in arithmetic, in magnitude processing, and in place-value integration. Moreover, the multiple case design showed that the presented functionally illiterates perform significantly worse than the literate group on most of the measures. Further research should consider using differential diagnostics of literacy, linguistic and numerical abilities.
Zusammenfassung
Funktionale Analphabeten gelten als eine heterogene Gruppe von Personen, deren Lese- und Schreibfähigkeiten trotz Schulbildung für alltägliche Anforderungen nicht ausreichen. Eine empirisch fundierte Differenzierung auf Basis grundlegender Kompetenzen existiert bisher nicht. Um die linguistischen, kognitiven und numerischen Kompetenzen funktionaler Analphabeten zu untersuchen, wurde eine multiple Fallstudie durchgeführt. Dafür wurden funktional analphabetische Personen miteinander, sowie mit einer Stichprobe literalisierter Personen verglichen. Die Ergebnisse zeigen Heterogenität in einem der Alphabetisierungstests (leo.), im lexikalischen Zugriff und in der räumlichen Zahlenrepräsentation. Homogenere Muster wurden bezüglich des anderen Alphabetisierungstest (ELFE 1-6), des nonverbalen IQ, der phonologischen Verarbeitung, des grammatikalischen Hörverständnis, der Arithmetik, der Größenverarbeitung und der Stellenwertsintegration gefunden. Funktionale Analphabeten schnitten auf den meisten Skalen schlechter ab als die literalisierte Gruppe. Zukünftige Forschung sollte die differenzielle Diagnostik von Literalität, sprachlichen und numerischen Kompetenzen berücksichtigen.
This is a preview of subscription content, log in via an institution to check access.
Access this article
Subscribe and save.
- Get 10 units per month
- Download Article/Chapter or eBook
- 1 Unit = 1 Article or 1 Chapter
- Cancel anytime
Price includes VAT (Russian Federation)
Instant access to the full article PDF.
Rent this article via DeepDyve
Institutional subscriptions
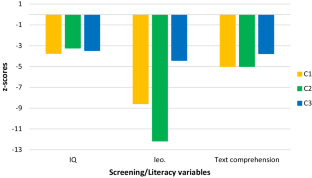
Functional illiteracy and developmental dyslexia: looking for common roots. A systematic review

Language skills differences between adults without formal education and low formal education

Literacy development beyond early schooling: a 4-year follow-up study of Croatian
According to our working definition, when 2 out of 3 comparisons between cases reveal significantly different patterns, heterogeneity of the cases is assumed. However, when no or only 1 comparison reveals significantly different patterns, homogeneity of the cases is assumed (Table 4 ).
Altemeier, L. E., Abbott, R. D., & Berninger, V. W. (2008). Executive functions for reading and writing in typical literacy development and dyslexia. Journal of Clinical and Experimental Neuropsychology , 30 (5), 588–606. https://doi.org/10.1080/13803390701562818 .
Article Google Scholar
BMAS – Bundesministerium für Arbeit und Soziales. (2014). Leichte Sprache – Ein Ratgeber. http://www.bmas.de/DE/Service/Medien/Publikationen/a752-leichte-sprache-ratgeber.html . Accessed: 17. Dec. 2018.
Google Scholar
Boets, B., & De Smedt, B. (2010). Single-digit arithmetic in children with dyslexia. Dyslexia , 16 , 183–191.
Crawford, J. R., & Garthwaite, P. H. (2002). Investigation of the single case in neuropsychology: confidence limits on the abnormality of test scores and test score differences. Neuropsychologia , 40 , 1196–1208.
Crawford, J. R., & Howell, D. C. (1998). Comparing an individual’s test score against norms derived from small samples. The Clinical Neuropsychologist, 12 (4), 482-486.
Crawford, J. R., Garthwaite, P. H., & Wood, L. T. (2011). Inferential methods for comparing two single cases. Cognitive Neuropsychology , 27 (5), 377–400.
Dehaene, S., & Cohen, L. (1995). Towards an anatomical and functional model of number processing. Mathematical Cognition , 1 , 83–120.
Dehaene, S., & Cohen, L. (1997). Cerebral pathways for calculation: double dissociation between rote verbal and quantitative knowledge of arithmetic. Cortex , 33 (2), 219–250.
Döbert, M., & Hubertus, P. (2000). Ihr Kreuz ist die Schrift. Analphabetismus und Alphabetisierung in Deutschland . Münster: Bundesverband Alphabetisierung.
Egloff, B., Grosche, M., Hubertus, P., & Rüsseler, J. (2011). Funktionaler Analphabetismus im Erwachsenenalter: eine Definition. In Projektträger im Deutschen Zentrum für Luft- und Raumfahrt e.V. (ed.), Zielgruppen in Alphabetisierung und Grundbildung Erwachsener: Bestimmung, Verortung, Ansprache (pp. 11–31). Bielefeld: wbv.
Eme, E. (2006). L’examen psycholinguistique et neuropsychologique de personnes en situation d’illettrisme. Revue de Neuropsychologie , 16 , 3–40.
Eme, E. (2011). Cognitive and psycholinguistic skills of adults who are functionally illiterate: current state of research and implications for adult education. Applied Cognitive Psychology , 25 (5), 753–762. https://doi.org/10.1002/acp.1746 .
Eme, E., Lacroix, A., & Almecija, Y. (2010). Oral narrative skills in French adults who are functionally illiterate: linguistic features and discourse organization. Journal of Speech Language and Hearing Research , 53 (5), 1349. https://doi.org/10.1044/1092-4388(2010/08-0092) .
Eme, E., Lambert, E., & Alamargot, D. (2014). Word reading and word spelling in French adult literacy students: the relationship with oral language skills. Journal of Research in Reading , 37 (3), 268–296. https://doi.org/10.1111/j.1467-9817.2011.01508.x .
Greenberg, D., Ehri, L. C., & Perin, D. (1997). Are word-reading processes the same or different in adult literacy students and third-fifth graders matched for reading level? Journal of Educational Psychology , 89 (2), 262–275. https://doi.org/10.1037/0022-0663.89.2.262 .
Greenberg, D., Ehri, L. C., & Perin, D. (2002). Do adult literacy students make the same word-reading and spelling errors as children matched for word-reading age? Scientific Studies of Reading , 6 (3), 221–243.
Grosche, M. (2012). Analphabetismus und Lese-Rechtschreib-Schwächen . Münster: Waxmann.
Grotlüschen, A., & Riekmann, W. (2012). Funktionaler Analphabetismus in Deutschland – Ergebnisse der ersten leo. – Level-One Studie . Münster: Waxmann.
Huber, S., Mann, A., Nuerk, H. C., & Moeller, K. (2014a). Cognitive control in number magnitude processing: evidence from eye-tracking. Psychological Research , 78 (4), 539–548. https://doi.org/10.1007/s00426-013-0504-x .
Huber, S., Moeller, K., & Nuerk, H.-C. (2014b). Dissociating number line estimations from underlying numerical representations. Quarterly Journal of Experimental Psychology , 67 (5), 991–1003. https://doi.org/10.1080/17470218.2013.838974 .
Imbo, I., & Vandierendonck, A. (2007). The development of strategy use in elementary school children: working memory and individual differences. Journal of Experimental Child Psychology , 96 (4), 284–309. https://doi.org/10.1016/j.jecp.2006.09.001 .
Jaeggi, S. M., Buschkuehl, M., Perrig, W. J., & Meier, B. (2010). The concurrent validity of the N‑back task as a working memory measure. Memory , 18 (4), 394–412. https://doi.org/10.1080/09658211003702171 .
Kallai, A. Y., & Tzelgov, J. (2012). The place-value of a digit in multi-digit numbers is processed automatically. Journal of Experimental Psychology: Learning, Memory, and Cognition , 38 (5), 1221–1233.
Kaufmann, L., Mazzocco, M. M., Dowker, A., von Aster, M., Göbel, S. M., Grabner, R. H., & Nuerk, H.-C. (2013). Dyscalculia from a developmental and differential perspective. Frontiers in Psychology , 4 , 1–5. https://doi.org/10.3389/fpsyg.2013.00516 .
Kieffer, M. J., Vukovic, R. K., & Berry, D. (2013). Roles of attention shifting and inhibitory control in fourth-grade reading comprehension. Reading Research Quarterly , 48 (4), 333–348. https://doi.org/10.1002/rrq.54 .
Knops, A., Nuerk, H.-C., Fimm, B., Vohn, R., & Willmes, K. (2006). A special role for numbers in working memory? An fMRI study. Neuroimage , 29 , 1–14.
Kreuzpointner, L., Lukesch, H., & Horn, W. (2013). LPS-2 Leistungsprüfsystem 2 . Göttingen: Hogrefe.
Landerl, K., Fussenegger, B., Moll, K., & Willburger, E. (2009). Dyslexia and dyscalculia: two learning disorders with different cognitive profiles. J. Exp. Child Psychol , 103 , 309–324.
Lenhard, W., & Schneider, W. (2006). ELFE 1-6: ein Leseverständnistest für Erst- bis Sechstklässler . Göttingen: Hogrefe.
Mann, A., Moeller, K., Pixner, S., Kaufmann, L., & Nuerk, H.-C. (2011). Attentional strategies in place-value integration. Zeitschrift Für Psychologie , 219 (1), 42–49. https://doi.org/10.1027/2151-2604/a000045 .
Moll, K., & Landerl, K. (2010). SLRT-II: Lese- und Rechtschreibtest; Weiterentwicklung des Salzburger Lese- und Rechtschreibtests (SLRT) . Bern: Huber.
Morais, J., Cary, L., Alegria, J., & Bettelson, P. (1979). Does awareness of speech as a sequence of phonemes arise spontaneously? Cognition , 19 , 323–331.
Nuerk, H.-C., Kaufmann, L., Zoppoth, S., & Willmes, K. (2004). On the development of the mental number line: more, less, or never holistic with increasing age? Developmental Psychology , 40 (6), 1199–1211. https://doi.org/10.1037/0012-1649.40.6.1199 .
Nuerk, H.-C., Klein, E., & Willmes, K. (2012). Zahlenverarbeitung und Rechnen. In F. Schneider & G. Fink (eds.), Funktionelle MRT in Psychiatrie und Neurologie (2nd edn., pp. 443–455). Heidelberg: Springer.
Nuerk, H. C., Weger, U., & Willmes, K. (2001). Decade breaks in the mental number line? Putting the tens and units back in different bins. Cognition . https://doi.org/10.1016/S0010-0277(01)00142-1 .
OECD (2013). OECD Skills Outlook 2013—first results from the survey of adult skills . Paris: OECD. https://doi.org/10.1787/9789264204256-en .
Book Google Scholar
Owen, A. M., McMillan, K. M., Laird, A. R., & Bullmore, E. (2005). N‑back working memory paradigm: a meta-analysis of normative functional neuroimaging studies. Human Brain Mapping , 25 (1), 46–59. https://doi.org/10.1002/hbm.20131 .
Peirce, J. W. (2007). PsychoPy—psychophysics software in python. Journal of Neuroscience Methods , 162 (1), 8–13.
Petermann, F., & Daseking, M. (2012). Zürcher Lesetest-II (ZLT-II) . Bern: Huber.
Potocki, A., Sanchez, M., Ecalle, J., & Magnan, A. (2017). Linguistic and cognitive profiles of 8‑ to 15-year-old children with specific reading comprehension difficulties: the role of executive functions. Journal of Learning Disabilities , 50 (2), 128–142. https://doi.org/10.1177/0022219415613080 .
Rüsseler, J., Boltzmann, M., Menkhaus, K., & Aulbert-Siepelmeyer, A. (2013). Evaluation eines neuen Trainingsprogramms zur Verbesserung der Lese- und Rechtschreibfähigkeiten funktionaler Analphabeten. Empirische Sonderpädagogik , 3 , 237–249.
Rüsseler, J., Gerth, I., & Boltzmann, M. (2011). Basale Wahrnehmungsfähigkeiten von erwachsenen funktionalen Analphabeten und Analphabetinnen. In Projektträger im Deutschen Zentrum für Luft- und Raumfahrt e. V. (ed.), Lernprozesse in Alphabetisierung und Grundbildung Erwachsener. Diagnostik, Vermittlung, Professionalisierung (pp. 11–28). Bielefeld: wbv.
Schneider, F., & Fink, G. (2012). Funktionelle MRT in Psychiatrie und Neurologie (2nd edition). Heidelberg: Springer.
Siegler, R. S., & Opfer, J. E. (2003). The development of numerical estimation: evidence for multiple representations of numerical quantity. Psychological Science , 14 (3), 237–243. https://doi.org/10.1111/1467-9280.02438 .
De Smedt, B., & Boets, B. (2010). Phonological processing and arithmetic fact retrieval: evidence from developmental dyslexia. Neuropsychologia , 48 (14), 3973–3981. https://doi.org/10.1016/j.neuropsychologia.2010.10.018 .
Steinert, J. (2011). Allgemeiner Deutscher Sprachtest: ADST . Göttingen: Hogrefe.
Thompkins, A. C., & Binder, K. S. (2003). A comparison of the factors affecting reading performance of functional illiterate adults and children matched by reading level. Reading Research Quarterly , 38 , 236–258.
UNESCO (1978). Records of the General Conference. 20th session (Vol. 1). Paris: UNESCO.
Vágvölgyi, R., Coldea, A., Dresler, T., Schrader, J., & Nuerk, H.-C. (2016). A review about functional illiteracy: definition, cognitive, linguistic, and numerical aspects. Frontiers in Psychology , 7 , 17–29. https://doi.org/10.3389/fpsyg.2016.01617 .
WHO (2010). International classification of diseases and related health problems. ICD-10 (10th edition).
Willmes, K. (2000). Statistische und psychometrische Aspekte der Neuropsychologie. In W. Sturm, M. Herrmann, & C.-W. Wallesch (eds.), Lehrbuch der Klinischen Neuropsychologie (pp. 229–249). Lisse: Swets & Zeitlinger.
Wilson, A. J., Andrewes, S. G., Struthers, H., Rowe, V. M., Bogdanovic, R., & Waldie, K. E. (2015). Dyscalculia and dyslexia in adults: cognitive bases of comorbidity. Learning and Individual Differences , 37 , 118–132. https://doi.org/10.1016/j.lindif.2014.11.017 .
Wolf, M., & Bowers, P. G. (1999). The double-deficit hypothesis for the developmental dyslexia. Journal of Educational Psychology , 91 (3), 415–438.
Wood, G., Nuerk, H.-C., Freitas, P., Freitas, G., & Willmes, K. (2006). What do semi-illiterate adults know about 2‑digit Arabic numbers? Cortex , 42 (1), 48–56. https://doi.org/10.1016/S0010-9452(08)70321-6 .
Zimmermann, P., & Fimm, B. (2012). Testbatterie zur Aufmerksamkeitsprüfung – Version 2.3 . Herzogenrath: Psychologische Testsysteme.
Download references
Acknowledgements
We would like to thank Bruno Fimm for providing us with the Go/NoGo task of the TAP 2.3 and Urszula Mihulowicz for her help with analyzing the data. Finally, we thank Julianne Skinner and Zoë-Lauren Kirste for the proofreading of the manuscript.
This research (“Basic Foundations of Functional Illiteracy”) is funded by the LEAD Graduate School & Research Network [GSC1028], a project of the Excellence Initiative of the German federal and state governments and by the German Institute for Adult Education—Leibniz Centre for Lifelong Learning e. V.
Author information
Authors and affiliations.
LEAD Graduate School & Research Network, University of Tuebingen, Gartenstraße 29, 72074, Tuebingen, Germany
Réka Vágvölgyi, Thomas Dresler, Josef Schrader & Hans-Christoph Nuerk
Institut de Psychologie, Université Paris Descartes, 71 Avenue Edouard Vaillant, 92774, Boulogne-Billancourt Cedex, France
Luise Marie Rohland
German Institute for Adult Education – Leibniz Centre for Lifelong Learning (Deutsches Institut für Erwachsenenbildung – Leibniz-Zentrum für Lebenslanges Lernen e. V.), Heinemannstraße 12–14, 53175, Bonn, Germany
Moritz Sahlender & Josef Schrader
Department of Psychiatry and Psychotherapy, University Hospital Tuebingen, Calwerstraße 14, 72076, Tuebingen, Germany
Thomas Dresler
Department of Education, University of Tuebingen, Muenzgasse 11, 72070, Tuebingen, Germany
Josef Schrader
Department of Psychology, University of Tuebingen, Schleichstraße 4, 72076, Tuebingen, Germany
Hans-Christoph Nuerk
Leibniz-Institut für Wissensmedien, Schleichstraße 6, 72076, Tuebingen, Germany
You can also search for this author in PubMed Google Scholar
Corresponding author
Correspondence to Réka Vágvölgyi .
Additional information
R. Vágvölgyi was a doctoral candidate of the LEAD Graduate School & Research Network. Her present affiliation: Cognitive and Developmental Psychology, University of Kaiserslautern, 67663 Kaiserslautern, Germany.
Rights and permissions
Reprints and permissions
About this article
Vágvölgyi, R., Rohland, L.M., Sahlender, M. et al. Diversity of functional illiterate cases: Results from a multiple-single case study. Z Erziehungswiss 22 , 123–151 (2019). https://doi.org/10.1007/s11618-018-00863-z
Download citation
Published : 30 January 2019
Issue Date : 05 February 2019
DOI : https://doi.org/10.1007/s11618-018-00863-z
Share this article
Anyone you share the following link with will be able to read this content:
Sorry, a shareable link is not currently available for this article.
Provided by the Springer Nature SharedIt content-sharing initiative
- Adult education
- Functional illiteracy
- Linguistic skills
- Mathematical skills
- Single case methodology
Schlüsselwörter
- Einzelfallstudie
- Erwachsenenbildung
- Funktionaler Analphabetismus
- Linguistische Kompetenzen
- Mathematische Kompetenzen
- Find a journal
- Publish with us
- Track your research

Home > Journal Publishing > Active Journals > yaljod > Vol. 3 (2021)
Women Socioeconomic Status: The Reprercussion of Illiteracy, Case Study: Charlotte, Sierra Leone
Anthonette Quayee , Concerns for Nature
Publication Date
Illiteracy has affected women in Sierra Leone, by limiting their abilities to participate in governmental, domestic, and economic activities. As a result of the limited opportunities, women are faced with various challenges that impact their social livelihood. For example, women are deprived from making decisions in their homes because of low educational status. Sierra Leone has an adult literacy rate of 43.21%. The male literacy rate is 51.65% and the female literacy rate is 34.85%, creating a huge gap between both sexes (UNESCO, 2018). The impacts of illiteracy also affect youngsters, as early marriage takes the trend, and literacy programs become abandoned. This study examines the repercussions of illiteracy in the hamlet of Charlotte within Freetown, the capital of Sierra Leone. This study highlights the magnitude of the problem, the consequences of the problem, and make recommendations base on suggestions from the participants on how this problem can be resolved.
10.32727/24.2021.28
Since February 16, 2021
Included in
African Studies Commons , Critical and Cultural Studies Commons , Growth and Development Commons , Peace and Conflict Studies Commons , Political Theory Commons
- Journal Home
- About This Journal
- Aims & Scope
- Editorial Board
- Most Popular Papers
- Receive Email Notices or RSS
Advanced Search
Home | About | FAQ | My Account | Accessibility Statement
Privacy Copyright

An official website of the United States government
The .gov means it’s official. Federal government websites often end in .gov or .mil. Before sharing sensitive information, make sure you’re on a federal government site.
The site is secure. The https:// ensures that you are connecting to the official website and that any information you provide is encrypted and transmitted securely.
- Publications
- Account settings
Preview improvements coming to the PMC website in October 2024. Learn More or Try it out now .
- Advanced Search
- Journal List
- Pan Afr Med J
Gender equality in India hit by illiteracy, child marriages and violence: a hurdle for sustainable development
Kishor parashramji brahmapurkar.
1 Department of Community Medicine, Government Medical College, Jagdalpur, Bastar, 494001 Chhattisgarh, India
Introduction
Gender equality is fundamental to accelerate sustainable development. It is necessary to conduct gender analyses to identify sex and gender-based differences in health risks. This study aimed to find the gender equality in terms of illiteracy, child marriages and spousal violence among women based on data from National Family Health Survey 2015-16 (NFHS-4).
This was a descriptive analysis of secondary data of ever-married women onto reproductive age from 15 states and 3 UTs in India of the first phase of NFHS-4. Gender gap related to literacy and child marriage among urban and rural area was compared.
In rural area all states except Meghalaya and Sikkim had the significantly higher percentage of women's illiteracy as compared to male. Bihar and Madhya Pradesh had higher illiterate women, 53.7% and 48.6% as compared to male, 24.7% and 21.5% respectively (P < 0.000). Child marriages were found to be significantly higher in rural areas as compared to urban areas in four most populated states.
There is a gender gap between illiteracy with women more affected in rural areas with higher prevalence of child marriages and poor utilization of maternal health services. Also, violence against women is showing an upward trend with declining sex-ratio at birth.
Gender refers to the socially constructed characteristics of women and men-such as the norms, roles and relationships that exist between them [ 1 ]. Gender inequality limits access to quality health services and contributes to avoidable morbidity and mortality rates in women, also gender inequality is unacceptable [ 1 , 2 ]. The Convention on the Elimination of All Forms of Discrimination against Women requires that women are accorded rights equal to those of men (equality) and that women be able to enjoy all their rights in practice [ 3 ]. Realizing the significance of the issue, the policy makers have included the issue of gender equality as one among seventeen Sustainable Development Goals (Goal-5) [ 3 ]. Encouraging gender equality is fundamental to accelerating sustainable development [ 3 ]. Some of the elements of gender equality are to abolish all forms of violence against all women and girls along with all destructive practices, such as child marriage and guarantee worldwide access to reproductive health and reproductive rights [ 3 ]. Social determinants of health such as education and gender equality are significantly responsible for health-seeking behavior and overall health outcomes. It has been known that improved education, partly reproduced by higher literacy rates is associated with higher incomes and better health indicators such as lower infant mortality rates (IMRs) and lesser population growth rate. Education of families, particularly of women has a 'multiplier effect' on development [ 4 ]. Child marriage and adolescent pregnancy, gender-based violence are among the many barriers that stand in the way of woman's' fully exercising their right to education [ 4 ]. No education limits hopes, declines family income, diminishes health, puts women at risk of trafficked and exploitation and bounds the economic advancement of entire countries [ 5 ]. Education for girls and women is the single most successful way to progress the lives of individual families as well as to bring economic expansion to poor communities worldwide [ 5 ]. Globally 31 million girls are out of school and two-thirds of illiterate adults are women [ 6 ]. Poverty, adolescent pregnancy, child marriage and prejudiced gender norms are some of the reasons that prevent girls from going to school [ 6 ]. Globally 39000 child marriages (marriage before the age of 18) occur daily and it is more common to young girls [ 7 ]. Child marriages not only contribute to illiteracy but also have complications related to pregnancy and childbirth. These complications are the leading cause of death in young women aged 15-19 [ 7 ]. Child marriages also make girls more susceptible to intimate partner violence(IPV) [ 7 ]. Marrying girls less than 18 years old has been embedded in gender discrimination, cheering premature and uninterrupted child-bearing and giving the predilection for boys' education [ 8 ]. Current worldwide prevalence figures indicate that about 1 in 3 (35%) of women worldwide have experienced intimate partner violence (IPV) [ 9 ]. Gender inequality and poor education are some of the reasons for IPV [ 9 ]. IPV can lead to unplanned pregnancies, induced abortions, gynecological problems and sexually transmitted infections [ 9 ]. It is necessary to disaggregate data and conduct gender analyses to identify sex and gender-based differences in health risks [ 1 ]. The overall aim of the study was to find the gender equality in terms of illiteracy, child marriages and spousal violence among women based on data from National Family Health Survey 2015-16 (NFHS-4).
Study design : The present study was a cross-sectional secondary data analysis of information that has been available from the first phase of National Family Health Survey 2015-16 (NFHS-4) [ 10 ]. NFHS-4, has given information on population, health and nutrition each State/Union Territory.
Setting : Primary data onto NFHS-4 had been collected from January 2015 to December 2015. The Ministry of Health and Family Welfare, Government of India assigned International Institute for Population Sciences, Mumbai as the nodal organization to conduct NFHS-4. In the first phase of NFHS-4, 15 states and 3 union Territories were covered (56% of total population). Fifteen States/Union Territories had been selected for study purpose was those, which were covered in first phase of NFHS-4; Maharashtra (MH), Bihar (BR), West Bengal (WB), Madhya Pradesh (MP), Tamil Nadu (TN), Karnataka (KA), Andhra Pradesh (AP), Telangana (TS), Assam (AS), Haryana (HR), Uttarakhand (UK), Tripura (TR), Meghalaya (ML), Manipur (MN) and Sikkim (SK). UTs were Goa (GA), Puducherry (PY) and Andaman and Nicobar (AN) [ 11 ].
Sample size : First phased of NFHS-4 had collected information about 2,91,431 households, 3,37,658 women and 48,342 men.
Variables : NFHS-4 had provided updates and evidence of developments in key population, health and nutrition indicators out of which literacy, child marriage; adolescent reproductive health, maternal health, domestic violence and sex-ratio had been included for the study purpose.
Data analysis : First the data for the above-mentioned variables of all States/UTs has been entered in Microsoft Office Excel worksheet and the gender gap for illiteracy was calculated using Chi-square test for urban and rural area. Then the prevalence of child marriages among girls was compared for area of residence (Urban versus Rural) and Chi-square value was calculated using Epi Info. For statistical tests, P < 0.05 was taken as the significant level. Data were then presented using tables, bar and line diagrams.
Ethical considerations : The study had utilized freely-available record available on the website of the following organization: the National Family Health Survey (NFHS)-4 [ 10 ], National Crime Record Bureau (NCRB) [ 12 ] and Census 2011 [ 13 ]. Because publicly-available database was used in this analysis, no ethical approval was sought.
Definitions : Literate: a person that can read and write with understanding in any language [ 13 ]. Child marriage: according to the prohibition of child Marriage Act, 2006 a child is a male who has not completed twenty-one years of age and a female who has not completed eighteen years of age. Child marriage is a contract between any two people of which either one or both party are a child [ 14 ]. Full antenatal care was defined as at least four antenatal visits, at least one tetanus toxoid (TT) injection and iron-folic acid tablets or syrup took for 100 or more days [ 10 ] . Intimate partner violence refers to behavior by an intimate partner or ex-partner that causes physical, sexual or psychological harm, including physical aggression, sexual coercion, psychological abuse and controlling behaviors [ 9 ].
Total population covered by phase I of NFHS-4 was 678.2 million over 15 states and 3 Union Territories (UTs).
Women's illiteracy (%) as compared to men's illiteracy (%) in urban and rural areas : Women's illiteracy in an urban area has been found to be significantly higher in 8 states and 2 UTs as compared to men's illiteracy and in the rural area; it was significantly higher in 13 states and 1 UT respectively ( Table 1 ). In an urban area, Bihar had a higher percentage of illiterate women (29.5%) as compared to men (11.2%), (P < 0.001), followed by Andhra Pradesh and Madhya Pradesh (MP). In the rural area, all states except Meghalaya and Sikkim had a significantly higher percentage of women's illiteracy as compared to male. Bihar and MP had higher illiterate women, 53.7% and 48.6% as compared to male, 24.7% and 21.5% respectively. (P < 0.000). Bihar and MP state with the population of total 176.7 million had higher women illiteracy in both urban and rural areas. This indicates gender inequality in education.
Distribution of states of India according to the gender gap in illiteracy among urban area as compared to rural area
| Sr. No. | State | Population in million | Women's illiteracy (%) | Men's illiteracy (%) | χ2 | value | Women's illiteracy (%) | Men's illiteracy (%) | χ2 | value |
|---|---|---|---|---|---|---|---|---|---|---|
| Urban | Urban | Rural | Rural | |||||||
| 1 | Maharashtra | 112.4 | 14.1 | 5.6 | 3.167 | 0.037 | 25.2 | 8.8 | 8.404 | 0.002 |
| 2 | Bihar | 104.1 | 29.4 | 11.2 | 9.143 | 0.001 | 53.7 | 24.7 | 16.45 | 0 |
| 3 | West Bengal | 91.3 | 20.6 | 16.1 | 0.409 | 0.261 | 33.1 | 20.3 | 3.557 | 0.03 |
| 4 | Madhya Pradesh | 72.6 | 22.5 | 11.3 | 3.704 | 0.027 | 48.6 | 21.5 | 14.96 | 0 |
| 5 | Tamil Nadu | 72.1 | 14.4 | 8.3 | 1.293 | 0.128 | 27.1 | 13.8 | 4.65 | 0.016 |
| 6 | Karnataka | 61.1 | 18.2 | 10 | 2.14 | 0.072 | 36.2 | 18.8 | 6.745 | 0.005 |
| 7 | Andhra Pradesh | 49.6 | 25.1 | 9.8 | 7.098 | 0.004 | 42.6 | 26.4 | 5.112 | 0.012 |
| 8 | Telangana | 35.1 | 20.7 | 9.2 | 4.335 | 0.019 | 47.6 | 23.5 | 11.64 | 0 |
| 9 | Assam | 31.2 | 13 | 6.8 | 1.516 | 0.109 | 30.8 | 19.3 | 2.936 | 0.043 |
| 10 | Haryana | 25.4 | 19.7 | 7 | 5.917 | 0.007 | 27.9 | 11.1 | 7.952 | 0.002 |
| 11 | Uttarakhand | 10.1 | 18.3 | 7.6 | 4.173 | 0.021 | 26.4 | 10.4 | 7.493 | 0.003 |
| 12 | Tripura | 3.7 | 11.6 | 4.8 | 2.234 | 0.068 | 23 | 13 | 2.744 | 0.049 |
| 13 | Meghalaya | 3 | 6.6 | 4.3 | 0.164 | 0.343 | 20.4 | 19.2 | 0.001 | 0.486 |
| 14 | Manipur | 2.9 | 10.1 | 2.6 | 3.552 | 0.03 | 18.3 | 4.8 | 7.647 | 0.003 |
| 15 | Goa | 1.5 | 12 | 6.5 | 1.206 | 0.137 | 9.2 | 3.4 | 1.952 | 0.081 |
| 16 | Puducherry | 1.2 | 14.9 | 10.2 | 0.554 | 0.228 | 15.2 | 3.9 | 6.141 | 0.007 |
| 17 | Sikkim | 0.6 | 10.5 | 6.7 | 0.499 | 0.24 | 14.8 | 10 | 0.665 | 0.208 |
| 18 | Andaman and Nicobar | 0.4 | 11 | 3.9 | 2.698 | 0.05 | 19.8 | 16.7 | 0.148 | 0.35 |
Child marriages to women (%) in urban and rural areas : Child marriages to women were found to be significantly higher in rural areas as compared to urban areas in 4 most populated states (Maharashtra, Bihar, West Bengal and MP). West Bengal had a higher percentage of child marriages in both urban and rural area, 27.7% and 46.3% and the difference between urban and rural area was significant (P < 0.005) followed by Bihar, 26.9% and 40.9% of child marriages among urban and rural women respectively. (P < 0.026), though no statistically significant difference was observed in Andhra Pradesh, Assam and Tripura, the prevalence of child marriage among women was more than 20% in urban and more than 33% in rural areas of concerned states. The above findings point of the harmful practice of child marriages to women prevalent in most of the states and UTs of India. Goa was the only exception with child marriages significantly higher in an urban area as compared to a rural area as shown in Table 2 .
Child marriages of girls in rural and urban areas of some states and UTs of India
| Sr. No. | State | Child marriages in women (%) | χ2 | value | |
|---|---|---|---|---|---|
| Urban | Rural | ||||
| 1 | Maharashtra | 18.8 | 31.5 | 3.636 | 0.028 |
| 2 | Bihar | 26.9 | 40.9 | 3.771 | 0.026 |
| 3 | West Bengal | 27.7 | 46.3 | 6.644 | 0.005 |
| 4 | Madhya Pradesh | 16.6 | 35.8 | 8.566 | 0.002 |
| 5 | Tamil Nadu | 13 | 18.3 | 0.7 | 0.201 |
| 6 | Karnataka | 17.9 | 27 | 1.884 | 0.085 |
| 7 | Andhra Pradesh | 26.3 | 35.5 | 1.575 | 0.105 |
| 8 | Telangana | 15.7 | 35 | 8.848 | 0.001 |
| 9 | Assam | 23.9 | 33.9 | 1.971 | 0.08 |
| 10 | Haryana | 19.6 | 17.8 | 0.021 | 0.442 |
| 11 | Uttarakhand | 12.2 | 14.8 | 0.11 | 0.37 |
| 12 | Tripura | 25.6 | 34.8 | 1.595 | 0.104 |
| 13 | Meghalaya | 7.8 | 19.3 | 4.706 | 0.015 |
| 14 | Manipur | 11 | 14.3 | 0.239 | 0.312 |
| 15 | Goa | 14.8 | 2.7 | 7.716 | 0.003 |
| 16 | Puducherry | 10.9 | 10.2 | 0.005 | 0.473 |
| 17 | Sikkim | 16.1 | 13.6 | 0.089 | 0.382 |
| 18 | Andaman and Nicobar | 11.9 | 20.4 | 2.077 | 0.075 |
Reproductive health : Full Antenatal care (ANC) was lower in a rural area of states, Bihar (03%), followed by Tripura (6.8%) and MP (8.3%) as compared to the rural area of Tamil Nadu (43.8%). Also, full ANC coverage was found to be lower in an urban area of Bihar (6.6%), Tripura (9.8%), Uttarakhand (15.6%) and MP (19.5%) as compared to Telangana and Tamil Nadu with full ANC coverage of 47.7% and 46.3% respectively. Postnatal care (PNC) to mothers within 2 days of delivery was found lower in rural area of states with Bihar state in which only 41.1% of mothers received PNC from health personnel followed by Meghalaya (42.6%), Uttarakhand (49.1%) and MP (50.3%) as compared to better Post Natal Care in state of Telangana (79.1%) and Andhra Pradesh (77.8%) among states and 90.5% among UT (Goa).
Ever-married women that have ever experienced spousal violence (%) and adolescent pregnancy : The overall percentage of spousal violence among ever-married women was 25.2% in urban area and 31.2% in rural area. Spousal violence was higher in the rural area of Manipur (56.1%) followed by Telangana (47.6%), Tamil Nadu (44.2%) and Bihar (43.7%). Similar observations were noted in an urban area as shown in Figure 1 . Figure 2 shows a number of cases reported under the head of cruelty by husband and rape. There was an upward trend in a number of cases reported to the head of cruelty by husband and rape from the year 2010 to 2014. Percentage of adolescent pregnancy was higher in Tripura and West Bengal in the rural area (20.7% and 20.6%) as compared to an urban area (13.7% and 12.4%) respectively.

Distribution of states and UTs of India according to percentage of ever-married women who have experienced spousal violence

Distribution of number of cases reported as per National Crime Record Bureau (NCRB), India, under head of cruelty by husband and rape from the year 2005 to 2014
Sex ratio at birth for children born in the last five years (females per 1,000 males) : Sex ratio at birth was better in the rural area except for Telangana (865 females/1000 males), Haryana (867 females/1000 males) and Andhra Pradesh (880 females/1000 males). In urban areas, it was lower than 900 females/1000 males in all UTs and 8 states. It was lower in Sikkim (632 females/1000 males), Andaman and Nicobar (708 females/1000 males) and Haryana (785 females/1000 males) as summarized in Figure 3 .

Distribution of states and UTs of India according to sex-ratio at birth in urban and rural areas
In present study female literacy has been significantly lower as compared to male literacy in rural areas of 15 states and 3 UTs except for Meghalaya and Sikkim state and Goa and Andaman and Nicobar UTs. The reason for this may be several parents did not have permitted their female children to go to schools and another reason could be child marriage of girls [ 15 ]. Another reason might be that most people are below the poverty line and weren't conscious that children should get the free education according to the law [ 15 ]. Hence there is a gender gap between educations. The 11 th five-year plan had decided to reduce the gender gap in literacy to 10% points by 2012 [ 16 ]. However in present study gender gap was observed in rural areas of all states except Meghalaya and Sikkim. Also according to censuses held in 2001 and 2011, the percentage of female literacy in the country was 54.16% and 65.46% respectively. An increase in 11.3% during the period 2001-2011, however, this was 3.6% lower than that during the period of 1991-2001. This declining trend over a decade is a matter of concern for sustainable development as it affects women empowerment [ 17 ]. In a country like India, literacy is the core basis of social and economic growth. Though the government has made an act that each child under the age of 14 should get free education, the setback of illiteracy is still at large [ 15 ]. Similarly, Lailulo YA et al had observed gender gap between education in the Ethiopia and also noted that educated women with educational attainment of primary education and above are less likely got married at an early age than those who are uneducated [ 18 ]. Raj Anita et al had studied the prevalence of child marriage using National Family Health Survey-3 data and had found that the maximum frequency of child marriage among women having less than a secondary education and residing in the rural area [ 19 ]. Similar findings were noted in NFHS-4 data phase 1, among top 4 most populated states. West Bengal and Bihar had a higher percentage of child marriage, 46.3 and 40.9% respectively in rural areas. David R et al had also similar observations related to higher prevalence of child marriage to girls with less education and residing in rural areas [ 20 ]. Adolescent pregnancy or 'motherhood in childhood' is one of the gravest health hazards to young women in India. Patra S et al had observed that stillbirth and abortion were more widespread among younger adolescents and the proportion of live births (vs. stillbirth or abortion) was also advanced among women having 10 years or more education [ 21 ]. As per UNFPA, the girl with adolescent pregnancy bears end of her education along with shrinking away from her job prospects and her vulnerability to poverty and exclusion increases [ 22 ]. Impediments from pregnancy and childbirth were the leading cause of death among adolescent girls [ 22 ]. In the present study, it was observed that coverage of full antenatal care (ANC) in states was the lowest in rural Bihar 03% compared to rural Tamil Nadu, 43.8%.Ahmed S et al had observed that women with complete primary education are almost three times more likely to have made at least four ANC visits [ 23 ]. Bihar had 53.7% of women illiteracy in the rural area as compared to Tamil Nadu, 27.1%. Kawaguchi L et al. had noted that women that married young were less likely to utilize ANC [ 24 ]. Bihar had 40.9% of child marriages to the rural area as compared to Tamil Nadu, 18.3%. Birmeta K et al had observed that women with education were more than twice likely to attend ANC as compared with those who had no education [ 25 ]. Ensuring universal accesses to sexual and reproductive health and reproductive rights as agreed in accordance with the Programme of Action of the International Conference on Population and Development and the Beijing Platform for Action and the outcome documents of their review conferences. 'Gender equality means that the different behaviors, aspirations, and needs of women and men are considered, valued and favored equally' [ 26 ]. Gender equality is a matter of human rights. It is also a driver of development progress. Gender equality, rooted in human rights, is increasingly recognized both as an essential development goal on its own and as vital to accelerating sustainable development overall [ 27 ]. Sex ratio is defined as the number of females per 1000 males in the population and is an important social indicator to measure the extent of prevailing equity between males and females [ 28 ]. Though the overall sex ratio of the Country is showing a trend of improvement, the child sex ratio is showing a declining trend, which is a matter of concern. Child sex ratio (0-6 years) at country level was 945 in 1991, 927 in 2001 and has now declined to 914 in Census 2011 [ 27 ]. The sex ratio of birth is an indicator of the discrimination against the girl child and dreadful crimes such as female feticide. As per NFHS-4 child sex ratio was the lowest in urban Sikkim, 632 followed by Andaman and Nicobar and Haryana with child sex-ratio of 708 and 785 respectively. Gender inequality manifests itself in various forms, the most obvious being the tendency towards the continuously declining female ratio of the population of the last few decades [ 29 ]. Further research is needed to study the factors associated with declining female ratio of the population.
Limitations : This study had not covered all states and UTs of India. The datasets were not available for NFHS-4 at present, so detailed analysis was not done.
There is the gender gap between illiteracy with women more affected in rural areas with higher prevalence of child marriages and poor utilization of maternal health services. Also, the violence against women is showing an upward trend with declining sex-ratio at birth.
What is known about this topic
- 11 th five year plan of India had decided to reduce the gender gap between literacy to 10% points by 2012;
- Child sex ratio of India was 919 females/1000 males (as per Census 2011).
What this study adds
- 11 out of 15 States/Union Territories (73%) had gender gap of more than 10% in literacy ranging from 10% to 29% in the rural area as compared to urban areas in 6 States/Union Territories (40%) with the range of 10.7% to 18.2%;
- But as per the analyses of primary data of NFHS-4 which was collected from January 2015 to December 2015, child sex ratio of India is declining with lowest, 632/1000 females in urban area of Sikkim and below 800/1000 females in urban area of 5 states States/Union Territories.
Competing interests
The author declares no competing interests.
Acknowledgments
The author is obliged to the Ministry of Health and Family Welfare, Government of India and International Institute for Population Sciences, Mumbai for the data for research purpose from National Family Health Survey 2015-16 (NFHS-4).
Authors’ contributions
The author had participated sufficiently in the intellectual content, conception and design of this work and the analysis and interpretation of the data, as well as the writing of the manuscript. All the authors have read and agreed to the final manuscript.
Converting Lawns Into Diverse Landscapes: Case Studies

A resident of Harford County replaced portions of the lawn with native plants to increase native habitat and beauty in the landscape.
Growing and maintaining turf in Maryland is challenging and resource-intensive. Replacing grass areas with locally adapted native plants and landscaping is an effective way to make your property beautiful and better for the environment.
Take a look at the examples below of Maryland residents who reduced their lawns, solved water runoff problems, increased enjoyment of their property, and reduced the negative impact of lawn maintenance on climate change .
Converting lawn strip into a pollinator garden
Lawn before it was removed
Early spring this year - one year after the garden was planted
Summer view of garden showing native bee balm in bloom. The bees loved it. Also showing the certification signs for the garden.
Garden in September with asters about to bloom. Phlox and goldenrod in bloom.
View of the garden from the other direction with goldenrod in bloom to provide nectar for migrating butterflies as well as other pollinators.
Landscape design sketch
The main plants used in this garden:
- Asclepias tuberosa (butterfly weed)
- Asclepias syriaca (common milkweed)
- Aster 'October Skies'
- Solidago 'Fireworks' (goldenrod)
- Nepeta 'Walker's low' (catmint)
- Allium Millennium
- Monarda 'Bradburiana' (bee balm)'
- Caryopteris 'Golden Sunshine'
- Echinacea (purple coneflowers)
- Sisyrinchium angustifolium (Blue eyed grass)
- Oenthera (evening primrose) for ground cover
- Phlox subulata
Lessons learned:
"We did the entire garden ourselves. I bought plugs of many of the plants to reduce the cost. I planted in drifts so the pollinators would have easy access to them. The bees love the catmint and allium millennium although neither are native. The garden has required little maintenance. However, it has been a struggle to resist the temptation to deadhead taller plants like the coneflowers and milkweed to make the garden look better. I have to tell myself the goldfinches love the coneflower seeds and the monarch caterpillars are still on the milkweed. You have to view the garden from the insects’ point of view rather than the humans’ point of view."
- Diane Mitchell, Harford County
Townhouse property converted to native and edible plantings
Front yard before
Backyard before
Front yard after
Backyard after
"Once only turf, mulch, and non-native plants, I converted my small townhouse front and back yards to native and edible plantings over three years. The garden is a Certified Wildlife Habitat and was featured as a stop on the first annual Green Team Urbana garden tour (a group I co-founded to help restore the land in our heavily developed area). I'm an enthusiastic amateur gardener and currently a Certified Master Naturalist intern in Frederick County."
Plant list:
"Black- and brown-eyed Susans, tall phlox, rattlesnake master, bee balm, blanket flower, goldenrod, aster, coral honeysuckle, American wisteria, purple coneflower, anise hyssop, sunflowers, mountain mint, false sunflower. Various herbs, vegetables, and berries. I used marigolds, catmint, and alliums as low-profile "edging" around taller native plants and transplanted violets into my garden beds as ground cover."
"This was a DIY project. I started by marking out garden beds and layering them with cardboard and compost, then cutting holes in the cardboard and planting plugs. I found gardens or pieces of gardens I liked on Pinterest and then recreated them with native plants. (I'm a particular fan of English cottage gardens, and the look is easy to recreate with the lush, organic, slightly messy look of native plants.) I tried and failed a lot, but I dug in and got my hands dirty and wasn't afraid to fail. Some plants will surprise you; let them. Don't be afraid to start. You can always dig up or move plants later on."
-Bethany Adams, Frederick County
Increasing plant diversity along the sidewalk
Beginning of project: using a pickaxe, shovel and rake, I physically removed zoysia grass, being sure to remove all roots, but retaining soil.
Using a flexible hose to define the curving shape of the new garden, I finalized the design and edged the border with the remaining lawn. Remember to call Miss Utility about underground utilities!
Using leftover bricks from previous projects, I installed brick edging along the sidewalk. This will help retain water, soil, and mulch until the new garden is well established.
After enriching the new plot with compost, it was time for transplanting. I moved creeping phlox ( Phlox stolonoifera ), Siberian iris ( Iris sibirica ), a rose bush, black-eyed susan ( Rudbeckia hirta ), and a large mangave ( Mangave Macho Mocha).
The final steps included installing new plants (mostly native) and shrubs, and mulching. The new plants included asters ( Aster laevis ‘Bluebird’), dogwood ( Cornus stolonoifera Farrow), yarrow ( Achillea Summer Sangria), and beardtongue ( Penstemon Husker red). Mulching and watering sufficiently to get plants established are the final steps.
"In 2021, I decided to reduce the lawn area and increase plant diversity in our front yard bordering the sidewalk, mirroring the shape of the garden on the south side of the walkway. Considerations included reducing runoff from hard surfaces, introducing more native plants and shrubs, and diversity of color, foliage, and blooming season of transplanted and newly-purchased plants."
Lessons Learned:
"This was a DIY project, and it was labor-intensive. Removing all grass and roots was strenuous work. Half of the plants installed were transplants from other locations on the property. Purchased plants and mulch cost approximately $225."
-Larry Clements, Prince George's County
Rain garden solved a runoff problem
August 2015 Rain Garden “Before”
September 2015 Rain Garden
October 2015 (downspout through berm and the rain garden planted)
May 2021 “After” (Spring bloom in the rain garden)
July 2021 “After” (Summer bloom in the rain garden)
Debbie Sheppard from Prince George's County comments:
We were looking to solve the problem of rainwater runoff coming from the direction of our neighbor's yard. The water would sit against our home's foundation and puddle for days making it impossible to walk around two sides of the house. We decided to install a deep rain garden to catch the runoff. With a simple phone call to the Prince George’s County Rain Check Rebate , they quickly had someone come visit our property and go over any questions about the program. By doing all of the digging (my husband with a small backhoe and me with a shovel and wheelbarrow) and completing the install, we were able to accomplish the project at a low cost. It was a great "excuse" to make a fun design and shop for the appropriate plants! We now enjoy the ability to walk around our yard after a rain. We have a swing right next to the rain garden where we drink our coffee. It is a delight to take in the beauty of the flowers, plants, birds, and pollinators!
Plants that worked best over the years:
Golden ragwort (Packera aurea) - fantastic, quick, and dense ground cover in center of rain garden
Cardinal flower (Lobelia cardinalis) - tremendous self sower, really throws up plants everywhere
Creeping phlox ( Phlox stolonifera) - absolutely beautiful on the berm
Bowma’s root (Gillenia trifoliata) - Always looks tidy, no pest or disease problems
Ninebark ( Physocarpus opulifolius) - beautiful and healthy
Purple coneflower (Echinacea purpurea) - flowers
Blazing star (Liatris spicata ‘Kobold’) - beautiful texture and bloom
White Wood Aster ( Eurybia divaricata) - dry shade
Tips for others who want to do a similar project?
Be ready to weed for a few years to allow for plants to grow in. Stay on top of weeding, otherwise you will have a field and not a planned garden. Did I mention that you will need to love weeding?! Wow - what a learning opportunity! So fulfilling!
Turning lawn into a meadow
Backyard original: I dug out dozens of cinder blocks and pavers, put in trenches with hugelkultur backfill. The area to the left is an old garage pad of concrete with 6-8” of soil on top… hopefully will remove this over the winter. I have many photos of the before, during, and after. When we moved in there was almost entirely grass. Now we have native plants everywhere!
I installed sections from a mature cherry tree to add some terracing to slow down runoff. I’ve planted with 90% native plants and a few high value non-natives. I have a toddler and dog so the yard has to be “play friendly.”
Front yard has Honeyvine milkweed, blueberries, little bluestem, joe pye, my iron weed, helianthus Maximilian, giant yellow hyssop, winterberry, echinacea, and other natives. I’ve been cultivating violets, native plantain, and other walkable green mulches to use as edging around the fence. I’ve documented the “hell strip” next to the side wall and noted what grows well and what requires lots of maintenance. Next spring I plan to start removing all the plants and replacing them with native carex, lyreleaf sage, and native plantain.
Front yard has a child’s playhouse and several enormous cherry logs that act as a stage. This side has aromatic asters, Solidago altissima, and other native plants. I’ve trained a native clematis to grow up the side and over the roof of the little house to provide summer shade. On the back corner (behind the non native magnolia), is an enormous pokeweed I’ve pruned to grow along with native plants and tithonia… they’re over 6’ now.
Still working on eliminating non-native, invasive honeysuckle, mulberry, and others, but this area has a log “fence” over a swale and then is planted with yarrow, liatris, and blue lobelia. The logs are gorgeous in cooler weather when the moss and fungi come out. We’ve seen two new species of woodpecker, had Orioles fledge two chicks, and a resident group of bluebirds visit the enormous American holly in the back.
"I have over 100 native plants including 7 varieties of asters, 4 goldenrod, and 2 perennial sunflowers. My plantings are based on Dr. Tallamy’s research into keystone plants plus additional shrubs, understory trees, and perennials that are host plants. I’ve kept detailed lists of all the plants I’ve put in."
- Amy Sawyer, Prince George's County
Calvert County meadow added along driveway area
Beginning of meadow garden with solarization.
We put in an extension to our driveway in order to have the driveway be circular. This created a "lawn" from a previous hayfield. In the Fall of 2020 I started a narrow, curved meadow garden down the middle of the circular driveway with native grasses and forbs. Photo shows a small patch with solarization. This Fall I am filling in either side of that narrow meadow so that it fills up nearly the whole space created with a circular driveway.
First season with planted meadow
This is the view of the meadow in the Fall of 2021. I used Little Bluestem ( Schizachyrium scoparium "MinnBlueA" and Hairawn muhly (Muhlenbergia capillaris) for the grasses as they don't get very tall (2'-3').
Meadow island
This photo shows a border (planted 2018) created to reduce lawn. I initially used Canadian Wild Rye and Big Bluestem (Andropogan gerardii) and various forbs. The Canadian Wild Rye started to take over the forbs and I removed it after two years.
The main plants used in this design:
"I used perennial black-eyed Susans, butterfly weed, native grasses as discussed in photos, goldenrod, bee balm, liatris and many other natives. I used zinnias for continuous color."
"I learned that I really need to cut my tall grasses down early in the season as they get so tall that they fall over and must be staked."
Sidewalk strip grass replacement
Master Gardener Beth Blum Spiker got tired of mowing the strip along the sidewalk.
Lawn replaced between sidewalk and street
A large portion of the lawn was replaced. Now the entire yard can be mowed in 17 minutes!
The new plants look great in bloom.
Landscaping adjacent to the house
The landscaping in front of the house was also expanded.
Master Gardener Beth Spiker got tired of mowing the strip along the sidewalk. She replaced everything she didn’t like when she mowed, and now she can mow the entire yard in 17 minutes!
Lawn replacement along the waterfront
A section of lawn around the stairway was replaced with new plants.
A second view of the newly-planted feature looking towards the water.
As the plants mature, they fill in the space.
Gardens like this with native plants should reduce runoff into our waterways.
“ When we bought our house there were three trees, one rhododendron, three camellias, a dozen or so azaleas, and a similar number of boxwood. After 5 years of owning the house, I converted a portion of it to a nice collection of all types of plants. We had Adkins Arboretum help us with a garden design using native plants, and the non-natives were mostly given to us by friends from their yards.” - Dora Jean Hanna, Master Gardener
Desert area to native plant meadow
The backyard was a desert after the installation of the ground loop system. The ground was hard, dry, full of clay and rocks - just right for native plants!
I bought very few plants. I was able to transplant coneflowers and black-eyed-Susans from other gardens. Friends also gave me many plants. I knew I wanted grasses and movement in the garden so I sowed little bluestem and prairie dropseed grasses in jiffy cups and tended them very carefully. If I had sown seeds directly in the ground, they would have been lost among the emerging weeds.
Because the grass plugs were small, I put chicken wire cages around each one for protection from rabbits, groundhogs, and deer. I found a few plants with teeth marks, but for the most part, the animals left the meadow alone. I had plenty of other food that probably interested them.
Each time I planted a grass or perennial, I mulched the surrounding area. After a native garden is established, watering is not necessary. When starting a meadow, the gardener has to baby the plants. I watered a great deal last summer. There were some very hot, dry days. This year I did not water the meadow at all.
It was unbelievable to me that I was able to establish this mini meadow in one season. It is true that using native plants in hostile territory is the path to take. I did not amend the soil, but I did put a little compost from my compost pile into each planting hole. This meadow is the first thing I look at every morning when I walk onto the back patio. It is my last view every evening. On windy days the grasses dance just as I had hoped they would do.
"After my husband and I put in a ground loop heating and air conditioning system, the backyard was a desert. Because I had read Doug Tallamy's book Nature's Best Hope , I envisioned a small meadow. I consulted friends, researched online, read books, and visited Longwood Gardens in Pennsylvania and Mt. Cuba in Delaware. I knew what I wanted to do."
-Harford County gardener
Bay-Wise landscape
From above, you can see the property is almost surrounded by plants other than turf.
The only turf George kept on his property, other than pathways through his landscapes, is this small maintained "lawn room" close to his home and pool.
A narrow turf pathway winds between native plant landscaping.
The landscape looks great at sunset.
Curved lines in the landscape create interest. They pull you through the garden to see what's around the corner or the curve.
George's property is an official Bay-Wise demonstration landscape.
Maryland Master Gardener George Yurek kept a small “lawn room” close to his home and pool. Around the rest of the property, he created a Bay-Wise landscape by adding a variety of trees, grasses, shrubs, and perennials. Minimal lawn strips are used as walkways throughout the landscape.
Sod to native plant conversion
Before adding garden landscaping the yard contained mostly grass.
Newspaper was laid down in areas to smother the grass.
Mulch is laid over newspaper and new plants are planted.
This is the yard as it is now.
Howard County Master Gardener Molly McElwee laid sod at her new home in 2006. Then she started adding gardens, continuing with an expansion in 2016 using the “lasagna method” to smother grass and prepare the planting areas. “We have a very heavy emphasis on natives, especially host plants and plants beneficial to all sorts of wildlife. We are leaving some grass for pathways through the garden!”
Related information
The Challenge of Growing a Lawn in Maryland
Lawn (Turfgrass) Removal Methods
Lawn Alternatives
Recommended Native Plants for Maryland
Still have a question? Contact us at Ask Extension .
More From Forbes
Why solo apps just don’t work: a kardashian case study.
- Share to Facebook
- Share to Twitter
- Share to Linkedin
LOS ANGELES, CA - OCTOBER 27: (L-R) TV personalities Khloe Kardashian and Kim Kardashian watch the ... [+] season opening game between the Los Angeles Clippers and the Los Angeles Lakers at Staples Center on October 27, 2009 in Los Angeles, California. NOTE TO USER: User expressly acknowledges and agrees that, by downloading and or using this photograph, User is consenting to the terms and conditions of the Getty Images License Agreement. Mandatory Copyright Notice: Copyright 2009 NBAE (Photo by Kevork Djansezian/Getty Images)
In today’s world, if one is lucky enough to amass millions of followers or fans, it’s hard not to think of the millions they can help create in revenue.The potential for monetization has been made clear by social media sites and yet, sometimes, what traditional social media has to offer doesn’t seem like enough. That’s where the Kardashians found themselves just shy of a decade ago. They figured that if they could get their “followers” to follow them to their own app, they could charge the followers and convert their follower count into a dollar count. The Kardashians’ logic was sound, and their path is one that’s tempting to follow, however it ended in failure. How did their seemingly bright idea of solo-apps fade? Why hasn’t this become the model for all social media stars?
Content is Queen
Kim Kardashian West made her App Store debut with a game, “Kim Kardashian: Hollywood,” which may have grossed the star and development partner $200 million in annual revenue . The game was free-to-play but players could purchase in-game currency, “K-stars ,” to buy in-game items, like special wardrobe items and furniture . That seemed to pave the way for individual Kardashian sister apps, and in 2015, the whole family got involved.
Kim Kardashian West, Khloé Kardashian, Kendall Jenner and Kylie Jenner each launched their own subscription apps, all of which shot up into the App Store’s top charts . There was no charge for each of the Kardashian-Jenner apps, but they all offered additional content to subscribers who paid $2.99 per month .
The difference between Kim’s initial launch and the subsequent solo apps was that a game has very clear content and an experience that can’t be found anywhere else. However the sister’s solo apps largely shared content that was being offered for free elsewhere—namely on Instagram. This difference was significant: Kim’s game lasted for nearly a decade , whereas the solo apps died within three years. With the rise of social media, consumers are used to obtaining content for free, making monetization even more difficult. Requiring an audience to move to another platform necessitates that celebrities and creators provide a deeper level of access to exclusive content.
Best High-Yield Savings Accounts Of 2024
Best 5% interest savings accounts of 2024.
Value is Vital
The importance of ample, quality content in the success of a content creator’s standalone app is made quite apparent by one of the few solo apps that’s still standing: Martha Stewart TV . Martha Stewart has created seasons of beloved television shows and, as she said when the app launched, “ Wherever I go, I am always asked where these classic television shows can be found - everyone misses them .” At launch, her app made over 750 episodes available to an audience that had been wanting them; it added value to her fans’ experience. By contrast, the Kardashian-Jenner apps offered content that could be found elsewhere. As Vox put it, rather bitingly, “ Can you think of a time when you didn’t have easy access to healthy living and motherhood tips from Kourtney Kardashian? Or workout tips and product recommendations from Khloé Kardashian? Or Kylie Jenner’s personal music preferences? ”
Safety in Numbers
While the promise of having one’s own app seems desirable for purposes of hoarding all the possible revenue, there are also problems with being the only celeb on an app. Taylor Swift experienced this pitfall. Her short-lived app The Swift Life , which debuted at #1 in the App Store in 2017, fell to 56th place by day three and plummeted to 793rd in its second week, mainly because its content moderation system couldn’t handle all the racist and homophobic users who seem to have embraced the dedicated app as the perfect place to air all their fury . And Swift wasn’t the only one whose app faced this fate. Jeremy Renner’s app came and went in about six months thanks to the community on the app being unbelievably toxic . But this isn’t the only reason it’s beneficial to be on an app with others. Marketing costs can skyrocket when trying to get fans to download a specific program. They already have so many other apps in the palm of their hand—Instagram, TikTok, et al.—it’s often more cost-effective to distribute content on a shared platform, assuming one can capture the fans’ attention there. Platforms like Patreon, OnlyFans, Substack and Fireside exist to help celebrities and creators maintain control by owning and monetizing their content, while simultaneously providing the same ‘safety in numbers.’ Fans also still have the benefit of accessing all of their content in one place without needing to download additional applications.
Back to Basics
While it’s understandable that the Kardashian-Jenners liked the idea of being a big fish in a small pond—so small that they were the only fish, and it seemed sensible that they might be able to convert their followers to subscribers of their solo app, time has shown that there’s been little to lose for sticking with a shared platform. Every single one of the Kardashian-Jenner sisters has more than doubled their Instagram follower count in the past six years and, as of July 2024, Kourtney has 222 million followers, Kim has 362 million followers, Kylie has 398 million followers, Kendal has 292 million followers and Khloe has 308 million followers . Given that Kylie makes $847,544 per sponsored Instagram post and no longer has any of the costs of keeping up a solo app, she clearly demonstrates that there’s plenty of reason to enjoy being an influencer fish in a big social media pond.

- Editorial Standards
- Reprints & Permissions
Join The Conversation
One Community. Many Voices. Create a free account to share your thoughts.
Forbes Community Guidelines
Our community is about connecting people through open and thoughtful conversations. We want our readers to share their views and exchange ideas and facts in a safe space.
In order to do so, please follow the posting rules in our site's Terms of Service. We've summarized some of those key rules below. Simply put, keep it civil.
Your post will be rejected if we notice that it seems to contain:
- False or intentionally out-of-context or misleading information
- Insults, profanity, incoherent, obscene or inflammatory language or threats of any kind
- Attacks on the identity of other commenters or the article's author
- Content that otherwise violates our site's terms.
User accounts will be blocked if we notice or believe that users are engaged in:
- Continuous attempts to re-post comments that have been previously moderated/rejected
- Racist, sexist, homophobic or other discriminatory comments
- Attempts or tactics that put the site security at risk
- Actions that otherwise violate our site's terms.
So, how can you be a power user?
- Stay on topic and share your insights
- Feel free to be clear and thoughtful to get your point across
- ‘Like’ or ‘Dislike’ to show your point of view.
- Protect your community.
- Use the report tool to alert us when someone breaks the rules.
Thanks for reading our community guidelines. Please read the full list of posting rules found in our site's Terms of Service.
Academia.edu no longer supports Internet Explorer.
To browse Academia.edu and the wider internet faster and more securely, please take a few seconds to upgrade your browser .
Enter the email address you signed up with and we'll email you a reset link.
- We're Hiring!
- Help Center

Women Socioeconomic Status: The Repercussion of Illiteracy, Case Study: Charlotte, Sierra Leone

2021, Young African Leaders Journal of Development
Related Papers
Research on humanities and social sciences
Judith Akello
Women’s literacy is critical to addressing gender inequality, though, globally, only 88 adult women are considered literate for every 100 adult men. This article is an analysis of challenges faced by Ugandan women based in the Northern part of the country who attempt to acquire and use skills attained from training in Functional Adult Literacy (FAL) to improve their socio-economic conditions. Qualitative data was collected from 45 participants (literate and non-literate) selected purposively. The study was informed by Freire’s literacy and agency theories which argues on the element of awareness by making marginalised non-literates see the reality of the world by using their agency to recognise their impediment to development. Findings indicate that women FAL graduates faced challenges ranging from lack of acknowledgement, belittlement to negative perceptions. It would be helpful for Government, International development partners, NGO’s and civil society to ensure strong support and...
The ANNALS of the American Academy of Political and Social Science
Nelly Stromquist
Emma Norland
PALOMA APARICIO TORICES
Valeria Rocha
Journal of Educational Research in Developing Areas
Brian Mumba
Introduction: Primary education in Zambia remains the key determiner of literacy. However, there is little research on the relationship between primary education and literacy levels, independent from higher levels of formal education. This association is imperative, as primary education completion is the primary estimator of literacy in many developing countries. Purpose: The paper assessed the relationship between primary education and literacy levels among women of low educational attainment in Zambia. Methods: The study was interested in the women participants who responded to literacy questions during 2018 Zambia Demographic and Health Survey. This paper assessed the relationship between primary education and literacy, using the 2018 Zambia Demographic and Health Survey dataset. Given the study focus, the researcher restricted the analysis to a total sample of 6171 women respondents who had received at most a primary school level of education out of the total samples of 9959 women. Pearson's X^2 test and logistic regression analysis were the techniques for analysis. Findings: There was a significant association between education level and whether or not women were literate X^2 (1) = 544.69, p < .000. Based on the odds ratio for the un-adjusted model, primary education level was indeed associated with literacy with an increase in odds of being literate (31.49 (20.37-48.69) times higher than for women with no formal education). Recommendations: The study recommended further research using mixed methods to confirm various associations that have been observed in the study.
Journal of Conflictology
Kelechi Ani
Shirin Zubair
IJLHSS Journal
Loading Preview
Sorry, preview is currently unavailable. You can download the paper by clicking the button above.
RELATED PAPERS
Handbook of Research on Cross-Cultural Approaches to Language and Literacy Development
Amma Akrofi
Review of European Studies
Mabel Oyitso
Savita Aggarwal
Emelie Efraimsson
Kerathum Juma
Dr.Dupe A Abolade
Toni Olumodimu
Kennedy Mureithi
taiwo abioye
International Journal of Education, Training and Learning
Taeko Takayanagi - Fujisaki
International Journal of Contemporary Pediatrics
Gorav Yadav
African Journal of History and Culture
Adlyn johnson
Journal of Educational and Social Research
brikena dhuli
DR HAMZOKHAN P P P TAGAR
Katsina-Ala Multidisciplinary Journal
Jacob O . Anum
iaeme iaeme
International Journal of Academic Research in Business and Social Sciences
Premier Publishers
Louise Wetheridge
Julia Kotoka
International Research Journal Commerce arts science
George L Openjuru
RELATED TOPICS
- We're Hiring!
- Help Center
- Find new research papers in:
- Health Sciences
- Earth Sciences
- Cognitive Science
- Mathematics
- Computer Science
- Academia ©2024
- Faculty and Staff
- Leading a Study Abroad Program
Marketing and Recruiting

Market the Program
In order to meet your enrollment goals, you will need to actively market your study abroad program. The most effective marketing tool is an engaged faculty leader who is passionate about their course and can get students excited about participating in their study abroad program. After you complete and submit your required forms to the Office of Education Abroad, we will create a digital brochure and application link for your program that you can share with interested students.
While the Office of Education Abroad will market all study abroad offerings through our normal marketing platforms on social media, printed posters, and our monthly newsletter, the responsibility for marketing a course belongs to the faculty leader and department or school. The following are some marketing ideas to help you get started:
- Create a flier or pamphlet or both: Fliers and pamphlets are effective in getting students to notice the course. You will need a big stack of fliers for the annual study abroad fair in September! Make sure you send your flier/pamphlet to the Office of Education Abroad so we put it in our information area. CWRU-branded templates have been provided by UMC.
- Talk the course up in your classes: Promote your course to as many individual students and classes as you can. Ask your fellow faculty members to talk up your course as well.
- Submit to the daily : Write a short article about your program or announce an information session and send it to the Office of Education Abroad to submit to the daily .
- Attend the study abroad fair: Study abroad fairs provide you with the opportunity to learn about other programs and promote your own. Students who go to the fairs are interested in going abroad, so this is a good venue to promote your course.
- Send emails: While it is never good to send out a lot of promotional emails, sending a few doesn't hurt. Ask your department chair or dean if he or she would be willing to send an email about your course to all of the students in your department or school.
Marketing Statement for all print and virtual materials
For information about all study abroad programs offered through and approved by Case Western Reserve University, contact the Office of Education Abroad at [email protected] or visit the Office of Education Abroad website .
Review the Application Requirements
All CWRU students intending to study abroad for credit are required to complete an advising meeting. For faculty-led study abroad programs, the faculty leader is responsible for holding an advising meeting with all students who intend to participate in your study abroad program to discuss academic expectations for the course, program logistics, and financial considerations . Faculty are responsible for tracking student advising meetings in the application portal.
Enroll Students
Once your course is approved by the appropriate university channels, you will need to submit your course to be listed in the appropriate term in the Student Information System (SIS). Study abroad courses are sent to the Office of the Registrar in the same way all other courses are submitted. When submitting your course to be listed in SIS, be sure to indicate that students will need your permission before they register for the course. Once the student has completed the study abroad program application and been accepted to your program, you will be able to give them permission to register in SIS. All faculty-led study abroad program participants must be students enrolled in the course for credit . Please note that participants may not enroll through an audit or College Credit Plus program.
Coordinate Program Fees and Finances
Faculty are required to submit to the Office of Education information on program finances and budget, including:
- The amount the students will pay as their study abroad program fee
- The account number where the student program fees will be kept or journaled
- The name of an individual in your department who will pay invoices and make reimbursements for the program
Most study abroad programs require a $250 or greater non-refundable deposit that is paid to the Office of Education Abroad and journaled back to the department.
For fall and spring semester study abroad programs , students pay their study abroad program fee as a course fee in SIS upon registration, and the funds are moved into the account number given on the program information form almost immediately. Reimbursements and invoices for the study abroad program are paid out of that account.
For summer term study abroad programs , students pay their study abroad program fee directly to the Office of Education Abroad by March 30. After the program fee due date, the Office of Education Abroad journals these funds and the student deposits back to the department to pay invoices and make reimbursements to fund the study abroad program. Students are also required to pay tuition for courses offered during the summer term (link out to summer term).
When a department is paying vendor invoices and faculty/staff reimbursements for a study abroad program, please note that these cannot be paid until the funds are in the department's account.
The Office of Procurement requires that faculty complete W-8-BENE or W-8BEN tax form, as well as the Supplier Information Form . Faculty need to collect this information from foreign vendors early in the program development process. Both of these forms have extensive instructions on them. If the faculty member or the vendor have any questions, the faculty member should contact the Office of Procurement at [email protected] .
Next Steps: Before Going Abroad
- River City Live
- Newsletters
WEATHER ALERT
11 warnings in effect for 6 counties in the area
Judge rejects donald trump's latest demand to step aside from hush money criminal case.
Michael R. Sisak And Jennifer Peltz
Associated Press
FILE - Former President Donald Trump awaits the start of proceedings on the second day of jury selection at Manhattan criminal court, April 16, 2024, in New York. (Justin Lane/Pool Photo via AP)
NEW YORK – Donald Trump has lost his latest bid for a new judge in his New York hush money criminal case as it heads toward a key ruling and potential sentencing next month.
In a decision posted Wednesday , Judge Juan M. Merchan declined to step aside and said Trump's demand was a rehash “rife with inaccuracies and unsubstantiated claims” about his ability to remain impartial.
Recommended Videos
It is the third time that Merchan has rejected such a request from lawyers for the former president and current Republican nominee. They contend the judge has a conflict of interest because his daughter works as a political consultant for prominent Democrats, including Kamala Harris when she sought the Democrats' 2020 presidential nomination. Harris is now the party’s nominee against Trump.
The judge's daughter, Loren Merchan, met Harris occasionally in 2019 but never “developed an individual relationship” with her, consulting firm founder Mike Nellis told the chairman of the U.S. House Judiciary Committee, Rep. Jim Jordan, R-Ohio, in a letter Tuesday. The firm, Authentic Campaigns Inc., has not worked for Harris’ campaign, President Joe Biden’s now-ended reelection bid or the Democratic National Committee in the 2024 election cycle, Nellis said.
A state court ethics panel said last year that Merchan could continue as the judge on Trump's case. The panel wrote that a relative’s independent political activities are not “a reasonable basis to question the judge’s impartiality."
Merchan, a state court judge in Manhattan, acknowledged last year that he made several small donations to Democratic causes during the 2020 campaign, including $15 to Biden. But Merchan has repeatedly said he is certain he can handle Trump's case fairly and impartially. In his ruling, Merchan wrote he will continue to base decisions “on the evidence and the law, without fear or favor, casting aside undue influence.”
“With these fundamental principles in mind, this Court now reiterates for the third time, that which should already be clear — innuendo and mischaracterizations do not a conflict create,” Merchan wrote in his three-page decision. “Recusal is therefore not necessary, much less required.”
But with Harris now Trump’s opponent, Trump lawyer Todd Blanche argued in a letter to the judge last month that the defense’s concerns have become “even more concrete.”
Prosecutors called the claims “a vexatious and frivolous attempt to relitigate” the issue.
Trump campaign spokesman Steven Cheung, citing Merchan's donation to Biden and Loren Merchan's consulting work, slammed him as a “highly-conflicted judge" who "should have long ago recused himself from this case."
Merchan “has proved to be biased against President Trump and beholden to not only Democrat partisan interests, but also to the glaring financial interests of an immediate family member,” Cheung said.
Trump railed against Merchan on his Truth Social platform for continuing to keep him under a partial gag order — an issue that was not part of the recusal decision. Earlier this month, a state appeals court upheld the gag order , which bars Trump from making public comments about the prosecution team, court staffers or their families, including Merchan’s daughter.
The Manhattan district attorney’s office, which prosecuted the case, declined to comment.
Trump was convicted in May of falsifying his business’ records to conceal a 2016 deal to pay off porn actor Stormy Daniels to stay quiet about her alleged 2006 sexual encounter with him. Prosecutors cast the payout as part of a Trump-driven effort to keep voters from hearing salacious stories about him during his first campaign.
Trump says all the stories were false, the business records were not and the case was a political maneuver meant to damage his current campaign. Manhattan District Attorney Alvin Bragg is a Democrat.
Trump has pledged to appeal, but that can't happen until he is sentenced.
In the meantime, his lawyers have taken other steps to try to derail the case. Besides the recusal request, they've asked Merchan to overturn the verdict and dismiss the case because of the U.S. Supreme Court’s July presidential immunity ruling .
That decision reins in prosecutions of ex-presidents for official acts and restricts prosecutors in pointing to official acts as evidence that a president’s unofficial actions were illegal. Trump’s lawyers argue that in light of the ruling, jurors in the hush money case should not have heard such evidence as former White House staffers describing how the then-president reacted to news coverage of the Daniels deal.
Merchan has said he will rule on the immunity claim on Sept. 16 and set Sept. 18 for “the imposition of sentence or other proceedings as appropriate.”
Jordan, the House committee chairman, sent a letter to Loren Merchan on Aug. 1 demanding she turn over any documents pertaining to the Harris and Biden campaigns, any discussions she or her firm may have had about Trump’s hush money prosecution, and any conversations she may have had with her father about the case.
Jordan suggested that because some Authentic clients have mentioned Trump's case in fundraising solicitations, there was at least “a perception” that Loren Merchan and the firm could profit from it. But Nellis, the firm's founder, said it does not get a percentage of any money its clients raise and that “neither Authentic nor Ms. Merchan benefits financially from any rulings in Donald Trump’s criminal or civil trials.”
The judge’s daughter, who became a partner in the firm after 2019, has had only “minimal input or contact with any political clients” this cycle and wasn’t aware of any client communications that mentioned Trump’s trial, Nellis added.
Anything she may have said to her father about the criminal case would have been “for the purpose of confirming her and her family’s well-being and safety,” Nellis wrote. He noted that she had faced death threats and that law enforcement had advised her and her family to leave their home several times “for their own safety.”
The hush money case is one of four criminal prosecutions brought against Trump last year.
One federal case, accusing Trump of illegally hoarding classified documents at his Mar-a-Lago estate in Florida, was dismissed last month. The Justice Department is appealing.
The others — federal and Georgia state cases concerning Trump’s efforts to overturn his 2020 election loss — are not positioned to go to trial before the November election.
Copyright 2024 The Associated Press. All rights reserved. This material may not be published, broadcast, rewritten or redistributed without permission.
Click here to take a moment and familiarize yourself with our Community Guidelines.
InfoQ Software Architects' Newsletter
A monthly overview of things you need to know as an architect or aspiring architect.
View an example
We protect your privacy.
InfoQ Dev Summit Munich (Sep 26-27): Learn practical strategies to clarify critical development priorities. Summer Sale Now On
Facilitating the Spread of Knowledge and Innovation in Professional Software Development
- English edition
- Chinese edition
- Japanese edition
- French edition
Back to login
Login with:
Don't have an infoq account, helpful links.
- About InfoQ
- InfoQ Editors
Write for InfoQ
- About C4Media
Choose your language
Get clarity from senior software practitioners on today's critical dev priorities. Register Now.
Level up your software skills by uncovering the emerging trends you should focus on. Register now.
Discover emerging trends, insights, and real-world best practices in software development & tech leadership. Join now.
Your monthly guide to all the topics, technologies and techniques that every professional needs to know about. Subscribe for free.
InfoQ Homepage News Netflix Adopts Virtual Threads: a Case Study on Performance and Pitfalls
Netflix Adopts Virtual Threads: a Case Study on Performance and Pitfalls
Aug 05, 2024 3 min read
A N M Bazlur Rahman
Netflix, a long-time Java adopter, recently upgraded to Java 21. They are now harnessing new features such as generational ZGC , introduced in JEP 439, and virtual threads , introduced in JEP 444, to improve performance across its extensive microservices fleet. While virtual threads, designed for high-throughput concurrent applications, showed early promise, they also brought unique challenges in real-world scenarios.
In a recent post on the Netflix Tech Blog, the JVM Ecosystem team shared insights from their experience with virtual threads, particularly an issue where services experienced timeouts and hung instances. The issue was related to the interaction of virtual threads with blocking operations and OS thread availability, resulting in a deadlock-like situation in their SpringBoot-based applications.

Initial diagnostics suggested that virtual threads were implicated in the issue, although they didn't appear in traditional thread dumps. Using jcmd Thread.dump_to_file , the team found thousands of "blank" virtual threads, indicating threads created but not yet running. The issue was traced to Tomcat's request handling, where new virtual threads were created but couldn't be scheduled due to the unavailability of OS threads.
The analysis revealed that Tomcat's virtual thread executor was creating threads for each request, but these threads were stuck waiting for a lock. Specifically, the threads were pinned to OS threads due to blocking operations within synchronized blocks, exacerbated by the limited number of available OS threads in the ForkJoinPool .
The problem resulted from a classic deadlock scenario in which virtual threads could not proceed because the required lock was held by other virtual threads pinned to all available OS threads. This prevented new virtual threads from being scheduled, effectively stalling the application.
To resolve the issue, Netflix's JVM Ecosystem team used a heap dump to inspect the lock's state and confirmed that no thread owned it, yet the threads waiting for it were unable to proceed. This was a transient state that should have resolved but was instead causing a deadlock-like situation.
The team identified the root cause and developed a reproducible test case to prevent similar issues in the future. While virtual threads in Java 21 have shown potential for improving performance by reducing overhead, this case highlights the importance of understanding their interaction with existing threading models and locking mechanisms.
Adding to Netflix's findings, a recent case study on InfoQ also delves into the practical challenges and benefits of virtual threads, particularly in scenarios involving heavy concurrent workloads. This study underscores the need for careful consideration and testing when integrating virtual threads into production systems, as even small architectural details can lead to significant performance impacts.
In addition to virtual threads, Netflix’s adoption of generational ZGC has also played a crucial role in optimizing its systems, as mentioned in one of the recent articles . ZGC, with its ability to maintain low pause times even as heap sizes grow, has significantly improved Netflix's application performance by reducing garbage collection overhead and enhancing responsiveness. More on generational ZGC can be found in this InfoQ news item .
Netflix also has a robust alert system, leveraging its Atlas Streaming Eval platform, which was vital in identifying and diagnosing these issues. The system, designed for improved real-time monitoring and alerting, enabled the team to catch instances in a problematic state and provided critical data for retroactive analysis.
Despite the challenges, Netflix is optimistic about the future of virtual threads and anticipates further improvements in upcoming Java releases, particularly in addressing the integration challenges with locking primitives. This case study is a valuable example for performance engineers and developers as they explore virtual threads in their applications.
About the Author
Rate this article, this content is in the java topic, related topics:.
- Development
- Performance
- Virtual Thread
Related Editorial
Related sponsored content, [ebook] api security for the modern enterprise, related sponsor.
/filters:no_upscale()/sponsorship/topic/ab4e0ce7-864a-4131-b009-638fe135de28/CurityLogoRSB-1712304212846.png "illiteracy case study")
Protect Identities. Secure Digital Services. Enable scalable and secure user access to web and mobile applications. Start free trial .
Related Content
The infoq newsletter.
A round-up of last week’s content on InfoQ sent out every Tuesday. Join a community of over 250,000 senior developers. View an example
IMAGES
COMMENTS
The numbers are staggering. As of 2022, ThinkImpact reports that an estimated 79% of American adults are literate. To put it another way, one out of every five American adults are functionally illiterate, meaning that today in the United States, almost 65 million people are unable to read basic sentences, fill out a job application form, or understand the instructions on their prescription labels.
simple (iii) The components for defining functional illiteracy differ between studies: while Rüsseler and colleagues use reading and spelling tests (Boltzmann and Rüsseler, 2013; ... The role of sensorimotor impairments in dyslexia: a multiple case study of dyslexic children. Dev. Sci. 9 237-269. 10.1111/j.1467-7687.2006.00483.x ...
Eradicating illiteracy would have enormous economic benefits. This analysis finds that getting all U.S. adults to at least a Level 3 of literacy proficiency would generate an additional $2.2 trillion in annual income for the country. That is 10% of the gross domestic product.
This case study presents some results, a comparison between the samples, and the theoretical challenges about the role of democracy and illiteracy in situations of social and political upheaval. The research centers on proving that illiterates are not disruptive and that they show a moderate response. As a conclusion, future research is ...
Fight Against Illiteracy in India - Case Study of. Institute of People's Education in Bikaner. Beata Pietkiewicz-Pareek. Uniwersytet Mikołaja Kopernika, Toruń. Poland. beatapietkiewicz@gmail ...
Abstract. Adult illiteracy is a global social problem even today despite number of diligent efforts by different governments, the United Nations Educational, Scientific, and Cultural Organization (UNESCO), and other international organizations. The problem is not only restricted to developing nations but also prevalent in developed countries.
The aim of this study was to investigate the impact of illiteracy on physical health and mental health. Design: Matching methods (nearest neighbour matching, Mahalanobis metric matching, and propensity score matching).
3 Geographical Factors Household data from 42 countries. show that rural children are twice as likely to be out of school as children living in urban areas. 3. education are more than twice as likely to send their own children to school as mothers with no education. 7.
The operational definitions of illiteracy, employment and productivity employed by this pilot study are detailed below.50 The Social and Economic Impact of Illiteracy: Analytical Model and Pilot Study 3.1 Illiteracy Illiteracy may be analyzed at different levels, through complementary indicators. 3.1.1.
The country's overall adult literacy rate increased from 34.8% in 2004 to 43.2% in 2018 growing at an average annual rate of 13.18% (World Data Atlas, 2018). This present case study seeks to understand the consequence of illiteracy on women in Sierra Leone by examining Charlotte, a hamlet in the country.
The study of illiteracy can contribute to a broader understanding of the organization of cognition. Clinical Neuropsychology. The analysis of illiteracy can help to discern the influence of both literacy and schooling on cognitive test performance. ... whereas the reverse was the case for the inferior parts and the precuneus. This suggests ...
Abstract. The main objective of this research paper is to understand that illiteracy is a social problem. It has proven to be unfavourable upon the overall quality of lives of the individuals ...
Functional illiteracy characterizes people who, despite formal education, do not possess the basic literacy skills to deal with everyday life requirements. Although a few studies have shown the heterogeneity of functional illiteracy, empirical research to differentiate these people at the individual level of more basic skills is lacking. The goal of this study is to assess the linguistic ...
Generative Case Study (a hybridized version of case study that also draws on grounded theory) was employed to explore the literacy experiences of six Black males in seeking understanding of how these experiences gave rise to Literacy Confusion and propelled them into the STPP.
Illiteracy has affected women in Sierra Leone, by limiting their abilities to participate in governmental, domestic, and economic activities. As a result of the limited opportunities, women are faced with various challenges that impact their social livelihood. For example, women are deprived from making decisions in their homes because of low educational status. Sierra Leone has an adult ...
To fulfill the main objective, the study aims at identifying the following ob jectives. 1. To study the background characteristics of the adult learner and the volunteer teacher on the basis of sex, age, religion, caste, marital status, occupation and family income 2. To trace the factors responsible for illiteracy and dropouts.
This study aimed to find the gender equality in terms of illiteracy, child marriages and spousal violence among women based on data from National Family Health Survey 2015-16 (NFHS-4). Methods This was a descriptive analysis of secondary data of ever-married women onto reproductive age from 15 states and 3 UTs in India of the first phase of NFHS-4.
The National Policy of Education has been declared that the whole nation has to commit itself and help in eradicating illiteracy, especially among the young population. The National Literacy Mission of 1988 made literacy a community endeavour. It has aimed to attain a literacy rate of 41% by 2035.
Present research is an attempt to study the social, educational and personal causes of adult illiteracy. Qualitative approach was adopted to evaluate causes of illiteracy. Ferozepur district of Punjab (India) was chosen as the region for conducting this study mainly for its low literacy rate and being a border area of Punjab, from where 60 adult
Poverty, parental illiteracy, lack of educational facilities, social and cultural disputes, unemployment, behavior of teacher and lack of children interest were the main causes of illiteracy. The finding of study depicted that 60% people were illiterate due to poverty. Illiteracy is not only a social evil but also causes many other social evils.
Findings of the study show that lack of parents interest, alcoholism/drug abuse of father and 'early marriage' have been reported as social causes for illiteracy among adults while in educational ...
2013 Fight Against Illiteracy in India -Case Study of Institute of People's Education in Bikaner Beata Pietkiewicz-Pareek Uniwersytet Mikołaja Kopernika, Toruń Poland [email protected] Abstract-The main objective of presented research is to show an activity of Institute of People`s Education in India, who fights with illiteracy.
Growing and maintaining turf in Maryland is challenging and resource-intensive. Replacing grass areas with locally adapted native plants and landscaping is an effective way to make your property beautiful and better for the environment. Take a look at the examples below of Maryland residents who reduced their lawns, solved water runoff problems, increased enjoyment of their property, and ...
At this year's Agricultural & Applied Economics Association (AAEA) annual meeting, UF graduate students Meri Hambaryan, Kelvin Amon, and Chenxi Hu, competed in the annual Case Study Competition against graduate students from all over the world, placing third.. Hosted by the Agribusiness Economics and Management (AEM) - Graduate Student Section (GSS), this prestigious competition invites ...
Kim Kardashian West, Khloé Kardashian, Kendall Jenner and Kylie Jenner each launched their own subscription apps, all of which shot up into the App Store's top charts.There was no charge for ...
QUESTIONNAIRES Women Socioeconomic Status: The Repercussion of Illiteracy, Case Study: Charlotte, Sierra LeoneChecklist. This checklist was designed to collect data from the People of Charlotte, to carry on a research which tends to analyze the causative factor for low socio-economic livelihood of Women in Charlotte. These questions will be use ...
Reimbursements and invoices for the study abroad program are paid out of that account. For summer term study abroad programs, students pay their study abroad program fee directly to the Office of Education Abroad by March 30. After the program fee due date, the Office of Education Abroad journals these funds and the student deposits back to the ...
The hush money case is one of four criminal prosecutions brought against Trump last year. One federal case, accusing Trump of illegally hoarding classified documents at his Mar-a-Lago estate in ...
This case study is a valuable example for performance engineers and developers as they explore virtual threads in their applications. About the Author. A N M Bazlur Rahman. Show more Show less.