- 0 Shopping Cart

Cyclone Idai
The cause, primary and secondary effects and immediate and long term responses to Cyclone Idai
Cyclones are tropical storms that occur in the Indian Ocean. Cyclone Idai is the strongest tropical cyclone on record to affect Africa and the Southern Hemisphere.

Cyclone Idai satellite image
What caused Cyclone Idai?
In early March 2019, a storm cell brought heavy rains to Malawi before heading out to sea off the coast of Mozambique. The storm intensified into Cyclone Idai and returned to land on the evening of 14th March 2019. Often, storms that develop there don’t strengthen as much as those that form north and east of Madagascar, but Cyclone Idai was fed by warm water temperatures. The storm, with winds of up to 115 mph/185 kph and more than 150mm of rain in 24 hours, wreaked havoc in the Mozambique port city of Beira, home to 500,000 people, along with surrounding districts. It then swept inland and on to Zimbabwe. The storm caused widespread devastation and the loss of life and livelihoods of hundreds of thousands more people.

The location of Cyclone Idai
March 3 2019
Tropical disturbance forms.
The tropical disturbance that would become Cyclone Idai develops and begins to strengthen near the coast of Africa.
March 5th 2019
Heavy rains cause severe flooding across Mozambique and Malawi.
March 11 2019
Tropical depression.
Now a tropical depression, the storm becomes more intense between coastal Africa and Madagascar.
March 14-15 2019
Tropical cyclone idai makes landfall.
Tropical Cyclone Idai makes landfall near Beira, Mozambique, as a Category 2 storm with sustained winds exceeding 105 mph.
March 20 2019
Heavy rain continues.
Heavy rains continue along with search and rescue operations and damage assessments.
March 21 to 27
Aid response.
Governments and humanitarian aid agencies begin responding with life-saving relief supplies to the affected areas.
Search called off
The Mozambique government calls off the search for survivors of Cyclone Idai.
Cholera Cases
Cholera cases in Mozambique top 1,400, according to health officials.
What were the effects?
Flooding in Southern Africa has affected nearly 3 million people in Mozambique, Malawi, and Zimbabwe since the rain began in early March and Cyclone Idai struck March 14 and 15. The death toll has exceeded 843 people, and many more remain missing. Over 1 million people were displaced by the storm.
It was not just heavy rainfall that led to flooding, storm surges between 3.5m to 4m hit the coastal city of Beira. The ocean floor along the coast by Mozambique is conducive to give storm surges.
The image below shows the area around Beira before and after the cyclone.
According to the Red Cross, up to 90% of Beira, Mozambique’s fourth largest city, has been damaged or destroyed. The devastated city became an island amid the flooded area with communications, power and clean water severely disrupted or non-existent. Houses, roads and crops disappeared beneath the water that was six metres (19ft) deep in places. Rescuers struggling to reach survivors who may have spent up to a week sheltering on roofs and in trees. A woman gave birth in a mango tree while escaping floods in central Mozambique.
The coastal lowlands, located between the higher plateau and the mountainous areas to the west near the Zimbabwean border were the hardest hit by the floods.
At least 180 people in Zimbabwe known to have been killed by landslides triggered by Idai. Nasa satellite images depict the extensive landslide activity associated with Cyclone Idai . The landslides were partly caused by deforestation.
People were still being rescued a week and a half after the storm.
As flood waters receded, survivors struggled to obtain food, clean water, and shelter.
According to the World Bank the cyclone affected about 3 million people, damaging infrastructure and livelihoods. Unicef reported that over half of the 3 million people in urgent need of humanitarian help were children.
The UN World Food Programme (WFP) says that Cyclone Idai wiped out a whole year’s worth of crops across swathes of Mozambique, Malawi and Zimbabwe. At least 1 million acres of crops were destroyed.
The cyclone is expected to cost Malawi, Mozambique and Zimbabwe more than $2bn, the World Bank has said.
Cholera infected at least 1,052 people in Mozambique’s cyclone-hit region.
What was the immediate response?
As part of the forward planning for severe weather, safe zones had been created in rural areas of Mozambique for evacuation above the flood plain . However, the flooding was far worse than had been expected.
The meteorological office of Mozambique, Inam, issued weather alerts as the storm developed. The highest possible alert was raised by the government three days before the cyclone struck, telling people to evacuate threatened areas.
Some people were evacuated by boat before the cyclone struck, however many people in rural areas didn’t respond to the warnings or were not aware of them.
According to the mayor of the Mozambican city of Beira, the government failed to warn people in the areas worst hit by Cyclone Idai despite a “red alert” being issued two days before it struck.
The South African air force and the Indian army, which happened to have a ship in the area, drove the initial rescue effort. Opposition groups in Mozambique blamed the limited government preparation and response on corruption.
Last year, the government of Mozambique received support from international donors for a disaster fund of $18.3m (£13.9m) for 2018 and 2019. This is the main source of funding for any disaster response and is intended specifically for search and rescue within the first 72 hours.
More than 130,000 newly homeless people were taken into reception centres.
Two weeks after the disaster 900,000 doses of oral cholera vaccines arrived in the cyclone-battered Beira city, from the global stockpile for an emergency, according to the World Health Organisation (WHO).
As flood waters receded the International Committee of the Red Cross supported flood-affected communities to recover bodies, identify them and bury them in clearly marked graves.
The Mozambique government announced the search and rescue operation to find survivors from Cyclone Idai was over two weeks after the storm.
With the help of OpenStreetMap – an open-source mapping resource – thousands of volunteers worldwide digitised satellite imagery and created maps of the affected area to support ground workers. Through the Missing Maps Project , an army of arm-chair mappers has already mapped more than 200,000 buildings and nearly 17,000 km of roads in the affected areas.
A large number of international charities launched appeals to fund aid to support those affected by Cyclone Idai including The Red Cross, Unicef, DEC, CAFOD and MSF (Doctors Without Borders).
What was the long term response?
Two weeks after the storm the government of Mozambique announced a new phase in the recovery operation was beginning to help those affected and rebuild the education, health, energy, transport, industry and trade sectors, which were all devastated by the cyclone.
The UN has appealed for donations of $282m to fund emergency assistance for the next three months.
Useful Resources
NASA Products for Cyclone Idai 2019
Virtual OSOCC Tropical Cyclone Idai in Mozambique
Virtual OSOCC Tropical Cyclone Idai in Zimbabwe

Premium Resources
Please support internet geography.
If you've found the resources on this page useful please consider making a secure donation via PayPal to support the development of the site. The site is self-funded and your support is really appreciated.
Related Topics
Use the images below to explore related GeoTopics.
Cyclone Eline
Weather and climate home, hurricane andrew, share this:.
- Click to share on Twitter (Opens in new window)
- Click to share on Facebook (Opens in new window)
- Click to share on Pinterest (Opens in new window)
- Click to email a link to a friend (Opens in new window)
- Click to share on WhatsApp (Opens in new window)
- Click to print (Opens in new window)
If you've found the resources on this site useful please consider making a secure donation via PayPal to support the development of the site. The site is self-funded and your support is really appreciated.
Search Internet Geography
Latest Blog Entries
Pin It on Pinterest
- Click to share
- Print Friendly

An official website of the United States government
Here’s how you know
Official websites use .gov A .gov website belongs to an official government organization in the United States.
Secure .gov websites use HTTPS A lock ( Lock A locked padlock ) or https:// means you’ve safely connected to the .gov website. Share sensitive information only on official, secure websites.
Study: Climate change has been influencing where tropical cyclones rage
While the global average number of tropical cyclones each year has not budged from 86 over the last four decades, climate change has been influencing the locations of where these deadly storms occur, according to new NOAA-led research published in Proceedings of the National Academy of Science . offsite link
, Irma (center), and Jose (right) was the first such occurrence since 2010. All three hurricanes were threatening land at the time. (Image credit: NOAA/NASA)")
During one of the most active Atlantic hurricane seasons in recent years, three simultaneous hurricanes were captured by the Suomi-NPP satellite on September 8, 2017. The appearance of Katia (left), Irma (center), and Jose (right) was the first such occurrence since 2010. All three hurricanes were threatening land at the time. (Image credit: NOAA/NASA)
New research indicates that the number of tropical cyclones has been rising since 1980 in the North Atlantic and Central Pacific, while storms have been declining in the western Pacific and in the South Indian Ocean.
“We show for the first time that this observed geographic pattern cannot be explained only by natural variability,” said Hiroyuki Murakami, a climate researcher at NOAA’s Geophysical Fluid Dynamics Laboratory and lead author.
Murakami used climate models to determine that greenhouse gases, manmade aerosols including particulate pollution, and volcanic eruptions were influencing where tropical cyclones were hitting.

3 forces are influencing where storms are hitting
Greenhouse gases are warming the upper atmosphere and the ocean. This combines to create a more stable atmosphere with less chance that convection of air currents will help spawn and build up tropical cyclones.
Particulate pollution and other aerosols help create clouds and reflect sunlight away from the earth, causing cooling, Murakami said. The decline in particulate pollution due to pollution control measures may increase the warming of the ocean by allowing more sunlight to be absorbed by the ocean.
Diminishing manmade aerosols is one of the reasons for the active tropical cyclones in the North Atlantic over the last 40 years, Murakami said. However, toward the end of this century, tropical cyclones in the North Atlantic are projected to decrease due to the “calming” effect of greenhouse gases.
Volcanic eruptions have also altered the location of where tropical cyclones have occurred, according to the research. For example, the major eruptions in El Chichón in Mexico in 1982 and Pinatubo in the Philippines in 1991 caused the atmosphere of the northern hemisphere to cool, which shifted tropical cyclone activity southward for a few years. Ocean warming has resumed since 2000, leading to increased tropical cyclone activity in the Northern Hemisphere.
Looking ahead: Scientists predict fewer tropical cyclones by 2100 but likely more powerful
Climate models project decreases in tropical cyclones toward the end of the 21st century from the annual average of 86 to about 69 worldwide, according to the new study. Declines are projected in most regions except in the Central Pacific, including Hawaii, where tropical cyclones activity is expected to increase.
Despite a projected decline in tropical cyclones by 2100, many of these cyclones will be significantly more severe. Why? Rising sea surface temperatures fuel the intensity and destructiveness of tropical storms.
“We hope this research provides information to help decision-makers understand the forces driving tropical cyclone patterns and make plans accordingly to protect lives and infrastructure,” Murakami said.
Media contact
Monica Allen , (202) 379-6693
Related Features //
")
Black Marble products expedited disaster relief efforts in Mozambique during Hurricane Idai
Stay Updated
Subscribe To Our Newsletter
In March 2019, Tropical Cyclone Idai made a devastating landfall over Mozambique’s port city of Beira, Sofala Province. The storm - considered one of the deadliest cyclones to hit the Southern Hemisphere - destroyed and damaged about 90% of Beira City’s infrastructures and energy grids, leaving thousands of people homeless and without electricity. The impact of the storm was catastrophic due to a combination of high winds, and concentrated rainfall, low-lying land and poor-quality housing and infrastructure.
In response to the requests from the Department of State and the International Federation of Red Cross and Red Crescent Societies, the Black Marble Product effort led by Miguel Román, monitored the impacts of Cyclone Idai in Mozambique in coordination with NASA and World Bank partners.
The power outage maps generated using the Black Marble products expedited disaster response efforts. By tracking these outages over time, stakeholders can also monitor the recovery effort, and better understand the state of basic service provision in local communities, and how vulnerable populations with poor access to resources are being affected. As such, these information products inform disaster response efforts in the short-term, while also improving our understanding of how communities can become more resilient to disasters in the long term. These products were made publicly available through the NASA’s disaster data portal.
The insights gained from the recovery efforts in Mozambique emphasize the unique capabilities of the Earth from Space Institute (EfSI), which is continuing to develop these products for improved disaster response and long-term recovery assessments.
Monitoring Impact of Cyclone Idai through Power Outages using Black Marble

References & Resources
The Weather Network: Before and after shots show extent of Mozambique devastation
Forbes: Double Jeopardy On Two African Coasts - Cyclone Idai And Saharan Dust
USAID: Mozambique - Tropical Cyclone Idai - Fact Sheet #1 2019
American Red Cross: Mozambique Cyclone: "Almost Everything is Destroyed"
Thank you for visiting nature.com. You are using a browser version with limited support for CSS. To obtain the best experience, we recommend you use a more up to date browser (or turn off compatibility mode in Internet Explorer). In the meantime, to ensure continued support, we are displaying the site without styles and JavaScript.
- View all journals
- Explore content
- About the journal
- Publish with us
- Sign up for alerts
- Open access
- Published: 01 July 2024
Compound hazard mapping for tropical cyclone-induced concurrent wind and rainfall extremes over India
- Ravi Ranjan 1 &
- Subhankar Karmakar 1 , 2 , 3
npj Natural Hazards volume 1 , Article number: 15 ( 2024 ) Cite this article
1161 Accesses
Metrics details
- Natural hazards
India is the worst affected region in the world by tropical cyclones (TCs), causing an average 2% annual GDP loss. TCs instigate many other natural hazards that have a compounding effect on the adversely affected population and present significant challenges to the resilience of emergency response systems and infrastructure. Hence, any risk assessment on TC is inherently multivariate/compound in nature. This study investigates co-occurring wind and rainfall extremes during TCs across India (1979–2020) using a novel quasi-Lagrangian approach, focusing on location-specific hazards. Eastern coastal states and adjacent inland areas experience the highest frequency (≥10 cyclones in 40 years) of concurrent extremes (wind gusts ≥ 16 m/s and rainfall ≥ 18 mm/h). Whereas duration-wise, the eastern coastal states and Gujarat state experience frequent concurrent extremes lasting more than a day annually, with the Krishna–Godavari delta region particularly vulnerable to highly severe events (duration of concurrent extremes ≥ 24 h). This study provides a high-resolution cartographic product of compound hazard from TC-induced extremes for the first time over the entire India, highlighting regional heterogeneity and aiding targeted national-level risk mitigation and adaptation planning.
Stochastic coastal flood risk modelling for the east coast of Africa

Improving our understanding of future tropical cyclone intensities in the Caribbean using a high-resolution regional climate model

Increasing sequential tropical cyclone hazards along the US East and Gulf coasts
Introduction.
Compound weather and climate extremes, which represent combinations of multiple drivers and/or hazards, have disproportionate impacts on natural environments and social economies compared to individual extremes 1 , 2 , 3 . In recent years, a number of compound extremes (particularly concurrent extremes) have been investigated due to their amplified impact on ecologies, economies, and human health 3 , 4 . Simultaneous or successive extremes weaken emergency response systems at the local to national level and reduce the resilience of natural and human infrastructure systems, leading to “loss amplification” 5 , 6 . Globally, compound events have recently aroused the interest of several climate researchers in various combinations of extreme events leading to compounded impact 4 , 7 , 8 , 9 , 10 , 11 , 12 , 13 , 14 , 15 , 16 , 17 , 18 , 19 , 20 .
The proportion of intense tropical cyclones (TCs) (category 4–5) and peak wind speeds of the most intense TCs are projected to increase at the global scale with increasing global warming (high confidence), according to the IPCC AR6 report 21 . While the AR6 report does not explicitly address changes in the frequency of cyclones for the Indian Ocean region, studies suggest an increase in heavy precipitation associated with TCs in this region 21 . Additionally, Murakami et al. 22 and Murakami and Wang 23 projected an increase in the frequency of very severe cyclonic storms over the Arabian Sea and the Bay of Bengal by the end of the 21st century under a high-emissions scenario. Notably, the Global Assessment Report on Risk Reduction (GAR) by UNEP/GRID-Geneva depicts the highest TC mortality risk along the Bay of Bengal coast and the Arabian Sea coast (see Supplementary Information, Fig. S1 ). The National Cyclone Risk Mitigation Project (2021) reported that India is the worst-affected region of the world by TCs, with an average annual loss of about 2% of GDP due to cyclone-related damage. Furthermore, the power system along the Indian coastline is also highly vulnerable to TC impacts 24 .
TCs invite many natural hazards (extreme wind gusts, torrential rainfall, storm surges, and waves, inland riverine floods, and waterlogging), which have a compounding effect on the adversely affected population 25 , 26 . Consequently, any risk assessment on TC is inherently compound/multivariate in nature. Surprisingly, despite the extremely high societal relevance, the study of cyclone hazards from a compound event perspective, focusing on affected locations, has received no attention. Numerous studies have been conducted on single events of extreme precipitation and extreme wind speeds 27 , 28 , 29 , 30 , 31 , 32 . However, relatively few are compound (or concurrent) events comprised of these single events 13 , 20 . Multiple studies show that the risk from hydroclimatic compound extremes may be underestimated if the dependence among concerned variables is not considered in hazard estimation 33 , 34 .
Compound extremes can occur by chance and be causally unrelated, or they can be triggered by the same underlying process or weather system 35 . Simultaneous wind and rainfall extremes are often associated. Concurrent rainfall and wind speed extremes may induce other compound hazards, such as compound coastal flooding due to storm surge and inland extreme rainfall, through a “disaster chain” effect thereby endangering the surrounding society, economy, and health of humans and animals. The maximum wind speed (MWS) at landfall is often employed to represent the wind severity of a TC. Windspeed and rainfall are two representative hazards of TC disasters 36 , 37 . In coastal areas of India, TCs usually dissipate rapidly after landfall and the wind energy is released in a short period. Thus, the MWS at landfall is often employed to represent the wind severity of a TC. It is notable that MWS can also reflect the potential severity of storm surges and waves, which are mainly driven by strong winds in coastal regions. Similarly, cumulative rainfall is generally selected as a proxy index to reflect the direct impact of TC rainfall as well as its induced effects such as inland riverine flood and waterlogging. While several growing social science literature estimates loss from TCs, almost all have characterized TCs by wind speed alone. In addition, TC-induced concomitant wind and rainfall extremes are of great interest to insurance companies, as the interdependence of extremes and their impacts need to be included in insurance catastrophe loss models. Furthermore, currently, available literature on TC hazards is limited to coastal states/districts only as part of coastal hazards, despite its effects extending deep inland. Bakkensen et al. 36 showed hazard intensity estimation based solely on univariate parameters (e.g., wind) fails to represent the compound hazard severity of TC using a case study for the Korean region. Other studies 13 , 20 , 37 , 38 , 39 also highlight the importance of accounting for both wind and rainfall in research and policy, especially in mitigation and adaptation planning.
Literature on cyclone hazard studies over India is based on the total number of cyclones 26 , 40 , 41 , 42 , probable maximum windspeed 26 , 40 , 41 , 42 , probable maximum precipitation and storm surge 26 , 41 , 42 , and maximum tidal range 26 . The location-specific cyclone hazard studies over India have neither considered the temporal distribution of these variables nor addressed the uncertainty associated with its exceedance probability. Though increasing interest in compound events has been observed in the past decade, the study of compound extremes over India is still at a nascent stage 43 , 44 , 45 . India bears substantial economic and other losses from hydrological extremes and needs urgent attention on disaster events, especially concurrent or sequential disasters, to minimize their impact 46 , 47 . While various studies have explored compound flooding, concurrent droughts and heatwaves, concurrent hot and dry periods, and other related phenomena, India’s lack of comprehensive TC severity analysis underscores the pressing necessity for a compound risk assessment framework for TCs over the entire India, including non-coastal regions. While Rajeev and Mishra 44 , 45 explored TCs as compound events in the North Indian Ocean (NIO), their focus remained solely on cyclone characterization and severity. However, a critical gap exists in addressing the impact locations and associated return levels at any given location.
Here, we aim to provide a comprehensive framework to develop high-resolution maps detailing the spatiotemporal patterns of concurrent wind–rainfall extremes induced by TCs. Through this study, we address the following research questions: (1) Which regions experience the most frequent and longest duration of cyclonic influence annually in India? (2) How long do concurrent wind–rainfall extremes associated with TCs last in different parts of India, and how often can these events be expected to occur? (3) Where are cyclones most likely to cause both extreme wind and rainfall simultaneously for a very long duration? The current study explores the characteristics of concurrent wind and rainfall extremes induced by cyclones and/or low-pressure systems (deep depression) based on 3-hourly rainfall and maximum gust windspeed data from 1979 to 2020 over the entire India. Specifically, the focus is on the concurrent occurrence of wind and rainfall extremes, recognizing that this combination can lead to significant and multifaceted impacts. This study focuses on TCs originating in the Arabian Sea or the Bay of Bengal between 1979 and 2020. Figure 1 depicts tracks of these TCs over the study area. Figure S2 in Supplementary Information can be referred to as the physical map of India and labeled administrative state boundaries for understanding the geographic specificity of findings in the “Results” section. Logistic regression analysis is performed to find an association between extreme rainfall and extreme wind speeds during TC events across India. This study offers a comprehensive evaluation of the compound hazard posed by TCs in India, providing the first high-resolution compound hazard maps for TCs which can serve a crucial role in national-level cyclone risk mitigation and adaptation planning.

Study area and track of cyclones (data source: IBTrACS v4.0) in the NIO considered for the study.
Cyclonic events over India
A quasi-Lagrangian approach with a 500 km range of influence (i.e., 1000 km × 1000 km square region centered on a cyclone) from the cyclone center is applied over four decades of historical cyclone track data to determine the total number of cyclonic events (Fig. 2a ) and average TC-induced extreme exposure durations (Fig. 2b ) over India. The sensitivity test conducted to ensure the robustness of our TC influence range definition found that TC rainfall remained relatively insensitive beyond 500 km up to 1000 km (not shown).

a An average number of cyclone events observed per year at a location in India during 1979–2020. b Average TC duration exposure observed at a location over India during 1979–2020. The distribution plots in both subfigures show exceedance probability for the spatial distribution (i.e., a fraction of the region across India more than any given value) [state name abbreviations: AP Andhra Pradesh, AS Assam, BR Bihar, CG Chhattisgarh, GJ Gujarat, JH Jharkhand, KA Karnataka, KL Kerala, MP Madhya Pradesh, MH Maharashtra, MN Manipur, ML Meghalaya, MZ Mizoram, OR Orissa, RJ Rajasthan, TL Telangana, TN Tamil Nadu, TR Tripura, UP Uttar Pradesh, WB West Bengal].
The cyclone track data used in the current study is for a total of 275 TCs originating in the Arabian Sea or the Bay of Bengal during 1979–2020. The study reveals eastern coastal and some of the inland states like Telangana, Chhattisgarh, and Jharkhand experience on average two or more cyclones (Fig. 2a ) spanning over three or more days every year (Fig. 2b ). Entire India below 26° latitude observes on-average at least one cyclone per year. The eastern side of India (≥3 days/year under cyclone influence) is more cyclone-prone than the western side (≤2 days/year under cyclone event). Coastal Odisha is the most cyclone-prone, experiencing on average more than a week of cyclone events each year. The number of cyclones and duration of cyclonic influence exhibit similar spatial variability patterns over India.
Wind extreme
The TC-induced extreme events have been defined as extreme events observed inside the influence range of 500 km from the cyclone center following the quasi-Lagrangian approach (see “Methods”, Fig. 8 ). The 3-hourly maximum 10 m-gust wind speed (see “Methods”, Eqs. ( 1 ), ( 4 )–( 5 )) is used to calculate the number of cyclonic events causing wind extremes (Fig. 3b ) and the average duration exposure of TC-induced wind extremes (Fig. 3e ) across India. The eastern coastal states including non-coastal states like Telangana, Chhattisgarh, Jharkhand, and eastern Maharashtra witnessed more than ten cyclones causing wind extremes in the last four decades (Fig. 3b ). Central and western states (like Bihar, Maharashtra, Gujarat, and Madhya Pradesh), despite being less cyclone-prone, encountered more than five cyclones causing wind extremes, mainly from cyclones moving inland or originating in the Arabian Sea. Duration-wise, eastern coastal states including Chhattisgarh encounter an annual average of three or more hours under wind extremes (Fig. 3e ). While Maharashtra, Gujarat, and Madhya Pradesh observe more than 1 h of TC-induced wind extremes annually.

Number of cyclonic events causing [ a wind, b rainfall, and c concurrent] extremes observed at a location over India during 1979–2020. Average duration exposure of cyclone-induced [ d wind, e rainfall, and f concurrent] extremes observed per year at a location over India during 1979–2020. The distribution plots in each subfigure show exceedance probability for the spatial distribution (i.e., a fraction of the region across India more than any given value) [state name abbreviations: AP Andhra Pradesh, AS Assam, BR Bihar, CG Chhattisgarh, GJ Gujarat, JH Jharkhand, KA Karnataka, KL Kerala, MP Madhya Pradesh, MH Maharashtra, MN Manipur, ML Meghalaya, MZ Mizoram, OR Orissa, RJ Rajasthan, TL Telangana, TN Tamil Nadu, TR Tripura, UP Uttar Pradesh, WB West Bengal].
Rainfall extreme
TCs significantly contribute to rainfall variability and extremes in India. The number of cyclonic events causing rainfall extremes during 1979–2020 (Fig. 3c ) and their average duration exposure (Fig. 3f ) at each location is quantified with the 3-hourly cumulative rainfall data (see “Methods”, Eqs. ( 2 ), ( 4 – 5 )) to understand spatiotemporal patterns of TC-induced rainfall extremes across the country.
It has been observed that the eastern coastal states (Odisha, West Bengal, and Andhra Pradesh) and some adjacent inland states (Jharkhand, Bihar, and eastern Uttar Pradesh) are impacted by more than ten cyclones that produced extreme rainfall events (Fig. 3c ) in last four decades. In contrast, some of the central and western states (Telangana, Maharashtra, Gujarat, and Madhya Pradesh) experienced more than five cyclones causing extreme rainfall events.
Analyzing high-resolution rainfall data (may refer to “Methods”, Fig. 8 ) from 1979 to 2020, a substantial spatial variation is observed in the duration of extreme rainfall events (>18 mm/3 h) associated with cyclones across different states. Eastern coastal states (like Odisha and West Bengal) and Bihar experienced more than 6 h of TC-induced rainfall extreme annually, whereas Maharashtra, Gujarat, and Madhya Pradesh experienced more than an hour of extreme rainfall due to TCs each year.
Concurrent wind–rainfall extreme
The simultaneous wind and rainfall extremes induced by cyclones can compound their individual impact by synergistic effects and have amplified potential hazards to human lives and livelihoods with worsened damage and disruption. To quantify the co-occurrence of wind and rainfall extremes induced by TCs, we defined a binary variable that indicates whether a location experiences both wind speed and rainfall above their respective thresholds at the same time. The average duration of TC-induced concurrent wind–rainfall extremes observed each year from 1979 to 2020 was then estimated for the entire India (Fig. 3d ). Figure 3a shows the number of TCs that caused concurrent wind–rainfall extremes at a location over India during 1979–2020.
We found that Bihar, Jharkhand, and the eastern coastal states witnessed more than ten cyclones causing concurrent wind–rainfall extremes just within the past four decades. Additional regions including Gujarat, Maharashtra, Telangana, Chhattisgarh, eastern parts of Uttar Pradesh, and southern parts of north-east India also observed concurrent wind–rainfall extremes from TCs. Telangana, Maharashtra, Gujarat, and Madhya Pradesh encountered over five TCs inducing concurrent wind–rainfall extremes. In terms of duration, eastern coastal states observe on average more than 4 h of concurrent wind–rainfall extremes per year induced by TCs, while Maharashtra and Gujarat observe more than 1 h of TC-induced concurrent wind–rainfall extremes annually.
We define the concurrence probability at a location for a TC event as the likelihood that it will produce simultaneous wind and rainfall extremes. Figure 4a shows the spatial distribution of this probability for TCs affecting India. This means that a TC hitting any location has a certain chance, given by the concurrence probability, of causing concurrent wind–-rainfall extreme. Gujarat, Maharashtra, Chhattisgarh, Odisha, West Bengal, Bihar, Uttar Pradesh, Tamil Nadu, Meghalaya, Tripura, and Mizoram have a 10–25% probability that a cyclone hitting these states will result in the concurrent wind–rainfall extreme. The return period of a TC event that will induce concurrent extremes is estimated by dividing the mean recurrence interval by the exceedance probability. Figure 4b displays the return period map for TCs causing concurrent extreme for India. Locations that have not experienced any concurrent wind–rainfall extreme in the last four decades are considered very rare and have no assigned return period.

a Probability of TCs causing concurrent extreme at a location over India. The distribution plot shows a fraction of a region across India with a concurrence probability of more than a given value (exceedance probability). b Return Period of TCs causing concurrent extreme. The distribution plot shows the fraction of regions across India with a return period less than a given value (non-exceedance probability) [state name abbreviations: AP Andhra Pradesh, AS Assam, BR Bihar, CG Chhattisgarh, GJ Gujarat, JH Jharkhand, KA Karnataka, KL Kerala, MP Madhya Pradesh, MH Maharashtra, MN Manipur, ML Meghalaya, MZ Mizoram, OR Orissa, RJ Rajasthan, TL Telangana, TN Tamil Nadu, TR Tripura, UP Uttar Pradesh, WB West Bengal].
Odd of extreme rainfall given extreme wind gust
We performed a logistic regression analysis (see “Methods”, Eqs. ( 7 – 8 )) to estimate the odds ratio of extreme rainfall events conditional on extreme wind speeds over India (Fig. 5 ). The results reveal no significant relationship [i.e., log(odd ratio) close to 0] between these variables in regions with very low rainfall [i.e., rainfall climatology < 150 mm/month 48 ]. Moreover, a negative association of extreme rainfall with extreme wind speeds is observed for non-cyclonic days in most parts of India, except for the windward side of the Western Ghats, Eastern Ghats, Dandakaranya, Satpura, and Himalayan mountain ranges. This suggests that orographic lifting by extreme wind events may enhance the occurrence of extreme rainfall in these regions. Surprisingly, on the other hand, the odds of extreme rainfall given extreme wind speeds are strongly positive during TC events over the entire country (Fig. 5b ), except for some high-altitude regions (eastern plateau and south-central highlands) where the association is moderately positive.

a Odd ratio for extreme rainfall given extreme windspeed over India. b Odd ratio for extreme rainfall given extreme wind speed during the cyclonic event over India. The histogram in both subfigures shows the fraction of regions across India with a given value [state name abbreviations: AP Andhra Pradesh, AS Assam, BR Bihar, CG Chhattisgarh, GJ Gujarat, JH Jharkhand, KA Karnataka, KL Kerala, MP Madhya Pradesh, MH Maharashtra, MN Manipur, ML Meghalaya, MZ Mizoram, OR Orissa, RJ Rajasthan, TL Telangana, TN Tamil Nadu, TR Tripura, UP Uttar Pradesh, WB West Bengal].
TC-induced extreme wind and rainfall hazards
We assessed the duration of wind and rainfall extremes associated with TCs as a measure of their hazard severity at different locations 39 , 49 , 50 . A non-parametric kernel density function (Eq. ( 11 ), may also see Supplementary Information) is fitted to the duration data of all TC events and estimated the return period of TC-induced extremes using Eq. ( 9 ). Figure 6 shows the return period of TC-induced concurrent wind–rainfall extremes for various durations. Andhra Pradesh, Odisha, West Bengal, and the Kathiawar peninsula region of Gujarat experience concurrent extremes lasting more than 12 h very frequently i.e., having return periods of less than 3 years (Fig. 6c ). Other regions such as parts of Maharashtra, and Madhya Pradesh, Tamil Nadu, Telangana, Chhattisgarh, Bihar, Jharkhand, Meghalaya, and Tripura also experience frequent concurrent extremes from TCs (i.e., once to thrice in a decade). Krishna–Godavari delta region in Andhra Pradesh is most prone to such concurrent extremes and experiences the most severe ones (more than 2-day-long) every decade (Fig. 6f ). Gujarat coast and eastern coasts of India experience more than 1-day-long concurrent extremes frequently (Fig. 6d ). Figure S7 (in Supplementary Information) shows the duration of TC-induced concurrent wind–rainfall extremes for various return periods (see “Methods”, Eq. ( 10 )). Andhra Pradesh and Odisha experience concurrent extremes lasting more than 24 h once every 5 years (Fig. S7c ). Additionally, the results for individual extremes is available in Supplementary Information, Figs. S5 and S 6 for wind extremes and Figs. S8 and S 9 for rainfall extremes.

The return period of TC-induced concurrent wind–rainfall extremes for various durations of the event a 3 h, b 6 h, c 12 h, d 1 day, e 1.5 days, and f 2 days [state name abbreviations: AP Andhra Pradesh, AS Assam, BR Bihar, CG Chhattisgarh, GJ Gujarat, JH Jharkhand, KA Karnataka, KL Kerala, MP Madhya Pradesh, MH Maharashtra, MN Manipur, ML Meghalaya, MZ Mizoram, OR Orissa, RJ Rajasthan, SK Sikkim, TL Telangana, TN Tamil Nadu, TR Tripura, UP Uttar Pradesh, WB West Bengal].
Seasonal variation for premonsoon and post-monsoon TCs
The number of premonsoon and post-monsoon cyclones that affected any location is shown in Fig. S11 for the entire India. There is a clear shift in the spatial distribution of cyclone-prone regions. Most of the cyclones in pre-monsoon are concentrated in Odisha and West Bengal. However, cyclones in the post-monsoon season affect Andhra Pradesh the most. Post-monsoon cyclones on average affect eastern coastal states including Telangana, Chhattisgarh, Jharkhand, and Bihar more than twice each year. Figure S12 in Supplementary Information shows the number of premonsoon and post-monsoon TCs causing individual wind and rainfall extremes and concurrent wind–rainfall extremes during 1979–2020.
Trivariate conditional return period of cyclonic events
Further, the study focuses on the case of concurrent events lasting for more than 24 h, which have severe societal and environmental consequences. We computed the trivariate conditional probability of such concurrent events (i.e., duration ≥ 24 h) during cyclones, given that both wind and rainfall extremes persist for more than 6 h (see “Methods”, Eq. ( 15 )). We found that the number of cyclones that cause both wind and rainfall extremes for more than 6 h over India [see Supplementary Information, Fig. S10 (a)] is very low in number in the past 42 years (our study period), limiting the reliability of our analysis for the whole country. Therefore, in the present, we have focused on the eastern coastal states, where at least four such extreme cyclones were observed.
We found that more than 20 districts in the eastern coastal states experienced more than ten extreme cyclone events (i.e., both wind and rainfall extremes lasting for more than 6 h) in the past four decades (Fig. 7a ). These districts include Vishakhapatnam and coasts of Krishna to Srikakulam in Andhra Pradesh, Thiruvallur, Chennai, Kancheepuram, Chengalpattu in Tamil Nadu, Koraput, Rayagada, Kandhamal, Ganjam, Puri, Jagatsinghapur, Kendrapara, Bhadrak in Odisha, Purba Medinipur, North 24 Paraganas, South 24 Paraganas, and Nadia in West Bengal. The southern and eastern districts of Odisha and northern Andhra Pradesh are most vulnerable to concurrent extremes associated with TCs (having concurrent extreme duration ≥ 24 h, given both wind and rainfall extreme duration ≥ 6 h) with a return period of less than 2 years (Fig. 7b ).

a Number of extreme cyclone events (i.e., duration of both wind and rainfall extreme more than 6 h) at eastern coastal states of India, and b Conditional return period of cyclonic events (having duration of concurrent extreme ≥ 24 h, given duration of both wind extreme and rainfall extreme ≥ 6 h) for eastern coastal states [state name abbreviations: BR Bihar, JH Jharkhand, WB West Bengal, OD Odisha, AP Andhra Pradesh, TN Tamil Nadu].
This study offers a comprehensive analysis of compound wind–rainfall extremes induced by TCs across India. We employed a high-resolution spatiotemporal approach to examine the co-occurrence of extreme wind and rainfall events associated with TCs. Our findings highlight the critical importance of considering compound hazards in TC risk assessment for improved risk assessment, disaster preparedness, and mitigation strategies in India. Our findings reveal distinct regional vulnerabilities and highlight the importance of incorporating compound hazards into TC risk assessment.
Previous studies have emphasized the individual impacts of extreme wind speed and heavy rainfall associated with TCs 40 , 51 , 52 . However, our research demonstrates a positive association (Fig. 5b ) between these extremes during cyclonic events in India, contrasting with the negative association observed on non-cyclonic days (Fig. 5a ). This unique characteristic underscores the need to move beyond single-hazard assessments and consider the synergistic effects of co-occurring extremes when evaluating TC hazards. Orographic lifting by extreme winds likely plays a significant role in enhancing rainfall, particularly in the Western Ghats, Eastern Ghats, and Himalayan regions (Figs. 5a and S2 ) during non-cyclonic wind. This finding aligns with previous studies on the orographic enhancement 53 of rainfall by extreme winds in mountainous regions. These findings highlight the importance of geographically-specific hazard assessments that account for regional variations in TC impacts.
The spatial patterns we identified align with existing knowledge of TC tracks and orographic influences. Eastern coastal states (Odisha, West Bengal, and Andhra Pradesh) and some inland states (Bihar, Jharkhand, Chhattisgarh, and Telangana) experience the highest frequency and duration of both individual and concurrent wind–rainfall extremes (Figs. 2 and 3 ; Supplementary Information Fig. S7 ). These areas experience frequent cyclones (Fig. 2a ), with wind extremes lasting over 3 h per year (Fig. 3d ) and a high probability of concurrent wind–rainfall extremes (Fig. 4a ). This aligns with an observed concentration of TC activity and associated hazards along the Bay of Bengal coast (Figs. 1 and 2 ). The high-resolution maps generated in this study (Figs. 2 , 3 , 6 , and 7 ) provide valuable insights into the spatial variability of TC-induced extremes across India. Notably, the Krishna–Godavari delta region in Andhra Pradesh state emerges as a hotspot for particularly severe and long-lasting (over 24 h) concurrent extremes (Fig. 6 ). As reported by Tessler et al. 54 , Krishna–Godavari delta is one of the very high-risk deltas. Our high-resolution maps identify such high-risk zones, crucial for prioritizing targeted mitigation efforts, disaster preparedness strategies, and resource allocation.
The return period maps for concurrent wind–rainfall extremes (Fig. 6 ) provide valuable insights for disaster management agencies. Regions like the eastern coasts, Gujarat, and parts of Maharashtra and Madhya Pradesh experience frequent events (return periods less than three years) lasting over 12 h (Fig. 6c ). Additionally, the alarmingly short return periods (less than 2 years) for severe concurrent extremes (>24 h) in specific districts of Andhra Pradesh and Odisha (Fig. 7 ) necessitate localized risk assessments and tailored adaptation plans. These findings emphasize the urgency of developing region-specific adaptation strategies to enhance resilience against these compound hazards and strengthen infrastructure and emergency response systems in these areas. Our high-resolution hazard maps serve as a significant improvement over existing national-level TC hazard atlas 55 , which often lack spatial detail on compound extremes.
Our framework, incorporating a quasi-Lagrangian approach and high-resolution data, provides a more comprehensive and spatially explicit evaluation of compound TC hazards. The methodology and results presented here contribute significantly to current TC risk assessment and management practices in India by providing the following: (1) we present the first high-resolution maps depicting the spatiotemporal patterns of concurrent wind–rainfall extremes across India. These maps serve as crucial resources for policymakers and disaster management agencies to identify vulnerable regions and prioritize mitigation efforts. (2) This study sheds light on the positive association between extreme wind and rainfall during TCs in India. This knowledge is essential for developing comprehensive risk assessments that account for the combined effects of these extremes. (3) The return periods we calculated for concurrent extremes identify high-risk areas and inform the development of targeted mitigation strategies at regional and local levels. (4) Insurance is one of the non-structural measures for disaster management. Our findings on the co-occurrence of wind and rainfall extremes are valuable for insurance companies, as they highlight the interdependence of extremes and their impact on losses. Current models might underestimate risk by not considering the interdependence of these extremes. Our findings emphasize the need for incorporating compound hazards into catastrophe loss models for improved risk assessment and premium calculations in the insurance sector.
The methodology employed in the study (demonstrated for India), including the quasi-Lagrangian approach and statistical analysis, can be adapted to investigate similar compound hazard scenarios in other tropical (or extra-tropical) cyclone-prone regions. Ultimately, this research aims to contribute to a future where communities are more resilient to the impacts of TCs and their complex compound hazards. The results, however, do not consider other types of compounding 19 and are limited to concurrent events, thus, probably missing out on the possible enhanced risk at locations with sequential or spatially compounded extremes. Our results highlight India’s regional heterogeneity to TC-induced wind and rainfall extremes, which have implications for disaster risk management and adaptation planning. Additionally, insurance companies are extremely keen on TC-induced concurrent wind–rainfall extremes since the interdependence of extremes and their impacts must be considered in insurance loss models.
This study provides a novel framework for systematic and comprehensive evaluation of compound hazards from TC-induced extremes for entire India, thereby providing a cyclone hazard map that is essential for targeted national-level cyclone risk mitigation and adaptation planning. The findings highlight the unique positive association between wind and rainfall during cyclones and the spatial variability of hazards from TC-induced wind and rainfall extremes. The high-resolution hazard maps and insights into the spatiotemporal patterns of these events offer valuable resources for policymakers, disaster management agencies, and insurance companies. By informing targeted mitigation strategies and adaptation plans, our work contributes to enhancing India’s resilience against the compound hazards posed by TCs. This novel framework can be readily applied to other tropical (or extra-tropical) cyclone-prone regions to generate national-scale high-resolution compound hazard maps for TCs-induced extremes.
From a mitigation and adaptation viewpoint, future attempts should also be made to incorporate tidal wave and storm surge data for coastal region hazard assessment from TC-induced extremes. Global warming and climate change can alter the dependence among variables contributing to the extremes i.e., dependence may increase or decrease with global warming. Change in the dependence among concerned variables will in turn affect the risk from hydroclimatic extremes. For future projections, a careful examination and comparison of the results from the multi-high-resolution climate model projections is necessary to assess the change in TC-induced compound extremes.
The Indian subcontinent, encompassing a coastline of approximately 7516 km, is highly susceptible to the impacts of TCs and associated hydro-meteorological hazards. India ranks as the seventh most exposed country among 181 nations exposed to climate change risks in the Global Climate Risk Index 2020 56 . Although the NIO basin contributes only 7% of the global TC frequency, its TCs tend to be more intense and damaging than those from other basins 57 . India’s coastal regions are particularly vulnerable to these hazards, due to its extensive, low-lying coastline, shallow continental shelf, and high population density, which elevate the risk of damage from high winds, storm surges, and torrential rainfall.
The analysis is based on the hourly cumulative rainfall and maximum 10m-gust windspeed from the Indian Monsoon Data Assimilation and Analysis dataset, an India-specific very high-resolution (12 km, 1-hourly) regional reanalysis over India for 1979–2020 from the National Centre for Medium-Range Weather Forecast (NCMRWF) ( https://rds.ncmrwf.gov.in/ ) 58 , 59 , 60 , 61 . The data passed quality control and homogeneity tests before release. We defined “maximum wind speed” as the highest hourly gust windspeed (10 m height) in each 3-h interval. The 3-hourly tracks of TCs were extracted from the International Best Track Archive for Climate Stewardship (IBTrACS v.4.0) database provided by the National Oceanic and Atmospheric Administration ( https://www.ncei.noaa.gov/products/international-best-track-archive ) 62 . This study focuses on TCs originating in the Arabian Sea or the Bay of Bengal between 1979 and 2020, excluding those with inadequate wind speed data or durations of less than one day (about 26% or 96 out of 371 TCs). Figure 1 depicts tracks of these TCs over the study area. The dataset comprises 275 TCs, encompassing 11,074 data points over a 42-year span.
Region of cyclonic influence
The impact of TCs is not limited to locations observing direct hit (landfall) by TCs. The study attempts to incorporate both direct and indirect hits from cyclones. As reported in previous studies 51 , 52 , 63 , 64 , 65 , 66 , rainfall events that occurred within a 500 km radius of the TC center are recognized as TC rainfall. This radius aligns with the range of the TC primary wind circulation region (80–400 km radius) and the curved TC cloud shield (550–600 km radius) 67 . However, the rainfall arising with existing troughs/fronts may also be included in the totals 52 . Therefore, a 1000 km × 1000 km square region with a cyclone at its center is considered as the influence range of cyclone events. The square geometry was chosen in the methodology due to its computational efficiency. To ensure the robustness of our TC influence range definition, we conducted sensitivity tests using different choices of radii up to 1000 km, finding that TC rainfall remained relatively insensitive beyond 500 km up to 1000 km (not shown). Figure 8a graphically illustrates the region of cyclone influence for a cyclone at a given time.

a Three-hour cumulative rainfall from TC TITLI (the top example layer shows cyclone TITLI on 11 th October 2018 at 06:00 a.m.). The red contour shows the location of extreme rainfall at a given instant. The black square shows the TC rain field (1000 km × 1000 km) corresponding to the cyclone center (yellow triangle). b Total duration of rainfall extreme for cyclone events. The top example layer is illustrated for cyclone TITLI. c The average duration of TC-induced rainfall extreme observed over India. d Rainfall hazard (duration) of rainfall extreme for 20 years return period over India.
Defining extreme events
Using the peak-over-threshold approach, we define cyclone-induced wind and/or rainfall extreme events as wind or rainfall extremes that occur within a 1000 km square region with a cyclone at its center. We set the gust wind speed threshold at each location (grid) as the maximum of a fixed value of 16 m/s (60 km/h) or the 99.5th percentile of daily maximum gust wind speed during 1979–2020. We choose 16 m/s as the minimum threshold because it is considered damaging 68 and to ensure the threshold represents wind hazard properly. Figure S3 in the Supplementary Information may be referred to for the spatial distribution of the gust wind speed threshold over India. We define gust extremes as maximum 3-hourly gust speeds exceeding the local threshold. Moreover, since the number of rainy days varies a lot across India (may refer to Supplementary Information, Fig. S4 ), using a fixed quantile to define the threshold is not a proper approach. Hence, we define the threshold for rainfall extremes as cumulative rainfall of 18 mm in 3-h duration, following the intensity–duration–frequency curve for Indian monsoon rainfall 69 and the World Meteorological Organization classification for extreme rainfall events (i.e., more than 10 mm/h or 50 mm/day) 70 . Utilizing a quasi-Lagrangian approach, we capture only TC-induced rainfall data at 3-hourly resolution. Following concurrent extreme definitions 3 , concurrent wind–rainfall extremes are defined as simultaneously meeting the conditions of extreme wind speed and extreme rainfall at a given location (grid). Figure 8b graphically illustrates the region of cyclone influence following the quasi-Lagrangian approach for a given cyclone during its entire life. Figure 8 graphically illustrates the methodology used in the study.
Graphical methodology
Duration of tc-induced extremes.
At a particular location, let W ij be the horizontal gust windspeed at time t ij and R ij be the 3-h cumulative rainfall at time t ij , where t ij represents the j th time-step for the i th cyclonic event at a given location. Then the duration of TC-induced extremes for i th cyclone having total m i timesteps can be given by:
Duration of wind extreme for i th cyclonic event,
Duration of rainfall extreme for i th cyclonic event,
Duration of concurrent wind–rainfall extreme for the i th cyclonic event,
where [·] is the Iverson bracket defined as [ S ] equals 1 if the mathematical statement ‘ S ’ is TRUE and 0 otherwise (see Eq. ( 6 )). W thresh and R thresh are thresholds of wind and rainfall extreme, respectively at the location, and τ is the size of one time-step i.e., 3 h.
Average duration of TC-induced extremes
At a particular location, let \({D}_{i}^{{\rm{\chi }}}\) be the duration of TC-induced extremes for the i th cyclonic event, where χ denotes wind or rainfall or concurrent extreme.
The average duration of TC-induced (χ-type) extremes at a location,
Number of cyclonic events causing (χ-type) extremes at a location,
where [·] is the Iverson bracket, n is the total number of cyclonic events, and T is the averaging time or study period i.e., 42 years. The Iverson bracket of a statement is the indicator function of the set of values for which the statement is true. The Iverson bracket allows using capital-sigma notation without summation index (i.e., summation conditioned on any property of summation index) 71 , 72 , 73 . Mathematically, for a statement S , the Iverson bracket is defined as
Logistic regression
We use a logistic regression 74 to NCMRWF reanalysis products to quantify the odds of having an extreme rainfall event given that an extreme wind event has occurred, following the methodology of Martius et al. 13 . The logistic regression models the log-odds of an event as a linear combination of one or more independent variables. In this case, the event is a rainfall extreme and the independent variable is a wind extreme. In regression analysis, logistic regression is estimating the parameters of a logistic model (the coefficients in the linear combination). The logistic model can be used to quantify the odds of having a rainfall extreme at a specific grid point given a wind extreme that occurs:
where the wind( t ) is a binary sequence indicating for each time step if a wind extreme occurred at this specific grid point at the same time.
where p ( t ) = P (rainfall( t ) = 1|wind( t )) is the probability of observing an extreme rainfall event at time t given the wind observations, and p /(1 − p ) is the odds. Here, rainfall( t ) is a binary sequence indicating for each time step if a rainfall extreme occurred at this specific grid point at the same time. The odds ratio exp( β 1 ) can be interpreted as a multiplicative factor that increases (or decreases, if below 1) the odds of observing a rainfall extreme at a specific grid point, given that a wind extreme occurs at this grid point at the same time. We have further tested a regression model that includes a time-lagged predictor variable to account for potential autocorrelation of the extreme rainfall, and the results are in fair consensus. Mahlstein et al. 75 may be referred to for more information on the lagged predictor logistic regression model.
Frequency analysis of duration of TC-induced extremes
Duration of TC-induced extremes is considered as a proxy of impact from cyclonic events at any location. Duration event series at a location is fitted to non-parametric distribution using kernel density estimator 76 , 77 , 78 , 79 and used for frequency analysis.
In the context of univariate variables, the return period of an event with the attribute greater than or equal to a specific threshold is given as follows 80
where X is the attribute of the event and it refers to the duration of TC-induced extremes in Eq. ( 9 ); x denotes an arbitrary value of the attribute; RP( x ) is the return period; \({\mu }_{T}\) is the mean inter-arrival time between two successive events, calculated as a ratio of the total years in data to the number of data points or events 81 ; and F ( x ) = P ( X ≤ x ) is the cumulative distribution function (CDF) of the attribute.
Duration of TC-induced extremes for given return level
Let X is the attribute of the event and x denotes an arbitrary value of the attribute. The kernel inverse function is defined in terms of the kernel cumulative distribution function (CDF) as
where \(G\left(x\right)={\mathop{\int}\limits_{-\infty}^{x}}K\left(t\right){dt}\,\) . Here, K (·) is the kernel smoothing function, t is the arbitrary variable, and h is the bandwidth. The non-exceedance probability p for return level RP (years) can be obtained by \(p\,=\,1\,-\,\frac{{\mu }_{T}}{{\rm{RP}}}\) (refer to Eq. ( 9 )) where µ T is the mean recurrence interval (years). Recurrence Interval equals the number of years on record divided by the number of events 81 .
Trivariate conditional probability
Let random variables X , Y , and Z be the attributes of the event, and x , y , and z denote an arbitrary value of the attributes respectively. The conditional return period of x |( Y ⩽ y , Z ⩽ z ) is expressed as 82
and \({F}_{X,Y,Z}\left(x,y,z\right)\,=\,P(X\,\le\,x,\;{Y}\,\le\,y,\;{Z}\,\le\,z)\) is the joint CDF of random variables X , Y , and Z .
Empirical probability using plotting position (Gringorten’s approach)
A number of data points available for study is not enough to fit trivariate distributions, therefore empirical approach is taken for estimating the non-exceedance probability. Gringorten’s plotting position formula is optimized for extreme value distribution (Gumbel distribution). Empirical non-exceedance probability using the plotting-position formula as discussed in Gringorten’s approach 83 and is expressed as:
where P k is the cumulative frequency, the probability that a given value is less than the k th smallest observation in the data set of N observations. K is the k th smallest observation in the data set arranged in ascending order.
For example, in this study, a particular conditional trivariate non-exceedance probability of cyclonic events having a duration of concurrent extreme more than 24 h, given the durations of both wind extreme and rainfall extremes are more than 6 h, can be given by
where [·] is the Iverson bracket defined as [ S ] equals 1 if the mathematical statement “ S ” is TRUE and 0 otherwise (see Eq. ( 6 )) and \({D}_{i}^{\chi }\) is the duration of TC-induced extremes for the i th cyclonic event.
Data availability
No datasets were generated or analyzed during the current study.
Code availability
The codes that support the findings of this study are available from the corresponding author on request.
Mazdiyasni, O. & AghaKouchak, A. Substantial increase in concurrent droughts and heatwaves in the United States. Proc. Natl. Acad. Sci. USA 112 , 11484–11489 (2015).
Article CAS Google Scholar
Raymond, C., Matthews, T. & Horton, R. M. The emergence of heat and humidity too severe for human tolerance. Sci. Adv. 6 , eaaw1838 (2020).
Article Google Scholar
Zscheischler, J. et al. Future climate risk from compound events. Nat. Clim. Change 8 , 469–477 (2018).
Messori, G. et al. Compound climate events and extremes in the midlatitudes: dynamics, simulation, and statistical characterization. Bull. Am. Meteorol. Soc. 102 , E774–E781 (2021).
AghaKouchak, A. et al. How do natural hazards cascade to cause disasters? Nature 561 , 458–460 (2018).
Otto, C., Piontek, F., Kalkuhl, M. & Frieler, K. Event-based models to understand the scale of the impact of extremes. Nat. Energy 5 , 111–114 (2020).
Xu, P. et al. Dynamic identification and risk analysis of compound dry-hot events considering nonstationarity. J. Hydrol. 616 , 128852 (2023).
De Luca, P., Messori, G., Faranda, D., Ward, P. J. & Coumou, D. Compound warm–dry and cold–wet events over the Mediterranean. Earth Syst. Dyn. 11 , 793–805 (2020).
Hao, Z., Hao, F., Xia, Y., Singh, V. P. & Zhang, X. A monitoring and prediction system for compound dry and hot events. Environ. Res. Lett. 14 , 114034 (2019).
Wu, X., Hao, Z., Hao, F., Singh, V. P. & Zhang, X. Dry-hot magnitude index: a joint indicator for compound event analysis. Environ. Res. Lett. 14 , 064017 (2019).
Bevacqua, E. et al. Higher probability of compound flooding from precipitation and storm surge in Europe under anthropogenic climate change. Sci. Adv. 5 , eaaw5531 (2019).
Hao, Z. & Singh, V. P. Compound events under global warming: a dependence perspective. J. Hydrol. Eng. 25 , 03120001 (2020).
Martius, O., Pfahl, S. & Chevalier, C. A global quantification of compound precipitation and wind extremes. Geophys. Res. Lett. 43 , 7709–7717 (2016).
Wu, J. et al. Increasing risk from landfalling tropical cyclone-heatwave compound events to coastal and inland China. Environ. Res. Lett. 17 , 105007 (2022).
Feng, K., Ouyang, M. & Lin, N. Tropical cyclone-blackout-heatwave compound hazard resilience in a changing climate. Nat. Commun. 13 , 4421 (2022).
Zhang, W. & Villarini, G. Deadly compound heat stress-flooding hazard across the central United States. Geophys. Res. Lett. 47 , e2020GL089185 (2020).
Ribeiro, A. F. S. et al. A compound event-oriented framework to tropical fire risk assessment in a changing climate. Environ. Res. Lett. 17 , 065015 (2022).
Sadegh, M. et al. Multihazard scenarios for analysis of compound extreme events. Geophys. Res. Lett. 45 , 5470–5480 (2018).
Zscheischler, J. et al. A typology of compound weather and climate events. Nat. Rev. Earth Environ. 1 , 333–347 (2020).
Messmer, M. & Simmonds, I. Global analysis of cyclone-induced compound precipitation and wind extreme events. Weather Clim. Extrem. 32 , 100324 (2021).
Seneviratne, S. I. et al. Weather and climate extreme events in a changing climate. In Climate Change 2021: the Physical Science Basis. Contribution of Working Group I to the Sixth Assessment Report of the Intergovernmental Panel on Climate Change (eds. Masson-Delmotte, V. et al.) 1513–1766 (Cambridge, New York, 2021).
Murakami, H., Vecchi, G. A. & Underwood, S. Increasing frequency of extremely severe cyclonic storms over the Arabian Sea. Nat. Clim. Change 7 , 885–889 (2017).
Murakami, H. & Wang, B. Patterns and frequency of projected future tropical cyclone genesis are governed by dynamic effects. Commun. Earth Environ. 3 , 1–10 (2022).
Priya, S. & Goyal, P. K. Wind hazards on the indian power system and challenges for the future: a review. In Proc. 2nd International Symposium on Disaster Resilience and Sustainable Development: Volume 2—Disaster Risk Science and Technology (eds. Pal, I. et al.) 29–44 (Springer Nature, Singapore, 2023) https://doi.org/10.1007/978-981-19-6297-4_3 .
Do, C. & Kuleshov, Y. Multi-hazard tropical cyclone risk assessment for Australia. Remote Sens. 15 , 795 (2023).
Malakar, K., Mishra, T., Hari, V. & Karmakar, S. Risk mapping of Indian coastal districts using IPCC-AR5 framework and multi-attribute decision-making approach. J. Environ. Manage. 294 , 112948 (2021).
Croitoru, A.-E., Chiotoroiu, B.-C., Ivanova Todorova, V. & Torică, V. Changes in precipitation extremes on the Black Sea western coast. Global Planet. Change 102 , 10–19 (2013).
Islek, F., Yuksel, Y. & Sahin, C. Spatiotemporal long-term trends of extreme wind characteristics over the Black Sea. Dyn. Atmos. Oceans 90 , 101132 (2020).
Jiang, Y., Luo, Y. & Zhao, Z. Maximum wind speed changes over China. Acta Meteorol. Sin. 27 , 63–74 (2013).
Ma, Q., Zhang, J., Game, A. T., Chang, Y. & Li, S. Spatiotemporal variability of summer precipitation and precipitation extremes and associated large-scale mechanisms in Central Asia during 1979–2018. J. Hydrol. X 8 , 100061 (2020).
Google Scholar
Wang, G., Zhang, Q., Yu, H., Shen, Z. & Sun, P. Double increase in precipitation extremes across China in a 1.5 °C/2.0 °C warmer climate. Sci. Total Environ. 746 , 140807 (2020).
Yu, L. & Zhong, S. Strong wind speed events over Antarctica and its surrounding oceans. J. Clim. 32 , 3451–3470 (2019).
Bevacqua, E., Maraun, D., Hobæk Haff, I., Widmann, M. & Vrac, M. Multivariate statistical modelling of compound events via pair-copula constructions: analysis of floods in Ravenna (Italy). Hydrol. Earth Syst. Sci. 21 , 2701–2723 (2017).
Moftakhari, H. R., Salvadori, G., AghaKouchak, A., Sanders, B. F. & Matthew, R. A. Compounding effects of sea level rise and fluvial flooding. Proc. Natl. Acad. Sci. USA 114 , 9785–9790 (2017).
Field, C. B. (ed) Managing the Risks of Extreme Events and Disasters to Advance Climate Change Adaptation: Special Report of the Intergovernmental Panel on Climate Change (Cambridge University Press, 2012).
Bakkensen, L. A., Park, D.-S. R. & Sarkar, R. S. R. Climate costs of tropical cyclone losses also depend on rain. Environ. Res. Lett. 13 , 074034 (2018).
Ye, Y. & Fang, W. Estimation of the compound hazard severity of tropical cyclones over coastal China during 1949–2011 with copula function. Nat. Hazard. 93 , 887–903 (2018).
Zhang, Y., Sun, X. & Chen, C. Characteristics of concurrent precipitation and wind speed extremes in China. Weather Clim. Extremes 32 , 100322 (2021).
Li, D. et al. Compound wind and precipitation extremes across the Indo-Pacific: climatology, variability, and drivers. Geophys. Res. Lett. 49 , e2022GL098594 (2022).
Sharma, U. & Patwardhan, A. Methodology for identifying vulnerability hotspots to tropical cyclone hazard in India. Mitig. Adapt. Strateg. Glob. Change 13 , 703–717 (2008).
Mohapatra, M., Mandal, G. S., Bandyopadhyay, B. K., Tyagi, A. & Mohanty, U. C. Classification of cyclone hazard prone districts of India. Nat. Hazards 63 , 1601–1620 (2012).
Bandyopadhyay, S., Dasgupta, S., Khan, Z. H. & Wheeler, D. Spatiotemporal analysis of tropical cyclone landfalls in northern Bay of Bengal, India and Bangladesh. Asia-Pac. J. Atmos. Sci. 57 , 799–815 (2021).
Guntu, R. K., Merz, B. & Agarwal, A. Increased likelihood of compound dry and hot extremes in India. Atmos. Res. 290 , 106789 (2023).
Rajeev, A. & Mishra, V. Observational evidence of increasing compound tropical cyclone-moist heat extremes in India. Earth’s Future 10 , e2022EF002992 (2022).
Rajeev, A. & Mishra, V. Increasing risk of compound wind and precipitation extremes due to tropical cyclones in India. Environ. Res. Clim. 2 , 021004 (2023).
Patankar, A. Impacts of Natural Disasters on Households and Small Businesses in India . https://www.adb.org/publications/natural-disasters-households-small-businesses-india (2019) https://doi.org/10.22617/WPS190617-2 .
Attri, S. D. & Chug, S. (eds) Annual Report 2020 (India Meteorological Department, 2020).
Hrudya, P. H., Varikoden, H. & Vishnu, R. A review on the Indian summer monsoon rainfall, variability and its association with ENSO and IOD. Meteorol. Atmos. Phys. 133 , 1–14 (2021).
Tejada, A. T., Sanchez, P. A. J., Faderogao, F. J. F., Gigantone, C. B. & Luyun, R. A. Spatiotemporal analysis of extreme rainfall and meteorological drought events over the Angat Watershed, Philippines. Atmosphere 14 , 1790 (2023).
Ashok Kumar, K. et al. Extreme rainfall analysis for development of rainfall intensity duration frequency curves for semiarid region of Andhra Pradesh in India. Natl. Acad. Sci. Lett . https://doi.org/10.1007/s40009-023-01360-6 (2023).
Chen, F. & Fu, Y. Contribution of tropical cyclone rainfall at categories to total precipitation over the western north Pacific from 1998 to 2007. Sci. China Earth Sci. 58 , 2015–2025 (2015).
Prat, O. P. & Nelson, B. R. Precipitation contribution of tropical cyclones in the southeastern United States from 1998 to 2009 using TRMM satellite data. J. Clim. 26 , 1047–1062 (2013).
Rossi, M. W., Anderson, R. S., Anderson, S. P. & Tucker, G. E. Orographic controls on subdaily rainfall statistics and flood frequency in the Colorado front range, USA. Geophys. Res. Lett. 47 , e2019GL085086 (2020).
Tessler, Z. D. et al. Profiling risk and sustainability in coastal deltas of the world. Science 349 , 638–643 (2015).
Hazard Atlas of India. https://imdpune.gov.in/hazardatlas/cyclonenew_p1961_2020.html .
Eckstein, D., Künzel, V., Schäfer, L. & Winges, M. Global climate risk index 2020. Bonn Ger 1 , 50 (2019).
Vellore, R. K. et al. Extreme Storms. in Assessment of Climate Change over the Indian Region: A Report of the Ministry of Earth Sciences (MoES), Government of India (eds. Krishnan, R. et al.) 155–173 (Springer, Singapore, 2020) https://doi.org/10.1007/978-981-15-4327-2_8 .
Mahmood, S. et al. Indian monsoon data assimilation and analysis regional reanalysis: configuration and performance. Atmos. Sci. Lett. 19 , e808 (2018).
Ashrit, R. et al. IMDAA regional reanalysis: performance evaluation during Indian summer monsoon season. J. Geophys. Res. Atmos. 125 , e2019JD030973 (2020).
Kumar, S. & Ashrit, R. NCMRWF Data Product for Offshore Wind Energy Applications. in International Conference on Ensemble Methods in Modelling and Data Assimilation (EMMDA) (NOIDA, India, 2020).
Singh, T., Saha, U., Prasad, V. S. & Gupta, M. D. Assessment of newly-developed high resolution reanalyses (IMDAA, NGFS and ERA5) against rainfall observations for Indian region. Atmospheric Res 259 , 105679 (2021).
Knapp, K. R., Diamond, H. J., Kossin, J. P., Kruk, M. C. & Schreck, C. J. International best track archive for climate stewardship (IBTrACS) project, version 4. NOAA National Centers for Environmental Information https://doi.org/10.25921/82ty-9e16 (2018).
Hernández Ayala, J. J. & Matyas, C. J. Spatial distribution of tropical cyclone rainfall and its contribution to the climatology of Puerto Rico. Phys. Geogr. 39 , 1–20 (2018).
Dare, R. A., Davidson, N. E. & McBride, J. L. Tropical cyclone contribution to rainfall over Australia. Mon. Weather Rev. 140 , 3606–3619 (2012).
Lau, K.-M., Zhou, Y. P. & Wu, H.-T. Have tropical cyclones been feeding more extreme rainfall? J. Geophys. Res. Atmos. https://doi.org/10.1029/2008JD009963 (2008).
Nogueira, R. C. & Keim, B. D. Contributions of Atlantic tropical cyclones to monthly and seasonal rainfall in the eastern United States 1960–2007. Theor. Appl. Climatol. 103 , 213–227 (2011).
Englehart, P. J. & Douglas, A. V. The role of eastern North Pacific tropical storms in the rainfall climatology of western Mexico. Int. J. Climatol. 21 , 1357–1370 (2001).
Jackson, P. S. The evaluation of windy environments. Build. Environ. 13 , 251–260 (1978).
Das, A., Srivastava, P. & Yadav, B. Isopluvial analysis and intensity duration frequency (IDF) curves for different cities in India. MAUSAM 73 , 887–898 (2022).
Organization (WMO). Guide to Instruments and Methods of Observation. https://library.wmo.int/records/item/68695-guide-to-instruments-and-methods-of-observation .
Iverson, K. E. (ed) Representation of Variables. Programming Language (Wiley, 1962).
Graham, R. L., Knuth, D. E., Patashnik, O. & Liu, S. Concrete mathematics: a foundation for computer science. Comput. Phys. 3 , 106–107 (1989).
Knuth, D. E. (ed) Two Notes on Notation (The American Mathematical Monthly, 1992).
Agresti, A. (ed) Categorical Data Analysis (John Wiley & Sons, 2012).
Mahlstein, I., Martius, O., Chevalier, C. & Ginsbourger, D. Changes in the odds of extreme events in the Atlantic basin depending on the position of the extratropical jet. Geophys. Res. Lett . https://doi.org/10.1029/2012GL053993 (2012).
Bowman, A. W. & Azzalini, A. (eds) Applied Smoothing Techniques for Data Analysis: The Kernel Approach with S-Plus Illustrations (OUP Oxford, 1997).
Adamowski, K., Liang, G.-C. & Patry, G. G. Annual maxima and partial duration flood series analysis by parametric and non-parametric methods. Hydrol. Process. 12 , 1685–1699 (1998).
Silverman, B. W. (ed) Density Estimation for Statistics and Data Analysis (CRC Press, 1986).
Vittal, H., Singh, J., Kumar, P. & Karmakar, S. A framework for multivariate data-based at-site flood frequency analysis: essentiality of the conjugal application of parametric and nonparametric approaches. J. Hydrol. 525 , 658–675 (2015).
Gumbel, E. J. The return period of flood flows. Ann. Math. Stat. 12 , 163–190 (1941).
ASCE. Hydrology Handbook (American Society of Civil Engineers, 1996).
Yue, S. & Rasmussen, P. Bivariate frequency analysis: discussion of some useful concepts in hydrological application. Hydrol. Process. 16 , 2881–2898 (2002).
Gringorten, I. I. A plotting rule for extreme probability paper. J. Geophys. Res. 1896-1977 68 , 813–814 (1963).
Download references
Acknowledgements
This work is supported by the Department of Science & Technology (SPLICE – Climate Change Programme), GoI, Project reference number DST/CCP/CoE/140/2018; Project under GISE hub, reference number RD/0121-DST0000-011; and the Industrial Research & Consultancy Centre (IRCC) Award grant, IIT Bombay, Project reference number RI/0221-10000963-001. The funding bodies had no role in study design, data collection, or analysis. The authors sincerely thank the editorial board and anonymous reviewers for their constructive suggestions which helped us to improve the manuscript.
Author information
Authors and affiliations.
Environmental Science and Engineering Department, Indian Institute of Technology Bombay, Mumbai, India
Ravi Ranjan & Subhankar Karmakar
Interdisciplinary Programme in Climate Studies, Indian Institute of Technology Bombay, Mumbai, India
Subhankar Karmakar
Centre for Urban Science and Engineering, Indian Institute of Technology Bombay, Mumbai, India
You can also search for this author in PubMed Google Scholar
Contributions
R.R. and S.K. designed the problem. R.R. performed the analysis. R.R. prepared the figures with input from S.K. R.R. wrote the manuscript with inputs from S.K.
Corresponding author
Correspondence to Subhankar Karmakar .
Ethics declarations
Competing interests.
The authors declare no competing interests.
Additional information
Publisher’s note Springer Nature remains neutral with regard to jurisdictional claims in published maps and institutional affiliations.
Supplementary information
Rights and permissions.
Open Access This article is licensed under a Creative Commons Attribution 4.0 International License, which permits use, sharing, adaptation, distribution and reproduction in any medium or format, as long as you give appropriate credit to the original author(s) and the source, provide a link to the Creative Commons licence, and indicate if changes were made. The images or other third party material in this article are included in the article’s Creative Commons licence, unless indicated otherwise in a credit line to the material. If material is not included in the article’s Creative Commons licence and your intended use is not permitted by statutory regulation or exceeds the permitted use, you will need to obtain permission directly from the copyright holder. To view a copy of this licence, visit http://creativecommons.org/licenses/by/4.0/ .
Reprints and permissions
About this article
Cite this article.
Ranjan, R., Karmakar, S. Compound hazard mapping for tropical cyclone-induced concurrent wind and rainfall extremes over India. npj Nat. Hazards 1 , 15 (2024). https://doi.org/10.1038/s44304-024-00013-y
Download citation
Received : 02 January 2024
Accepted : 20 April 2024
Published : 01 July 2024
DOI : https://doi.org/10.1038/s44304-024-00013-y
Share this article
Anyone you share the following link with will be able to read this content:
Sorry, a shareable link is not currently available for this article.
Provided by the Springer Nature SharedIt content-sharing initiative
Quick links
- Explore articles by subject
- Guide to authors
- Editorial policies
Sign up for the Nature Briefing newsletter — what matters in science, free to your inbox daily.


Members of the public and military personnel search for survivors and bodies in Ngangu township Chimanimani in eastern Zimbabwe, after Cyclone Idai.
- ENVIRONMENT
Why Cyclone Idai was so destructive
The storm that battered Mozambique and its neighbors in Africa followed a winding path.
Cyclone Idai may have killed more than 1,000 people and left 400,000 homeless near the port city of Beira in the southeastern African nation of Mozambique. It may be the worst weather-related disaster ever to hit the southern hemisphere, with 1.7 million people in the path of the cyclone in Mozambique and 920,000 affected in neighboring Malawi, U.N. officials told the BBC on Tuesday.
“The scale of suffering and loss is still not clear, and we expect that the number of people affected as well as the number of people who have lost their lives may rise,” said Jamie LeSueur of the International Federation of Red Cross and Red Crescent Societies (IFRC) in a statement .
Idai made landfall on March 15 with winds up to 100 miles an hour and a storm surge topping 20 feet. Heavy rains accompanied the storm and have continued with six more inches forecast for today, March 19, and not expected to end until March 21, according to the Mozambique National Meteorology Institute forecast .
Flooding is widespread throughout central Mozambique, with roads and bridges washed out, said Gregory Carr, president of the Gorongosa National Park , an area roughly the size of Rhode Island that is located 100 miles inland from Beira. “We’re right in the middle of the impacted area,” Carr said.
The protective power of parks
“I’ve been on the phone all morning trying to arrange for U.S. food aid to be helicoptered to our airstrip so we can distribute it to neighboring communities,” Carr said.
At Gorongosa, the stated purpose of the park is to both protect wildlife and meet the needs of nearby communities by providing employment, health care, education, and other services, Carr noted. Now they’re doing disaster relief. “The roads are out but our 260 rangers are great walkers,” Carr said.
Some of the park’s 260 rangers are waste deep in water delivering supplies to people stranded on termite mounds, one patrol leader told Carr today. They plan to return with canoes to rescue them.
About half of the park is underwater, but Carr expects minimal impact on animals as they will likely move to higher ground. However, a flooded park means there’s less water to flood local communities. In fact, flood prevention is one of the big benefits of national parks, forests, and natural areas, he said. During droughts, parks and forests are often sources of water and cooling for local regions. “We need wilderness to moderate the impacts of extreme weather events from climate change,” said Carr.
A big u-turn
Mozambique averages about 1.5 tropical cyclones a year and, although rarely more powerful than Category 2, they can cause a lot of damage, said Corene Matyas, a tropical cyclone researcher at the University of Florida.
Flooding is the main problem affecting most people from the storms. With climate change the atmosphere now holds more moisture (because it’s warmer, on average), and that means there may be more water available for heavy rainfalls, Matyas said.
Cyclone Idai also had a loopy lifespan. It was born March 4th just off the coast in the very warm waters of the Mozambique Channel—a 250 mile-wide arm of the Indian Ocean between Mozambique and the island of Madagascar. Idai came ashore as a weak tropical storm in northern Mozambique and then wandered back out into the channel before doing a u-turn off the western coast of Madagascar March 11. It then made a beeline for its landfall at the city of Beira on the 15th.
“That kind of looping, unpredictable storm track isn’t uncommon for cyclones that start in the channel,” Matyas said.
The ongoing flooding in central Mozambique likely means that the major food-producing region of the north is cut off from the heavily populated south, where the capital city of Maputo is located, she said.
Most tropical cyclone activity in the southwest Indian Ocean occurs between October and May, with activity peaking in mid-January and again in mid-February to early March. Idai is the seventh intense tropical cyclone of the basin’s 2018-2019 season, according to NASA .
Related Topics
- NATIONAL PARKS
You May Also Like
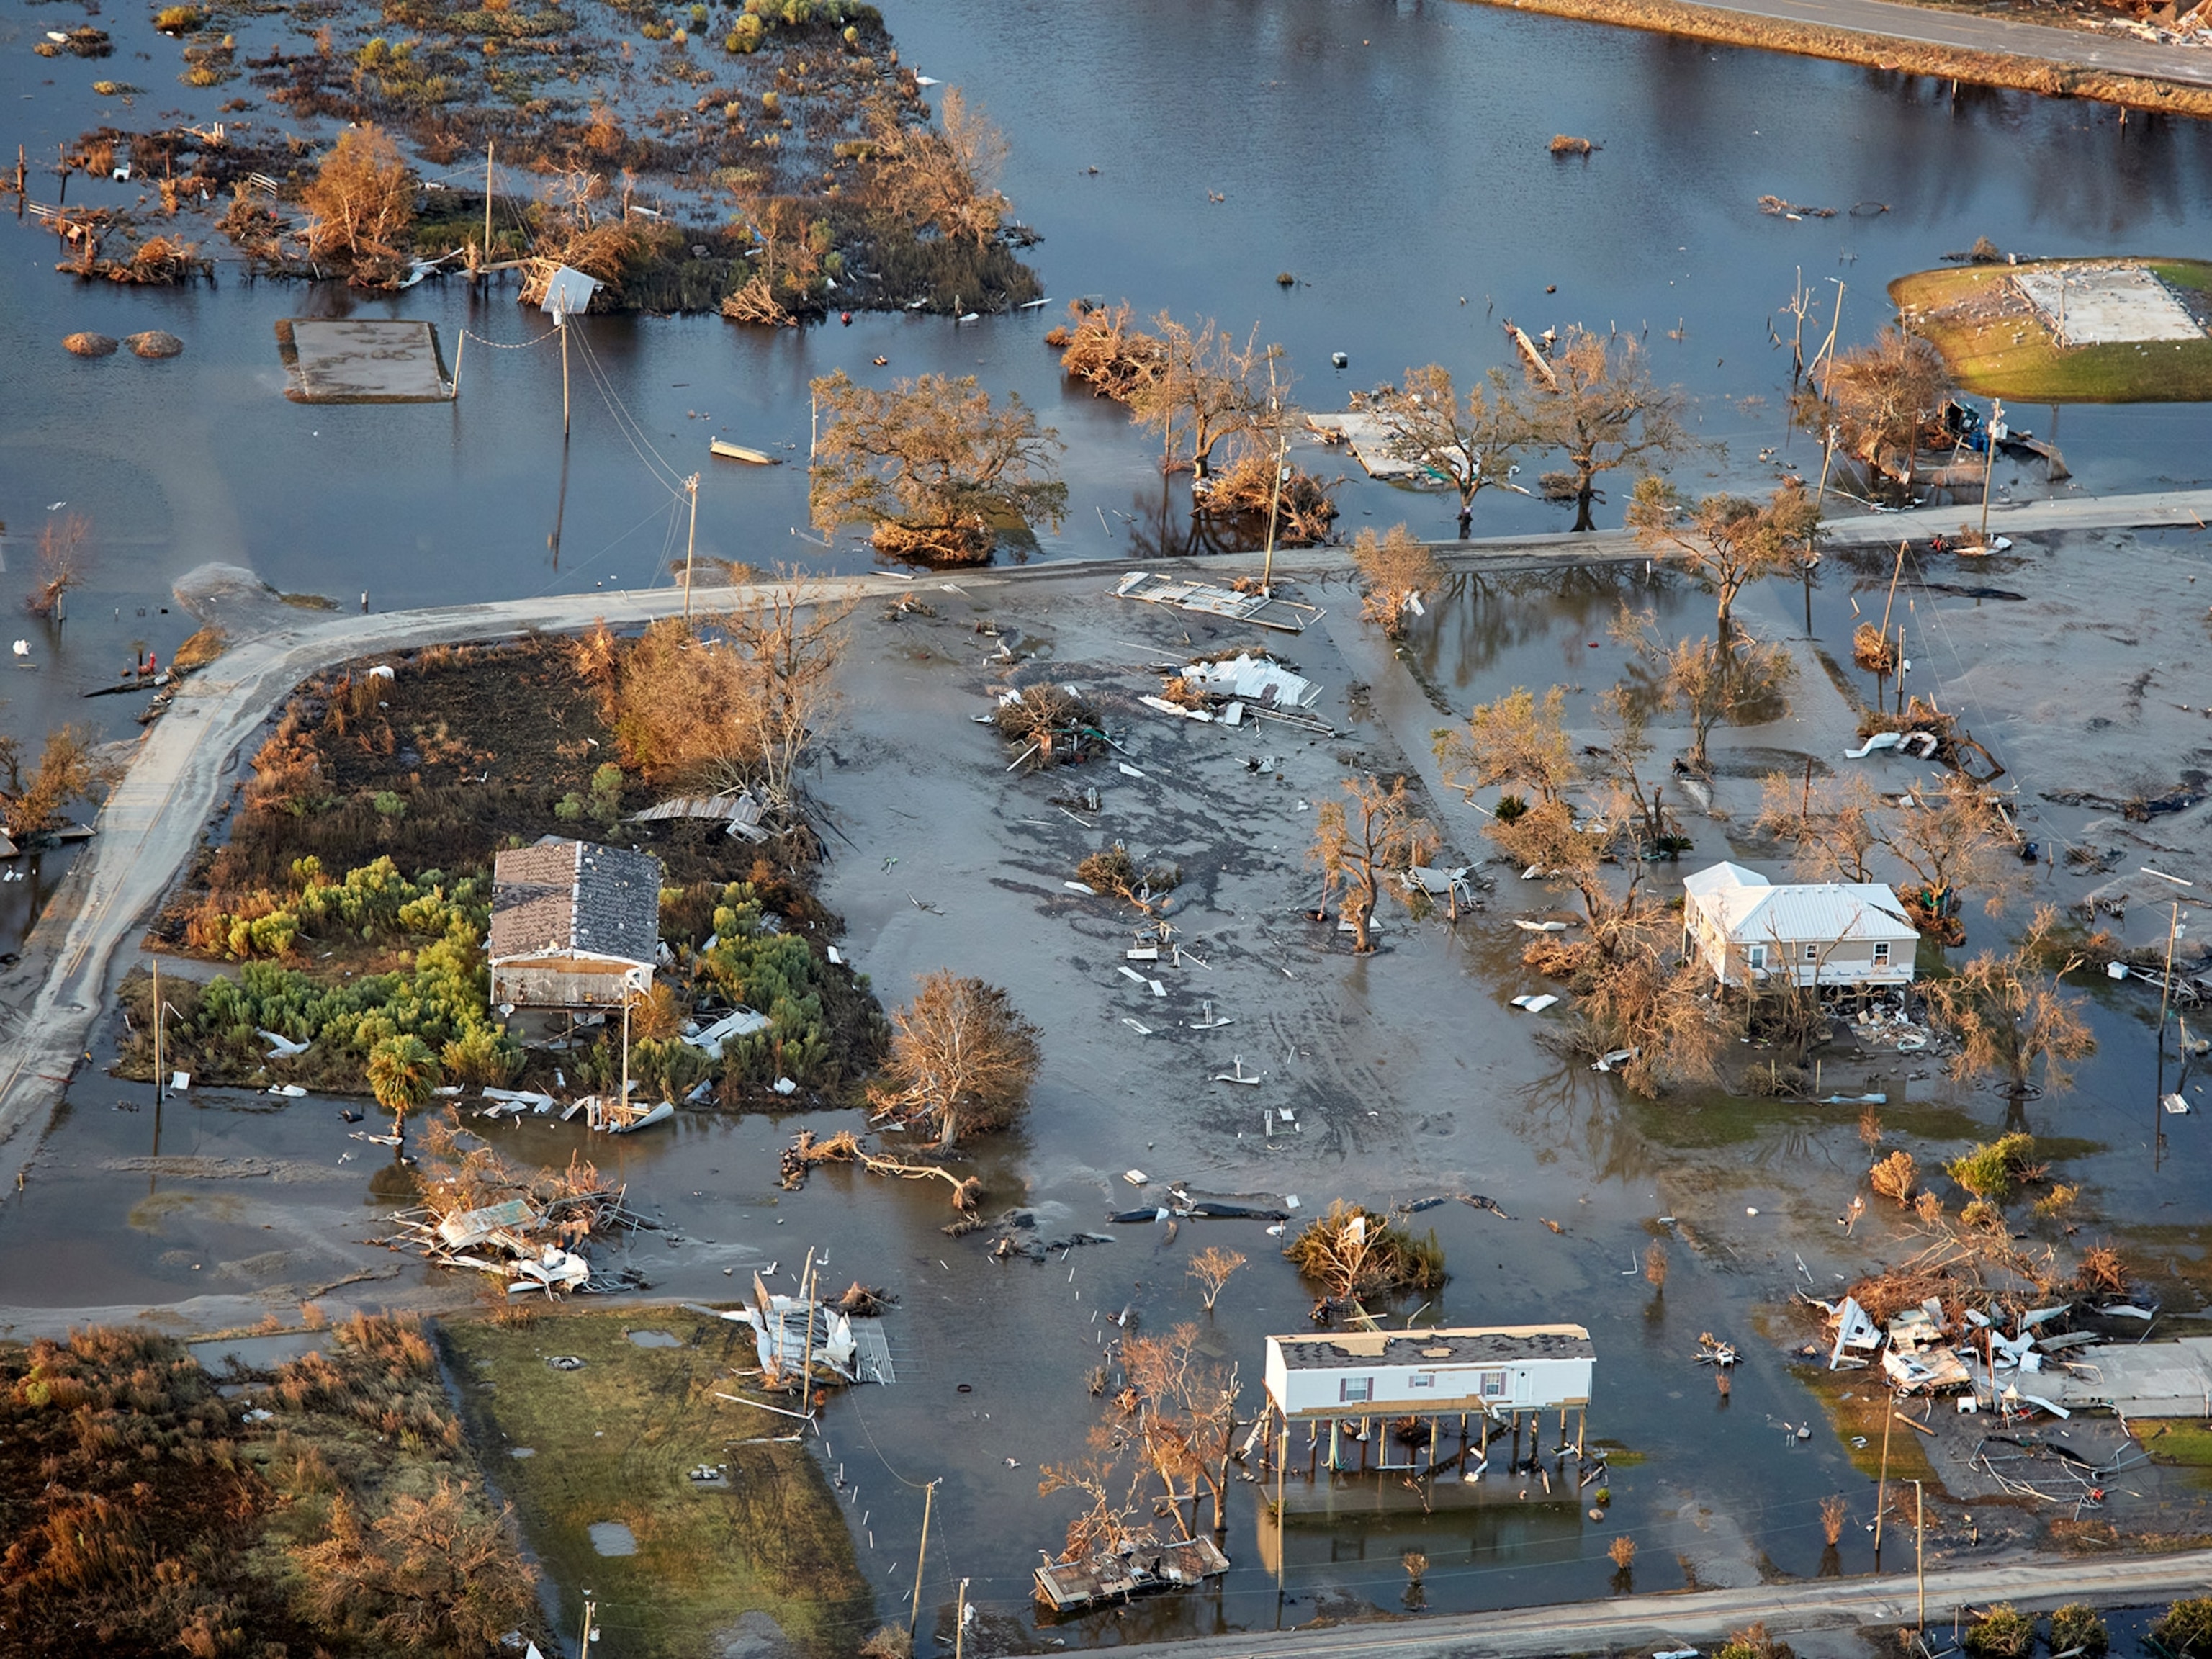
What are hurricanes, typhoons, and cyclones?
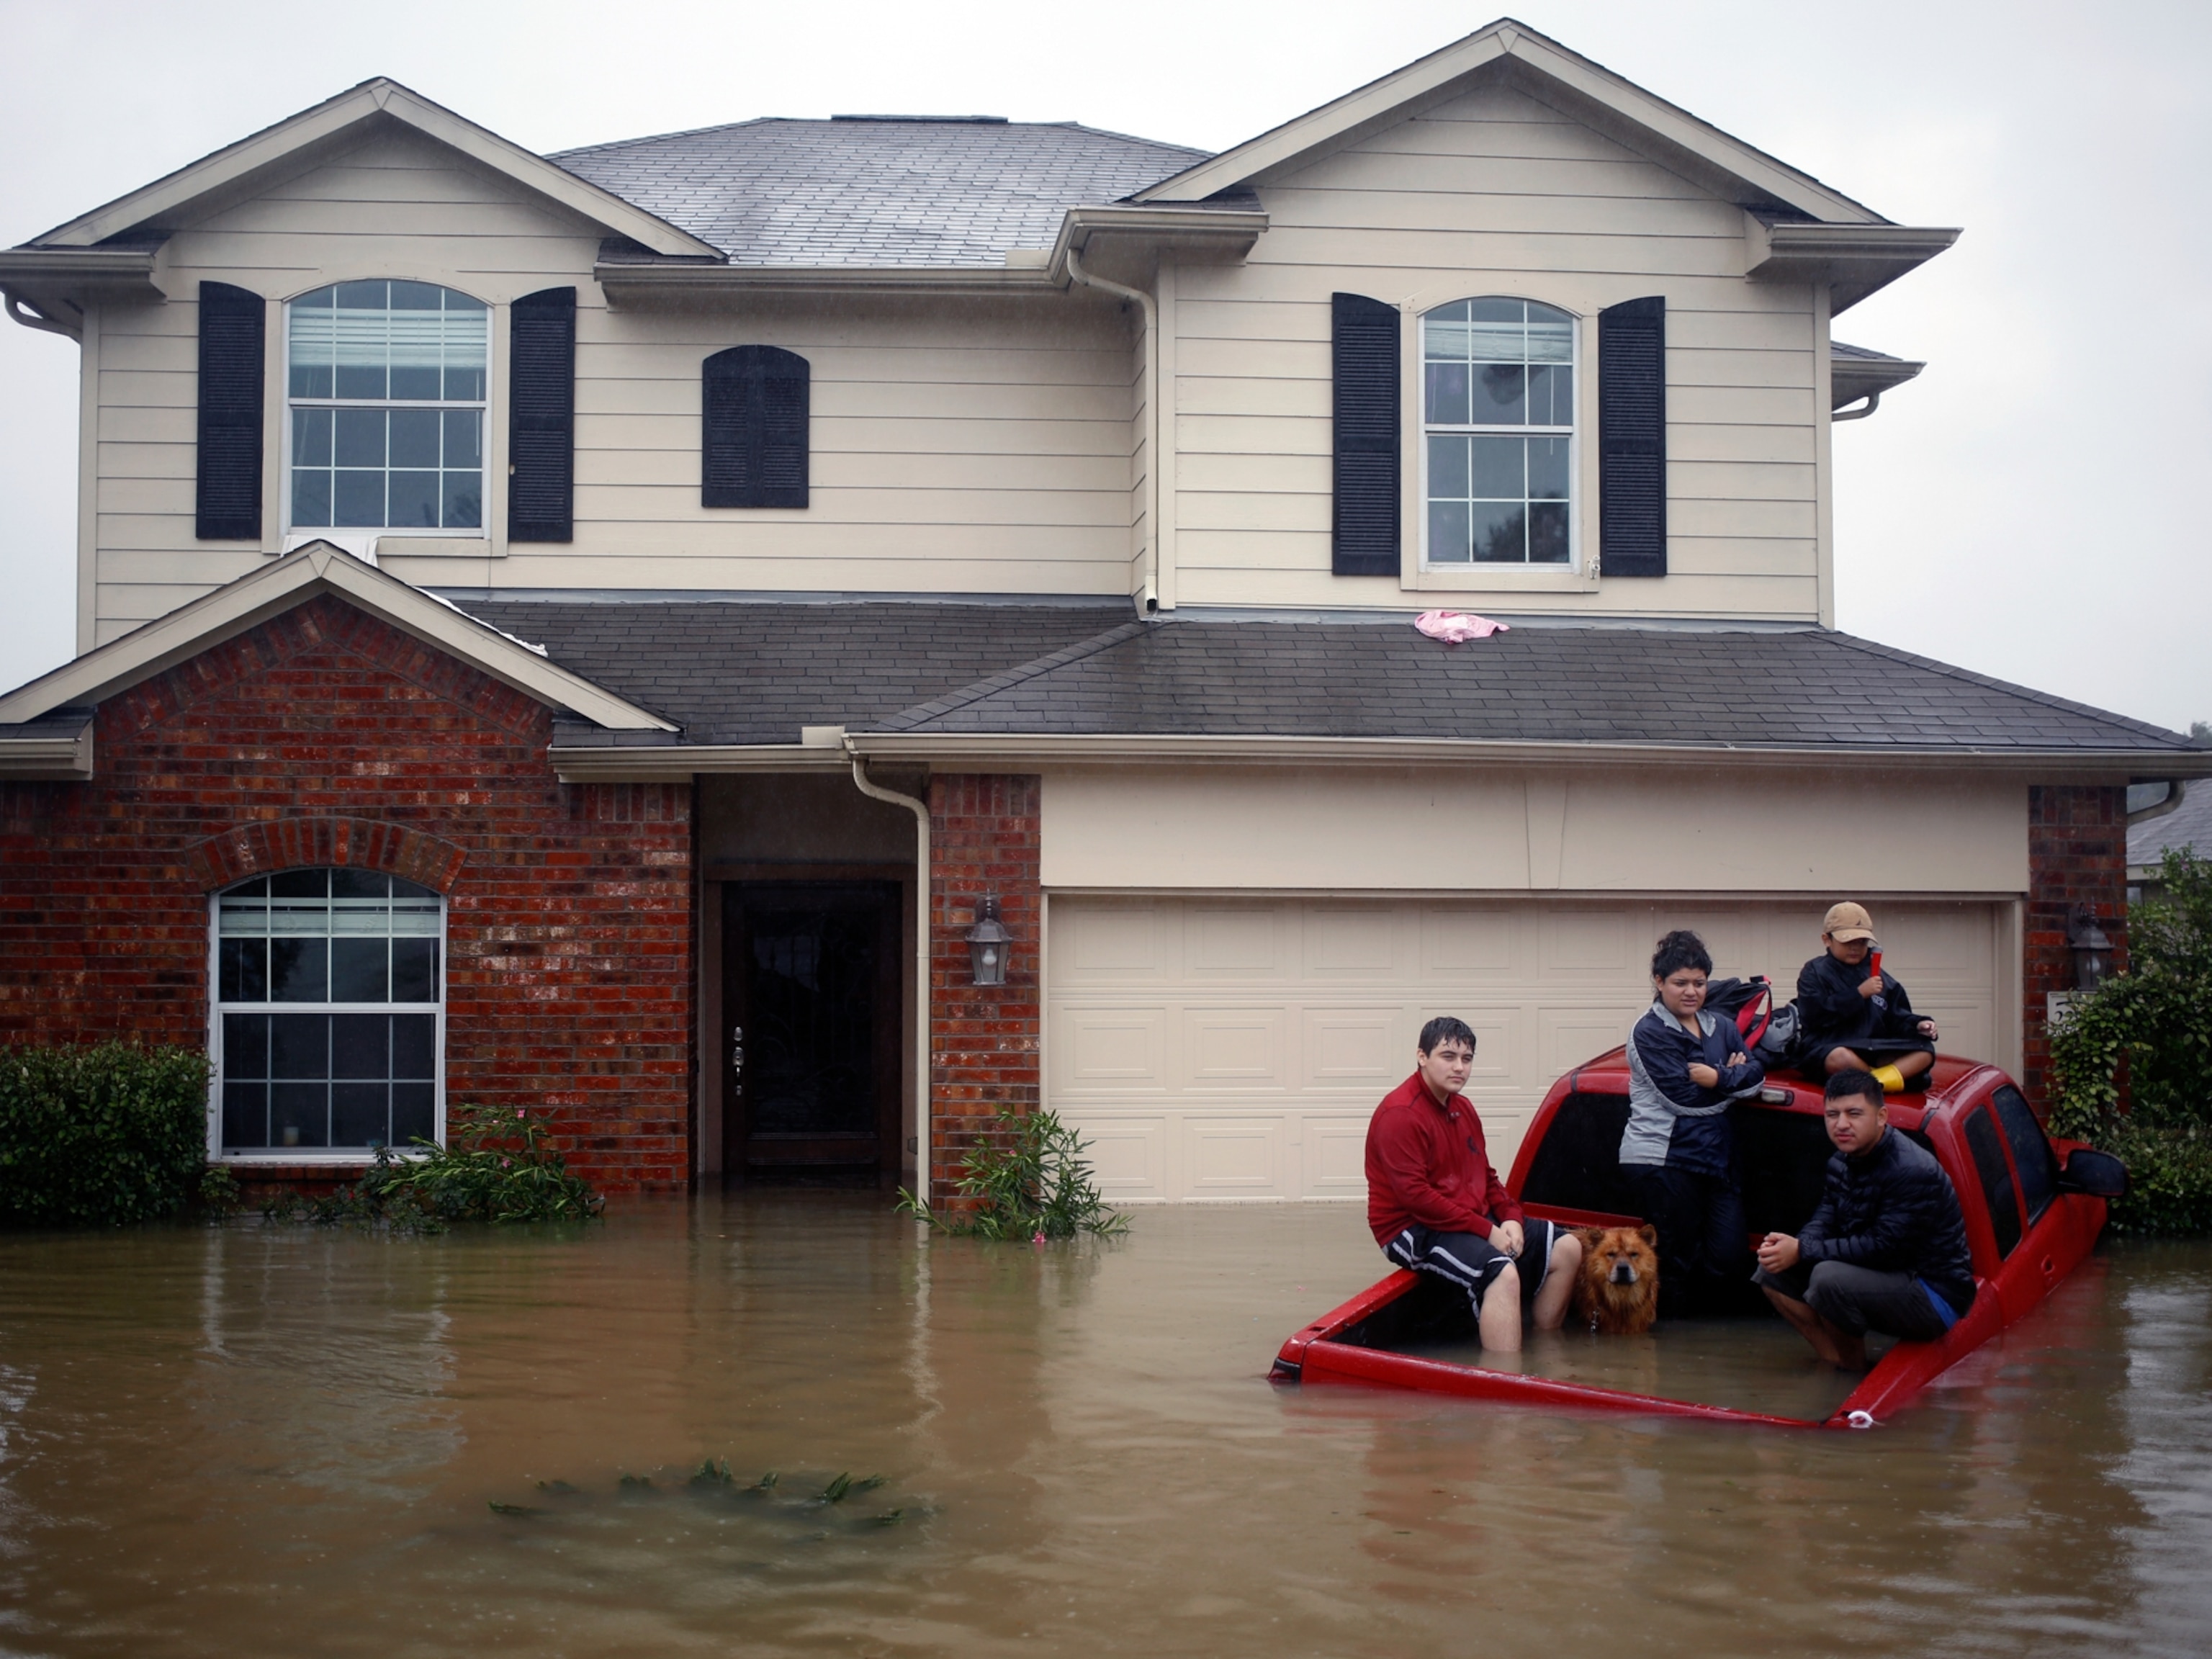
The link between extreme weather and climate change has never been more clear
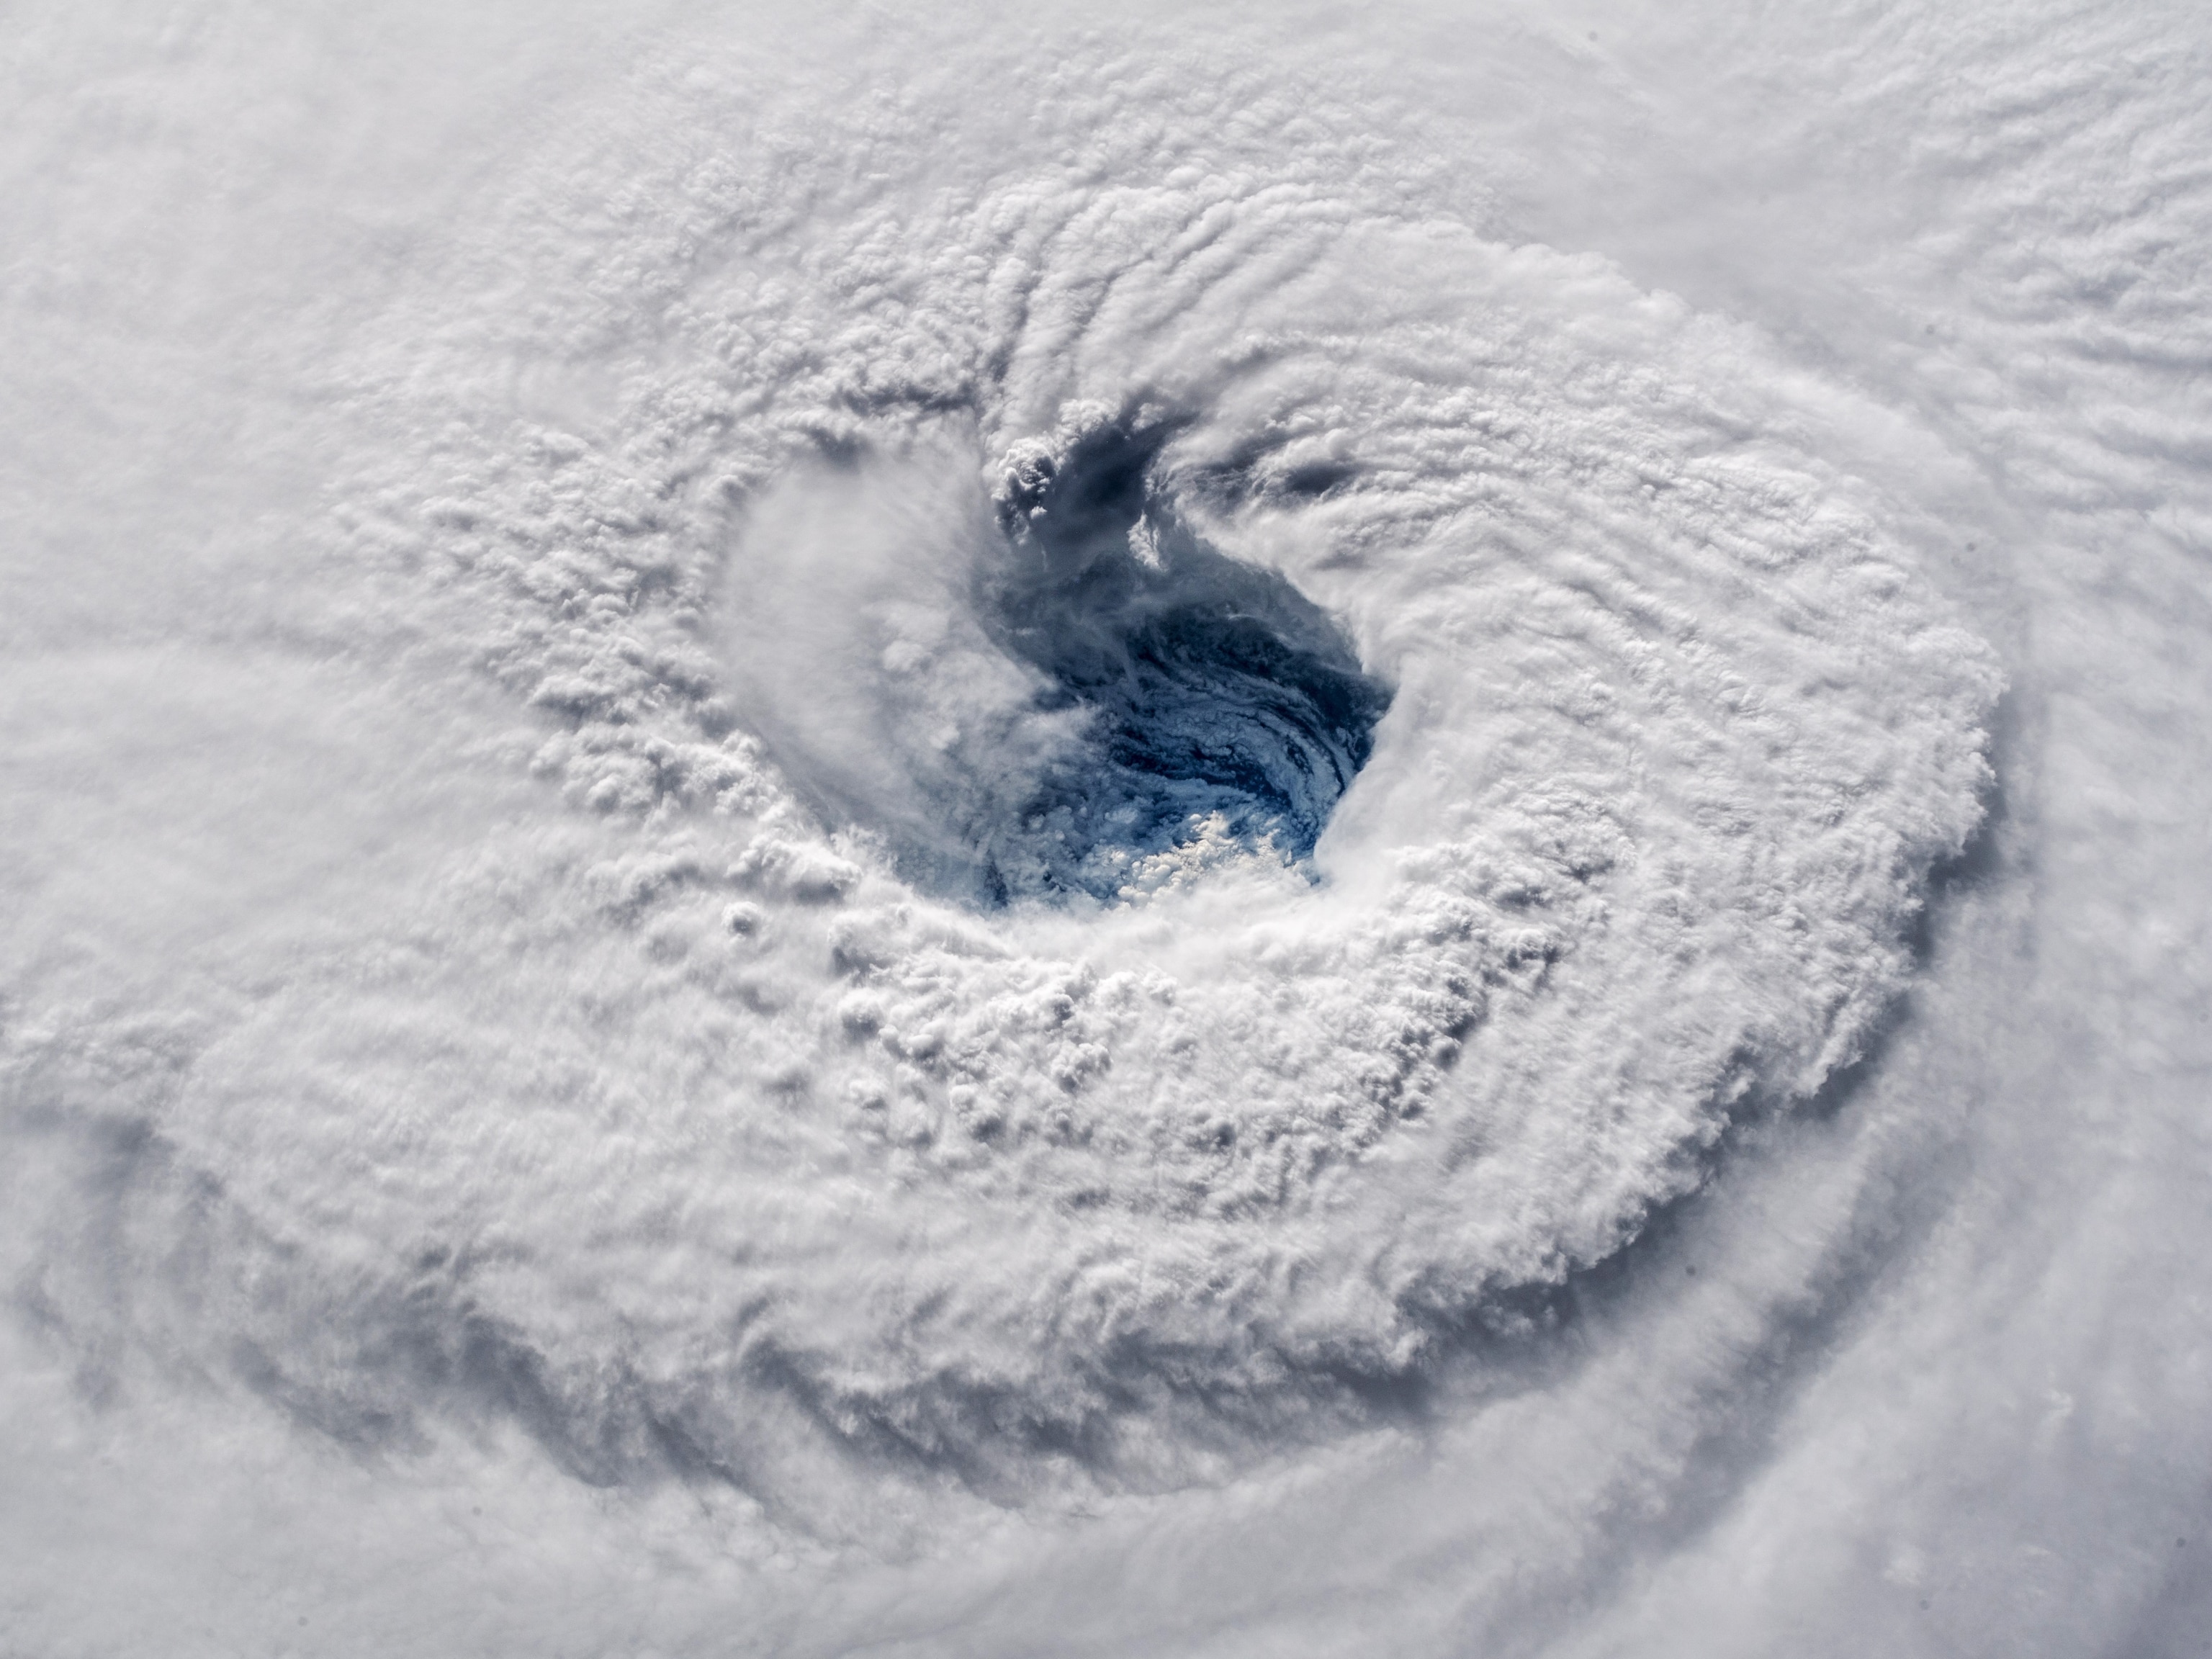
2024 hurricane season forecasted to be record-breaking year

5 reasons why flying is becoming more dangerous

Nature really is good medicine. Science can explain why.
- Environment
- Paid Content
History & Culture
- History & Culture
- Adventures Everywhere
- Terms of Use
- Privacy Policy
- Your US State Privacy Rights
- Children's Online Privacy Policy
- Interest-Based Ads
- About Nielsen Measurement
- Do Not Sell or Share My Personal Information
- Nat Geo Home
- Attend a Live Event
- Book a Trip
- Inspire Your Kids
- Shop Nat Geo
- Visit the D.C. Museum
- Learn About Our Impact
- Support Our Mission
- Advertise With Us
- Customer Service
- Renew Subscription
- Manage Your Subscription
- Work at Nat Geo
- Sign Up for Our Newsletters
- Contribute to Protect the Planet
Copyright © 1996-2015 National Geographic Society Copyright © 2015-2024 National Geographic Partners, LLC. All rights reserved
Content Search
Bangladesh cyclone early action protocol annual report (eap number eap2021bd04), attachments.

SUMMARY OF THE EARLY ACTION PROTOCOL
The IFRC Disaster Response Emergency Fund (DREF) has allocated CHF 350,000 for the implementation anticipatory actions to reduce and mitigate the impact of cyclone in Bangladesh. This Early Action Protocol (EAP) includes an allocation of CHF 195,927 to preposition stock and undertake annual readiness activities in order to implement early actions, if and when the trigger is reached. The early actions to be conducted have been pre-agreed with the National Society and are described in the EAP summary.
This cyclone EAP covers the 13 sea-facing coastal districts and Jhalokati district in Bangladesh. The EAP will be implemented by the Bangladesh Red Crescent Society (BDRCS) with the technical support from IFRC and German Red Cross (GRC). The pre-identified early actions can reach up to 40,000 people in the forecasted area. The pre-activation lead time for cyclones is 72 hours or more and Activation lead time is 30 hours or more. The early actions need to be implemented in the 72 hours between a reliable forecast and the cyclone landfall. This EAP will address the following impacts:
- Helping households for safe evacuation.
- Reducing the overall impacts of the cyclone on life, livelihoods, and health conditions.
- Reducing the impacts of the cyclone on livestock mortality and moveable asset.
- Improving the overall shelter experience of the household, with less problems experienced, and more services received.
Following key early actions have been identified to reduce the impacts in the cyclone shelters at the community level:
- Early warning dissemination and transport arrangement to evacuate people and livestock to cyclone shelters, including household movable assets to safeguard livelihood.
- Distribution of dry food and safe drinking water, oral saline at cyclone shelters.
- Provision of basic first aid service at cyclone shelters.
- Provision of artificial light facilities at community cyclone shelters at night.
- Ensure COVID-19 safety measure (e.g., installation of hand washing station, providing mask, soap, disposal bin, etc.).
With the support of IFRC, BDRCS completed its planned activities under the Cyclone EAP. As part of the readiness activities, BDRCS trained 110 Red Crescent volunteers (70 male and 40 female) and 21 members (16 male and 5 female) from the National Disaster Response Team (NDRT) and the National Disaster WASH Response Team (NDWRT) on the Cyclone EAP, including topics such as Impact-Based Forecasting (IBF), Anticipatory Action (AA), Community Engagement and Accountability (CEA), and Protection, Gender, and Inclusion (PGI). To date, BDRCS has trained over 250 staff, NDRT/NDWRT members, Red Crescent volunteers, and Cyclone Preparedness Programme (CPP) volunteers in 2022 and 2023.
As part of its prepositioning activities, BDRCS positioned 40 sets of super megaphones, 50 sets of portable artificial lights for cyclone shelters, 250 torch lights for volunteers, 100 sets of first-aid boxes with refill packs, 205 waste bins with closed lids, and 50 portable handwashing facilities in strategic locations across 14 coastal districts within the cyclone belt, which are the primary implementation areas of the Cyclone EAP
Related Content
Bangladesh + 1 more
UNICEF Bangladesh Situation Report No. 3 (Cyclone Remal and Floods), 11 September 2024
Bangladesh red crescent society - population movement operation (pmo), cox's bazar, operational update no. 99 - june 2024, unicef bangladesh situation report no. 1 (flash floods in northern and southeastern regions) 27 august 2024.
Bangladesh + 3 more
Bangladesh - Complex Emergency Fact Sheet #3, Fiscal Year (FY) 2024
Climate intelligence at work: the case of Cyclone Freddy
- Marina Menga
- April 19, 2023
Cyclone Freddy has recently made the headlines worldwide because of its destructive impacts on land and its record-breaking intensity. Indeed, Freddy had quite a peculiar behaviour. It developed near the western coast of Australia at the beginning of February 2023, and it crossed the Southern Indian Ocean westward, reaching the eastern coast of Africa over a few weeks. It made a first landfall on Madagascar, crossed the Channel and made landfall over the coast of Mozambique.
Typically, cyclones are fed by heat and energy from the ocean, so they lose intensity when they touch land and tend to dissipate. Unusually, instead of dissipating after landfall, Freddy travelled back to the ocean, where it gained more energy and inverted its direction, hitting land again over the coast of Mozambique and then over Malawi. This uncommon behavior made it the longest tropical Cyclone ever recorded, with a duration of 38 days , beating the previous record of 30 days by more than a week and travelling a total distance of more than 8,000 kilometres.

Freddy is now also recognized as the most intense tropical cyclone ever recorded in terms of accumulated cyclone energy (ACE), a metric which expresses the energy released by a tropical cyclone during its lifetime.
This metric is particularly convenient because it gives an estimate of both the cyclone’s intensity, which is typically its maximum velocity, and its duration, giving a measure of the dissipated energy, which is more representative of the cyclone’s overall activity. According to NASA , Freddy is the highest-ACE-producing tropical cyclone ever recorded worldwide.
Unfortunately, Cyclone Freddy stood out also for its violence and destructive force, being the third-deadliest tropical cyclone ever recorded in the Southern Hemisphere, after Cyclone Idai in 2019 and Flores cyclone in 1973. It produced extraordinarily heavy rains, strong winds, and excessive flooding, destroying houses, crops, and infrastructures, primarily in Mozambique and Malawi.
The death toll in South-East Africa is estimated to be hundreds, with Malawi being the most affected country. The cyclone further compromised communities already struggling with the spread of cholera and often lacking an adequate healthcare system to respond to emergencies.
As reported by Reuters , Malawi President Lazarus Chakwera said that “the death toll from Cyclone Freddy has risen sharply to more than 1,000 people”. Hundreds of people are still missing in the region, and more than half a million are displaced.
The role of climate change
But do these extremes follow an overall tendency in worsening extreme climate events? And is this caused by climate change?
Attribution science, or extreme event attribution, is a relatively recent field in climate science that tries to quantitatively determine if an extreme weather event was caused or worsened by climate change or was simply due to natural variations.

The Intergovernmental Panel on Climate Change (IPCC) had already warned in its reports about an expected rise in intense precipitations, floods, mean wind speed and tropical cyclones, with stronger associated precipitations, in the areas of South-East Africa and Madagascar.
However, it is not always easy to clearly determine if climate change plays a crucial role in the occurrence of an extreme event, and rigorous analyses are not yet available in the case of Cyclone Freddy.
There are mainly two ways to do an attribution analysis for an event such as a tropical cyclone.
The first is of a statistical kind: analyzing the number, frequency, intensity, and impacts of extreme events like Freddy that happen in the present, and making a comparison with the same parameters from pre-industrial times, can give an estimate of the possible influence of climate change on these phenomena.
Another way is to analyse a particular storm through model simulations under different conditions typical of the past, the present, and the future. This will point out under which climate scenario a storm would be more likely.
Climate Intelligence
“Many studies have been carried out at CMCC to try and understand the effects of climate change on tropical cyclones,” says Enrico Scoccimarro of the Climate Simulations and Prediction (CSP) division at the Euro-Mediterranean Center on Climate Change (CMCC) . “On one hand, it is true that with a warmer climate we have a more stable atmosphere, and thus we expect less tropical cyclones. On the other hand, however, it is also true that a higher availability of energy in the ocean leads to more intense storms. Moreover, if a storm happens to go back to the ocean, it has a higher probability to re-strengthen and hit land again, and this is just what happened with Freddy recently.”
A crucial factor in the creation of the perfect storm is the stratification of the ocean. Tropical cyclones are characterized by a mechanism of negative feedback that tends to slow-down and sometimes dissipate the storms. Cyclones absorb heat from water while crossing the ocean, and gain energy from it, making it cooler. In addition to the induced upwelling, in which cooler layers from the bottom of the ocean travel upwards, a process of turbulent mixing of water layers also takes place. With less heat available on the surface, slower cyclones tend to lose their strength and slowly fade, while faster and more violent storms tend to proceed almost undisturbed.
“The point is that this negative feedback is more or less efficient depending on the storm speed and on the level of ocean stratification,” says Scoccimarro. “The stratification is not the same in past or future climate scenarios, and it also varies in the different areas of the world. On average, in a warmer climate, more intense storms are more likely to happen. In a changed climate, we will likely have fewer storms, but they will likely be much more intense .”
CLINT (CLimate INTelligence) project has the goal to improve detection methods of extreme events and their causation and attribution through Machine Learning techniques. Extreme events include not only tropical cyclones but also heat waves or floods, and the project has a focus on South-East Africa for analysing extreme precipitation associated with cyclones. “We are trying to develop improved tools to better quantify the amount of precipitation in the area, in this case, associated with cyclone Freddy,” says Scoccimarro. “This could also be useful to characterize floods and drought events on the dominion of the Zambesi River, which is very close to the impacted areas.”
Predicting the birth of a cyclone like Freddy is not straightforward, but there are parameters and models that can be used to determine if the physical conditions of an area over a certain period of time are favourable. Genesis potential indexes (or GPI) are generally empirical formulations that give an estimate of the occurrence of a tropical cyclone in a cell of 5 degrees longitude by 5 degrees latitude. “Within the CLINT project, we are using Machine Learning to improve this empirical index,” said Scoccimarro. “That is, we are working to improve the correlation of this index and the actual occurrence of a cyclone in a certain area, which is crucial for allowing an optimal response and preparedness to disasters.”
- All Article

What’s on? Climate science meets art at the museum

Those that lose out: Paying for the biggest cost of climate change

Fanning the flames of wildfire resilience

Arctic tourism: how the Great North is becoming the new exotic
The killing of a polar bear by a cruise guard in the Svalbard islands in late July has sparked global criticism of Arctic tourism. Insights from the author of the “The Battle for the Great White North” about a new and increasing trend affecting the Arctic Circle.

Transparency from companies and governments about climate-related information, risks and opportunities is crucial for building a resilient economy, empowering communities and creating an equal and fair society. In the era of climate change, a standardized disclosure framework to understand climate risk is not only helpful to investors, it’s also critical to companies for strategic planning.

The Green Climate Fund Must Focus on Adaptation
Historically adaptation projects have received less funding than ones for mitigation. Furthermore, the burden of implementing adaptation is falling ever more on the public sector, whereas for mitigation private sector interest and investments are on the rise. This is leading to consequences in how climate finance allocates resources which are failing to support at risk areas and Least Developed Countries. The Green Climate Fund aims to bridge this funding gap and has secured its second round of funding, this time obtaining 9.78 billion USD in pledges.
Privacy Overview
Cyclone Gabrielle was intensified by human-induced global warming
A new NIWA-led study has found that climate change increased the amount of total rainfall during Cyclone Gabrielle by 10%.
This additional rain fell during the most intense parts of the storm, suggesting climate change had an amplified effect on the flooding that occurred.
NIWA climate scientist Dr Dáithí Stone says that if the world continues to warm at its current rate, these storm events are likely to become even more extreme.
“Cyclone Gabrielle resembled some of the worst-case scenarios that we could have predicted for the region. We therefore wanted to see how much climate change influenced its power, so we compared the actual MetService forecast of the storm against forecasts under conditions representative of a climate without human interference. Our study found a significant increase in rainfall under human-influenced conditions,” said Dr Stone.

The team also looked at what may have happened if the world was even hotter than now and found that there would have been more rain still.
Since the industrial revolution, human-induced climate change has increased average global temperatures by at least 1.1◦C.
This has led to more intense storm events – a warmer atmosphere holds more moisture, which provides fuel for storms and increases wind speeds.
“Our findings resemble results from similar experiments looking at tropical cyclones elsewhere in the world, so it’s not something specific to New Zealand. The best way to tackle future storms is to reduce our greenhouse gas emissions to halt, or even reverse, the warming of our climate. But until then, Cyclone Gabrielle must form our new benchmark for preparing for any future natural disaster,” said Dr Stone.
Chief Meteorologist at MetService Chris Noble said this research is vitally important.
“The results of this study are incredibly helpful to quantify the influence of climate change on storms in Aotearoa New Zealand. We know the world is warming and the approach we’ve used gives unique insights into how quickly the severity of storms is increasing.
“Studies like this are helpful to aid public understanding of climate change impacts here in New Zealand and may help inform policy and adaptation strategies in the future,” said Mr Noble.

Cyclone Gabrielle formed in the Coral Sea and struck the northeast of Aotearoa New Zealand as an ex-tropical cyclone in February 2023.
During the event, rainfall totals reached nearly 450 mm, which is roughly a quarter of the usual amount in an entire year. Rainfall intensity peaked at nearly 40 mm per hour in some places.
It was one of the worst natural disasters in New Zealand’s history, claiming the lives of 11 people and causing damage estimated at $13.5 billion.
See published research article: Cyclone Gabrielle as a Design Storm for Northeastern Aotearoa New Zealand Under Anthropogenic Warming
Loss and Damages from Cyclone: A Case Study from Odisha, a Coastal State
- First Online: 14 October 2020
Cite this chapter

- Trupti Mishra 5 &
- Krishna Malakar 6
Part of the book series: Disaster Research and Management Series on the Global South ((DRMSGS))
358 Accesses
3 Citations
Natural disasters such as cyclones result in tremendous loss and damages to life and property of coastal communities. However, studies assessing loss and damages are limited in the literature. This study attempts to document the loss and damages incurred by the marine fishing community affected by Cyclone Phailin in 2013, on the coast of Gopalpur in Odisha (India). A survey composed of 300 responses was conducted and it was found that a high percentage (72.67%) of the community experienced decline in income after the cyclone. This may be a result of damage to fishing gear from the cyclone. Although most fishermen were able to start fishing one to three weeks after the cyclone, their income returned to previous levels (before the cyclone) at a much later time. Fortunately, there were no deaths in the surveyed households as a result of the cyclone. Lastly, it was seen that the time and average cost to rebuild houses was greater than that to repair gear. Given the importance of assessing loss and damages in vulnerable communities, this study contributes to the literature by providing a basic overview of the experiences of coastal fishing communities in the aftermath of Cyclone Phailin.
This is a preview of subscription content, log in via an institution to check access.
Access this chapter
Subscribe and save.
- Get 10 units per month
- Download Article/Chapter or eBook
- 1 Unit = 1 Article or 1 Chapter
- Cancel anytime
- Available as PDF
- Read on any device
- Instant download
- Own it forever
- Available as EPUB and PDF
- Durable hardcover edition
- Dispatched in 3 to 5 business days
- Free shipping worldwide - see info
Tax calculation will be finalised at checkout
Purchases are for personal use only
Institutional subscriptions
Displaced Fishermen Off the Coast: Impact of Multiple Hazards on Life Above the Water

The Effects of Oil Rig Decommissioning on the Livelihoods of Fishermen: Lessons from the Saltpond Oil and Gas Field, Ghana
Small-scale fishery income impact from artificial reefs in lang suan district, chumphon province, thailand.
Arunodhaya, Raman, B., Coelho, K., Malar K., Krishnaveni, Dutta, M., Revathi, P., Narayan, P. & Geetha, V. (2016, January). Sample Survey of Losses Sustained During Chennai Floods . Available at https://www.cag.org.in/sites/default/files/database/Report%20of%20Survey%20of%20Losses%20Sustained%20during%20Chennai%20Floods_20160113.pdf . Accessed 23 Apr 2019.
Bal, S. (2018). Community Rebuilds Life After Cyclone Phailin Wrecked Their Fishing Hamlet . Retrieved October 1, 2018, from https://yourstory.com/2018/01/community-life-cyclone-phailin-odisha/
Crompton, R. P., & McAneney, K. J. (2008). Normalised Australian Insured Losses from Meteorological Hazards: 1967–2006. Environmental Science and Policy, 11 (5), 371–378. https://doi.org/10.1016/j.envsci.2008.01.005 .
Article Google Scholar
Dutta, D., Herath, S., & Musiake, K. (2003). A Mathematical Model for Flood Loss Estimation. Journal of Hydrology, 277 (1–2), 24–49. https://doi.org/10.1016/S0022-1694(03)00084-2 .
Government of India. (2019). Cyclones & Their Impact in India . Retrieved May 14, 2019, from https://ncrmp.gov.in/cyclones-their-impact-in-india/
Government of Odisha. (2013). Cyclone Phailin in Odisha: Rapid Damage and Needs Assessment Report . Retrieved February 22, 2019, from http://documents.worldbank.org/curated/en/168471468257979992/pdf/838860WP0P14880Box0382116B00PUBLIC0.pdf
IMD. (2014). Tracks of Cyclones and Depressions . Retrieved April 30, 2018, from http://www.rmcchennaieatlas.tn.nic.in/Plotting_ByParam.aspx
Kakakhel, K. (2015). Towards Quantification of Loss and Damage . Retrieved April 22, 2019, from http://www.lead.org.pk/lead/Publications/32-Towards Quantification of Loss and Damage.pdf
Munich RE. (2019). Media Information on Natural Catastrophe . Retrieved May 10, 2019, from https://www.munichre.com/en/media-relations/publications/press-releases/2019/2019-01-08-press-release/index.html
Patankar, A., & Patwardhan, A. (2016). Estimating the Uninsured Losses Due to Extreme Weather Events and Implications for Informal Sector Vulnerability: A Case Study of Mumbai, India. Natural Hazards, 80 (1), 285–310. https://doi.org/10.1007/s11069-015-1968-3 .
Pielke, R. A., Jr., & Landsea, C. W. (1998). Normalized Hurricane Damages in the United States: 1925–95. Weather and Forecasting, 13 (3), 621–631. https://doi.org/10.1175/1520-0434(1998)013<0621:NHDITU>2.0.CO;2 .
Rabbani, G., Rahman, A., & Mainuddin, K. (2013). Salinity-Induced Loss and Damage to Farming Households in Coastal Bangladesh. International Journal of Global Warming, 5 (4), 400–415. https://doi.org/10.1504/ijgw.2013.057284 .
ReliefWeb. (2009). In-depth Recovery Needs Assessment of Cyclone Aila Affected Areas . Retrieved May 14, 2019, from https://reliefweb.int/sites/reliefweb.int/files/resources/F6603B7EF22A16B4C125768D004B1190-Full_Report.pdf
Senapati, A. (2013). UN Felicitates Odisha for Its Disaster Management Model During Phailin. Down to Earth . Retrieved from https://www.downtoearth.org.in/news/un-felicitates-odisha-for-its-disaster-management-model-during-phailin-43087
The Hindu. (2013). Phailin: Ganjam Worst Hit, 2.4 Lakh Houses Damaged . Retrieved October 1, 2018, from https://www.thehindu.com/news/national/other-states/phailin-ganjam-worst-hit-24-lakh-houses-damaged/article5236356.ece
van der Geest, K., & Warner, K. (2015). What the IPCC 5th Assessment Report Has to Say About Loss and Damage (UNU-EHS Working Paper No. 21). Bonn.
Google Scholar
Wallemacq, P., & House, R. (2018). Economic Losses, Poverty & Disasters: 1998–2017 . UNDRR and CRED. Retrieved from https://www.unisdr.org/files/61119_credeconomiclosses.pdf
Warner, K., & Van der Geest, K. (2013). Loss and Damage from Climate Change: Local-Level Evidence from Nine Vulnerable Countries. International Journal of Global Warming, 5 (4), 367–386. https://doi.org/10.1504/ijgw.2013.057289 .
Zhang, Q., Wu, L., & Liu, Q. (2009). Tropical Cyclone Damages in China 1983-2006. Bulletin of the American Meteorological Society, 90 (4), 489–495. https://doi.org/10.1175/2008BAMS2631.1 .
Download references
Acknowledgment
The authors are grateful to the Indian Council of Social Science Research (ICSSR) for funding the study.
Author information
Authors and affiliations.
Shailesh J. Mehta School of Management, Indian Institute of Technology Bombay, Mumbai, India
Trupti Mishra
Indian Institute of Technology Bombay, Mumbai, India
Krishna Malakar
You can also search for this author in PubMed Google Scholar
Corresponding author
Correspondence to Trupti Mishra .
Editor information
Editors and affiliations.
Center for the Study of Law & Governance, Jawaharlal Nehru University, New Delhi, India
Amita Singh
Department of Public Administration, University of Sri Jayewardenepura, Nugegoda, Sri Lanka
R. Lalitha S. Fernando
Additional Chief Secretary, 3rd Floor, Government of Kerala, South Block, Trivandrum, Kerala, India
Nivedita P. Haran
Rights and permissions
Reprints and permissions
Copyright information
© 2020 The Author(s)
About this chapter
Mishra, T., Malakar, K. (2020). Loss and Damages from Cyclone: A Case Study from Odisha, a Coastal State. In: Singh, A., Fernando, R.L.S., Haran, N.P. (eds) Development in Coastal Zones and Disaster Management. Disaster Research and Management Series on the Global South. Palgrave Macmillan, Singapore. https://doi.org/10.1007/978-981-15-4294-7_19
Download citation
DOI : https://doi.org/10.1007/978-981-15-4294-7_19
Published : 14 October 2020
Publisher Name : Palgrave Macmillan, Singapore
Print ISBN : 978-981-15-4293-0
Online ISBN : 978-981-15-4294-7
eBook Packages : Business and Management Business and Management (R0)
Share this chapter
Anyone you share the following link with will be able to read this content:
Sorry, a shareable link is not currently available for this article.
Provided by the Springer Nature SharedIt content-sharing initiative
- Publish with us
Policies and ethics
- Find a journal
- Track your research
IMAGES
VIDEO
COMMENTS
The UN World Food Programme (WFP) says that Cyclone Idai wiped out a whole year's worth of crops across swathes of Mozambique, Malawi and Zimbabwe. At least 1 million acres of crops were destroyed. The cyclone is expected to cost Malawi, Mozambique and Zimbabwe more than $2bn, the World Bank has said. Cholera infected at least 1,052 people in ...
Case Study Research Project. Your task is to create a project on a single tropical cyclone. It can be a cyclone, typhoon or hurricane but it must have taken place within your lifetime. Your project can be electronic or hard copy and can be submitted in either format. It is an independent piece so you must submit your own, unique final piece but ...
3 forces are influencing where storms are hitting . Greenhouse gases are warming the upper atmosphere and the ocean. This combines to create a more stable atmosphere with less chance that convection of air currents will help spawn and build up tropical cyclones.. Particulate pollution and other aerosols help create clouds and reflect sunlight away from the earth, causing cooling, Murakami said.
Figure 13.10a Evolution of geopotential height contours (km) of the 50 kPa isobaric surface (known as "50 kPa heights") during a day and a half for the case-study cyclone. Height contour interval is 0.06 km. "X" marks the surface-low location at the valid times of the two different maps. The thick dashed line shows the axis of the low ...
Black Marble products expedited disaster relief efforts in Mozambique during Hurricane Idai. In March 2019, Tropical Cyclone Idai made a devastating landfall over Mozambique's port city of Beira, Sofala Province. The storm - considered one of the deadliest cyclones to hit the Southern Hemisphere - destroyed and damaged about 90% of Beira City ...
case study: tropical cyclones 3.3.2: tropical cyclones are a major short-term weather hazard impact of tropical cyclones: hurricane michael vs. typhoon mangkhut hurricane michael, usa: 10 october 2018 typhoon mangkhut, philippines and south china: 15 september 2018 category 4 5 wind speed 155 mph 240-270 mph
The cyclone track data used in the current study is for a total of 275 TCs originating in the Arabian Sea or the Bay of Bengal during 1979-2020.
Learning from Cyclone Nargis - A Case Study 7 Box 1. Mangroves as a natural defence against the impacts of Cyclone Nargis There is much anecdotal evidence regarding the role of mangroves in providing refuge from the cyclone's impacts and in protecting lives. According to one source4, "Interviews [with villagers]
Cyclone Idai also had a loopy lifespan. It was born March 4th just off the coast in the very warm waters of the Mozambique Channel—a 250 mile-wide arm of the Indian Ocean between Mozambique and ...
This cyclone EAP covers the 13 sea-facing coastal districts and Jhalokati district in Bangladesh. The EAP will be implemented by the Bangladesh Red Crescent Society (BDRCS) with the technical ...
2.3 Analysis region and periods. For ERA5 and the HighResMIP simulations, we perform the analysis over the area used in TC forecasting by the World Meteorological Organization Regional Specialised Meteorological Center at La Reunion (e.g., Knapp et al., 2010).This area is bounded by 0°-40°S and 30°-90°E and contains much of the South Indian Ocean, Madagascar, the Mozambique Channel and ...
A tropical cyclone is the generic term for a warm-cored, non-frontal synoptic-scale low-pressure system over tropical or subtropical waters around the world. [4] [5] The systems generally have a well-defined center which is surrounded by deep atmospheric convection and a closed wind circulation at the surface. [4]A tropical cyclone is generally deemed to have formed once mean surface winds in ...
Tropical cyclones are very destructive natural hazards that often result in casualties, economic loss, and environmental degradation, especially in the coastal communities. Gaja, categorized as a severe cyclone struck the southeast coast of India on November 16, 2018 and devastated thousands of people in the six districts of the State of Tamil Nadu, India; two years since, many are still ...
A Very Severe Cyclonic Storm 'Yaas' developed over the Bay of Bengal (BoB) on 23 May 2021 and crossed over the Odisha coast on 26 May with maximum sustained wind speed of 75 kts. Herein, a pathway has been developed and exemplified for 'Yaas' through three-stage cyclone-induced hazard tracking. Days before the cyclone formation, cyclone genesis potential parameter, sea surface ...
Unfortunately, Cyclone Freddy stood out also for its violence and destructive force, being the third-deadliest tropical cyclone ever recorded in the Southern Hemisphere, after Cyclone Idai in 2019 and Flores cyclone in 1973. It produced extraordinarily heavy rains, strong winds, and excessive flooding, destroying houses, crops, and ...
Cyclone Pam in Vanuatu Case Study. Disaster risk reduction in Vanuatu Vanuatu is one of the world's most disaster-prone countries, ranking first among 171 countries covered by the World Risk Index 2015. It is vulnerable to rising sea levels, soil erosion, heavy
CASE STUDY CC IDAI: IN TE GRA TI O HIV I T O TH HMAIT ARIA ESPONSE I MAA WI, MZAMIQUE AD ZIMABWE Figure 1: Tropical Cyclone Idai - Cyclone and food affected areas Source: OCHA Southern Africa Cyclone Idai Snapshot (as of 9 April 2019) Cyclone's impact on adults and children living with HIV Southern africa is the global epicenter of the HIV ...
But until then, Cyclone Gabrielle must form our new benchmark for preparing for any future natural disaster," said Dr Stone. Chief Meteorologist at MetService Chris Noble said this research is vitally important. "The results of this study are incredibly helpful to quantify the influence of climate change on storms in Aotearoa New Zealand.
To this end, this book addresses this gap by documenting the implications of tropical cyclones, drawing examples and case studies from recent tropical cyclones such as cyclone Idai and cyclone ...
Conclusion. This systematic review shows that evidence of the losses caused by the 1999 super cyclone is lacking at the meso- and micro-level (village and household scale), with most information available only at the macro-level (State and District scale) and mostly focusing on mortality data.
50,000 people are still missing. A death toil of at least 138 000 people has been quoted, but estimates vary widely, it is thought that 80,000 people could have died in the town of Labutta alone, making the 84,000people death toll seem unrealistic. It is estimated that at least 2.4 million people were severely affected by this cyclone.
In view of increasing cyclonic activity in the Indian Ocean, nations in southern Africa should prepare well for flood-related disasters. This paper critically examined the level of preparedness of the government of Zimbabwe to cyclonic disasters using the country's three most disastrous cyclones during the past two decades: (a) Cyclone Eline of 2000, (b) Cyclone Dineo of 2017 and (c) Cyclone ...
1, 3 School of Studies in Environmental Science, Pt. Ravishankar Shukla University, Raipur, Chhattisgarh -492010. 2 Department of Chemistry, Guru Ghasidas Vishwavidyalaya (A Central University ...
Name of Cyclone (Case Study No.) Reasons for non-use of MPCS; Phailin, Ganjam, Odisha (I) a) Located in a low-lying area and thus flood-prone. b) Unsafe due to poor maintainaces. c) 'Own house or that of neighbor' is a better choice. Hudhud, Visakhapatnam, Andhra Pradesh (II) a) Dilapidated conditions. b) Very limited accommodation capacity. c)
Cyclone Fani. Extremely Severe Cyclonic Storm Fani (/ ˈfɒniː /) [a] was the worst tropical cyclone to strike the Indian state of Odisha since the 1999 Odisha cyclone. The second named storm and the first severe cyclonic storm of the 2019 North Indian Ocean cyclone season, Fani originated from a tropical depression that formed west of Sumatra ...
This study attempts to document the loss and damages incurred by the marine fishing community affected by Cyclone Phailin in 2013, on the coast of Gopalpur in Odisha (India). A survey composed of 300 responses was conducted and it was found that a high percentage (72.67%) of the community experienced decline in income after the cyclone.