
Step-by-step guide to hypothesis testing in statistics

Hypothesis testing in statistics helps us use data to make informed decisions. It starts with an assumption or guess about a group or population—something we believe might be true. We then collect sample data to check if there is enough evidence to support or reject that guess. This method is useful in many fields, like science, business, and healthcare, where decisions need to be based on facts.
Learning how to do hypothesis testing in statistics step-by-step can help you better understand data and make smarter choices, even when things are uncertain. This guide will take you through each step, from creating your hypothesis to making sense of the results, so you can see how it works in practical situations.
What is Hypothesis Testing?
Table of Contents
Hypothesis testing is a method for determining whether data supports a certain idea or assumption about a larger group. It starts by making a guess, like an average or a proportion, and then uses a small sample of data to see if that guess seems true or not.
For example, if a company wants to know if its new product is more popular than its old one, it can use hypothesis testing. They start with a statement like “The new product is not more popular than the old one” (this is the null hypothesis) and compare it with “The new product is more popular” (this is the alternative hypothesis). Then, they look at customer feedback to see if there’s enough evidence to reject the first statement and support the second one.
Simply put, hypothesis testing is a way to use data to help make decisions and understand what the data is really telling us, even when we don’t have all the answers.
Importance Of Hypothesis Testing In Decision-Making And Data Analysis
Hypothesis testing is important because it helps us make smart choices and understand data better. Here’s why it’s useful:
- Reduces Guesswork : It helps us see if our guesses or ideas are likely correct, even when we don’t have all the details.
- Uses Real Data : Instead of just guessing, it checks if our ideas match up with real data, which makes our decisions more reliable.
- Avoids Errors : It helps us avoid mistakes by carefully checking if our ideas are right so we don’t make costly errors.
- Shows What to Do Next : It tells us if our ideas work or not, helping us decide whether to keep, change, or drop something. For example, a company might test a new ad and decide what to do based on the results.
- Confirms Research Findings : It makes sure that research results are accurate and not just random chance so that we can trust the findings.
Here’s a simple guide to understanding hypothesis testing, with an example:
1. Set Up Your Hypotheses
Explanation: Start by defining two statements:
- Null Hypothesis (H0): This is the idea that there is no change or effect. It’s what you assume is true.
- Alternative Hypothesis (H1): This is what you want to test. It suggests there is a change or effect.
Example: Suppose a company says their new batteries last an average of 500 hours. To check this:
- Null Hypothesis (H0): The average battery life is 500 hours.
- Alternative Hypothesis (H1): The average battery life is not 500 hours.
2. Choose the Test
Explanation: Pick a statistical test that fits your data and your hypotheses. Different tests are used for various kinds of data.
Example: Since you’re comparing the average battery life, you use a one-sample t-test .
3. Set the Significance Level
Explanation: Decide how much risk you’re willing to take if you make a wrong decision. This is called the significance level, often set at 0.05 or 5%.
Example: You choose a significance level of 0.05, meaning you’re okay with a 5% chance of being wrong.
4. Gather and Analyze Data
Explanation: Collect your data and perform the test. Calculate the test statistic to see how far your sample result is from what you assumed.
Example: You test 30 batteries and find they last an average of 485 hours. You then calculate how this average compares to the claimed 500 hours using the t-test.
5. Find the p-Value
Explanation: The p-value tells you the probability of getting a result as extreme as yours if the null hypothesis is true.
Example: You find a p-value of 0.0001. This means there’s a very small chance (0.01%) of getting an average battery life of 485 hours or less if the true average is 500 hours.
6. Make Your Decision
Explanation: Compare the p-value to your significance level. If the p-value is smaller, you reject the null hypothesis. If it’s larger, you do not reject it.
Example: Since 0.0001 is much less than 0.05, you reject the null hypothesis. This means the data suggests the average battery life is different from 500 hours.
7. Report Your Findings
Explanation: Summarize what the results mean. State whether you rejected the null hypothesis and what that implies.
Example: You conclude that the average battery life is likely different from 500 hours. This suggests the company’s claim might not be accurate.
Hypothesis testing is a way to use data to check if your guesses or assumptions are likely true. By following these steps—setting up your hypotheses, choosing the right test, deciding on a significance level, analyzing your data, finding the p-value, making a decision, and reporting results—you can determine if your data supports or challenges your initial idea.
Understanding Hypothesis Testing: A Simple Explanation
Hypothesis testing is a way to use data to make decisions. Here’s a straightforward guide:
1. What is the Null and Alternative Hypotheses?
- Null Hypothesis (H0): This is your starting assumption. It says that nothing has changed or that there is no effect. It’s what you assume to be true until your data shows otherwise. Example: If a company says their batteries last 500 hours, the null hypothesis is: “The average battery life is 500 hours.” This means you think the claim is correct unless you find evidence to prove otherwise.
- Alternative Hypothesis (H1): This is what you want to find out. It suggests that there is an effect or a difference. It’s what you are testing to see if it might be true. Example: To test the company’s claim, you might say: “The average battery life is not 500 hours.” This means you think the average battery life might be different from what the company says.
2. One-Tailed vs. Two-Tailed Tests
- One-Tailed Test: This test checks for an effect in only one direction. You use it when you’re only interested in finding out if something is either more or less than a specific value. Example: If you think the battery lasts longer than 500 hours, you would use a one-tailed test to see if the battery life is significantly more than 500 hours.
- Two-Tailed Test: This test checks for an effect in both directions. Use this when you want to see if something is different from a specific value, whether it’s more or less. Example: If you want to see if the battery life is different from 500 hours, whether it’s more or less, you would use a two-tailed test. This checks for any significant difference, regardless of the direction.
3. Common Misunderstandings
- Clarification: Hypothesis testing doesn’t prove that the null hypothesis is true. It just helps you decide if you should reject it. If there isn’t enough evidence against it, you don’t reject it, but that doesn’t mean it’s definitely true.
- Clarification: A small p-value shows that your data is unlikely if the null hypothesis is true. It suggests that the alternative hypothesis might be right, but it doesn’t prove the null hypothesis is false.
- Clarification: The significance level (alpha) is a set threshold, like 0.05, that helps you decide how much risk you’re willing to take for making a wrong decision. It should be chosen carefully, not randomly.
- Clarification: Hypothesis testing helps you make decisions based on data, but it doesn’t guarantee your results are correct. The quality of your data and the right choice of test affect how reliable your results are.
Benefits and Limitations of Hypothesis Testing
- Clear Decisions: Hypothesis testing helps you make clear decisions based on data. It shows whether the evidence supports or goes against your initial idea.
- Objective Analysis: It relies on data rather than personal opinions, so your decisions are based on facts rather than feelings.
- Concrete Numbers: You get specific numbers, like p-values, to understand how strong the evidence is against your idea.
- Control Risk: You can set a risk level (alpha level) to manage the chance of making an error, which helps avoid incorrect conclusions.
- Widely Used: It can be used in many areas, from science and business to social studies and engineering, making it a versatile tool.
Limitations
- Sample Size Matters: The results can be affected by the size of the sample. Small samples might give unreliable results, while large samples might find differences that aren’t meaningful in real life.
- Risk of Misinterpretation: A small p-value means the results are unlikely if the null hypothesis is true, but it doesn’t show how important the effect is.
- Needs Assumptions: Hypothesis testing requires certain conditions, like data being normally distributed . If these aren’t met, the results might not be accurate.
- Simple Decisions: It often results in a basic yes or no decision without giving detailed information about the size or impact of the effect.
- Can Be Misused: Sometimes, people misuse hypothesis testing, tweaking data to get a desired result or focusing only on whether the result is statistically significant.
- No Absolute Proof: Hypothesis testing doesn’t prove that your hypothesis is true. It only helps you decide if there’s enough evidence to reject the null hypothesis, so the conclusions are based on likelihood, not certainty.
Final Thoughts
Hypothesis testing helps you make decisions based on data. It involves setting up your initial idea, picking a significance level, doing the test, and looking at the results. By following these steps, you can make sure your conclusions are based on solid information, not just guesses.
This approach lets you see if the evidence supports or contradicts your initial idea, helping you make better decisions. But remember that hypothesis testing isn’t perfect. Things like sample size and assumptions can affect the results, so it’s important to be aware of these limitations.
In simple terms, using a step-by-step guide for hypothesis testing is a great way to better understand your data. Follow the steps carefully and keep in mind the method’s limits.
What is the difference between one-tailed and two-tailed tests?
A one-tailed test assesses the probability of the observed data in one direction (either greater than or less than a certain value). In contrast, a two-tailed test looks at both directions (greater than and less than) to detect any significant deviation from the null hypothesis.
How do you choose the appropriate test for hypothesis testing?
The choice of test depends on the type of data you have and the hypotheses you are testing. Common tests include t-tests, chi-square tests, and ANOVA. You get more details about ANOVA, you may read Complete Details on What is ANOVA in Statistics ? It’s important to match the test to the data characteristics and the research question.
What is the role of sample size in hypothesis testing?
Sample size affects the reliability of hypothesis testing. Larger samples provide more reliable estimates and can detect smaller effects, while smaller samples may lead to less accurate results and reduced power.
Can hypothesis testing prove that a hypothesis is true?
Hypothesis testing cannot prove that a hypothesis is true. It can only provide evidence to support or reject the null hypothesis. A result can indicate whether the data is consistent with the null hypothesis or not, but it does not prove the alternative hypothesis with certainty.
Related Posts

How to Find the Best Online Statistics Homework Help

Why SPSS Homework Help Is An Important aspect for Students?
Leave a comment cancel reply.
Your email address will not be published. Required fields are marked *
- Skip to secondary menu
- Skip to main content
- Skip to primary sidebar
Statistics By Jim
Making statistics intuitive
Hypothesis Testing
Hypothesis testing: uses, steps & example.
By Jim Frost 4 Comments
What is Hypothesis Testing?
Hypothesis testing in statistics uses sample data to infer the properties of a whole population . These tests determine whether a random sample provides sufficient evidence to conclude an effect or relationship exists in the population. Researchers use them to help separate genuine population-level effects from false effects that random chance can create in samples. These methods are also known as significance testing. [Read more…] about Hypothesis Testing: Uses, Steps & Example
Type 2 Error Overview & Example
By Jim Frost 3 Comments
What is a Type 2 Error?
A type 2 error (AKA Type II error) occurs when you fail to reject a false null hypothesis in a hypothesis test. In other words, a statistically non-significant test result indicates that a population effect does not exist when it actually does. A type 2 error is a false negative because the effect exists in the population, but the test doesn’t detect it in the sample. [Read more…] about Type 2 Error Overview & Example
Type 1 Error Overview & Example
By Jim Frost Leave a Comment
What is a Type 1 Error?
A type 1 error (AKA Type I error) occurs when you reject a true null hypothesis in a hypothesis test. In other words, a statistically significant test result indicates that a population effect exists when it does not. A type 1 error is a false positive because the test detects an effect in the sample that doesn’t exist in the population. [Read more…] about Type 1 Error Overview & Example
One Sample T Test: Definition, Using & Example
What is a one sample t test.
Use a one sample t test to evaluate a population mean using a single sample. Usually, you conduct this hypothesis test to determine whether a population mean differs from a hypothesized value you specify. The hypothesized value can be theoretically important in the study area, a reference value, or a target. [Read more…] about One Sample T Test: Definition, Using & Example
T Test Overview: How to Use & Examples
By Jim Frost 12 Comments
What is a T Test?
A t test is a statistical hypothesis test that assesses sample means to draw conclusions about population means. Frequently, analysts use a t test to determine whether the population means for two groups are different. For example, it can determine whether the difference between the treatment and control group means is statistically significant. [Read more…] about T Test Overview: How to Use & Examples
Wilcoxon Signed Rank Test Explained
By Jim Frost 1 Comment
What is the Wilcoxon Signed Rank Test?
The Wilcoxon signed rank test is a nonparametric hypothesis test that can do the following:
- Evaluate the median difference between two paired samples.
- Compare a 1-sample median to a reference value.
[Read more…] about Wilcoxon Signed Rank Test Explained
What is P Hacking: Methods & Best Practices
By Jim Frost 2 Comments
P-Hacking Definition
P hacking is a set of statistical decisions and methodology choices during research that artificially produces statistically significant results. These decisions increase the probability of false positives—where the study indicates an effect exists when it actually does not. P-hacking is also known as data dredging, data fishing, and data snooping. [Read more…] about What is P Hacking: Methods & Best Practices
Kruskal Wallis Test Explained
What is the kruskal wallis test.
The Kruskal Wallis test is a nonparametric hypothesis test that compares three or more independent groups. Statisticians also refer to it as one-way ANOVA on ranks. This analysis extends the Mann Whitney U nonparametric test that can compare only two groups. [Read more…] about Kruskal Wallis Test Explained
What is the Bonferroni Correction and How to Use It
By Jim Frost 8 Comments
What is the Bonferroni Correction?
The Bonferroni correction adjusts your significance level to control the overall probability of a Type I error (false positive) for multiple hypothesis tests. [Read more…] about What is the Bonferroni Correction and How to Use It
Mann Whitney U Test Explained
What is the mann whitney u test.
The Mann Whitney U test is a nonparametric hypothesis test that compares two independent groups. Statisticians also refer to it as the Wilcoxon rank sum test. The Kruskal Wallis test extends this analysis so that can compare more than two groups. [Read more…] about Mann Whitney U Test Explained
Fisher’s Exact Test: Using & Interpreting
By Jim Frost 11 Comments
Fisher’s exact test determines whether a statistically significant association exists between two categorical variables .
For example, does a relationship exist between gender (Male/Female) and voting Yes or No on a referendum? [Read more…] about Fisher’s Exact Test: Using & Interpreting
Z Test: Uses, Formula & Examples
What is a z test.
Use a Z test when you need to compare group means. Use the 1-sample analysis to determine whether a population mean is different from a hypothesized value. Or use the 2-sample version to determine whether two population means differ. [Read more…] about Z Test: Uses, Formula & Examples
Statistical Significance: Definition & Meaning
By Jim Frost 5 Comments
What is Statistical Significance?

Statistical significance is the goal for most researchers analyzing data. But what does statistically significant mean? Why and when is it important to consider? How do P values fit in with statistical significance? I’ll answer all these questions in this blog post!
Evaluate statistical significance when using a sample to estimate an effect in a population. It helps you determine whether your findings are the result of chance versus an actual effect of a variable of interest. [Read more…] about Statistical Significance: Definition & Meaning
Statistical Inference: Definition, Methods & Example
What is statistical inference.
Statistical inference is the process of using a sample to infer the properties of a population. Statistical procedures use sample data to estimate the characteristics of the whole population from which the sample was drawn.

Unfortunately, populations are usually too large to measure fully. Consequently, researchers must use a manageable subset of that population to learn about it.
By using procedures that can make statistical inferences, you can estimate the properties and processes of a population. More specifically, sample statistics can estimate population parameters . Learn more about the differences between sample statistics and population parameters .
For example, imagine that you are studying a new medication. As a scientist, you’d like to understand the medicine’s effect in the entire population rather than just a small sample. After all, knowing the effect on a handful of people isn’t very helpful for the larger society!
Consequently, you are interested in making a statistical inference about the medicine’s effect in the population.
Read on to see how to do that! I’ll show you the general process for making a statistical inference and then cover an example using real data.
Related posts : Populations vs. Samples and Descriptive vs. Inferential Statistics
How to Make Statistical Inferences
In its simplest form, the process of making a statistical inference requires you to do the following:
- Draw a sample that adequately represents the population.
- Measure your variables of interest.
- Use appropriate statistical methodology to generalize your sample results to the population while accounting for sampling error.
Of course, that’s the simple version. In real-world experiments, you might need to form treatment and control groups , administer treatments, and reduce other sources of variation. In more complex cases, you might need to create a model of a process. There are many details in the process of making a statistical inference! Learn how to incorporate statistical inference into scientific studies .
Statistical inference requires using specialized sampling methods that tend to produce representative samples. If the sample does not look like the larger population you’re studying, you can’t trust any inferences from the sample. Consequently, using an appropriate method to obtain your sample is crucial. The best sampling methods tend to produce samples that look like the target population. Learn more about Sampling Methods and Representative Samples .
After obtaining a representative sample, you’ll need to use a procedure that can make statistical inferences. While you might have a sample that looks similar to the population, it will never be identical to it. Statisticians refer to the differences between a sample and the population as sampling error. Any effect or relationship you see in your sample might actually be sampling error rather than a true finding. Inferential statistics incorporate sampling error into the results. Learn more about Sampling Error .
Common Inferential Methods
The following are four standard procedures than can make statistical inferences.
- Hypothesis Testing : Uses representative samples to assess two mutually exclusive hypotheses about a population. Statistically significant results suggest that the sample effect or relationship exists in the population after accounting for sampling error.
- Confidence Intervals : A range of values likely containing the population value. This procedure evaluates the sampling error and adds a margin around the estimate, giving an idea of how wrong it might be.
- Margin of Error : Comparable to a confidence interval but usually for survey results.
- Regression Modeling : An estimate of the process that generates the outcomes in the population.
Example Statistical Inference
Let’s look at a real flu vaccine study for an example of making a statistical inference. The scientists for this study want to evaluate whether a flu vaccine effectively reduces flu cases in the general population. However, the general population is much too large to include in their study, so they must use a representative sample to make a statistical inference about the vaccine’s effectiveness.
The Monto et al. study* evaluates the 2007-2008 flu season and follows its participants from January to April. Participants are 18-49 years old. They selected ~1100 participants and randomly assigned them to the vaccine and placebo groups. After tracking them for the flu season, they record the number of flu infections in each group, as shown below.
| Placebo | 35 | 325 | 10.8% |
| Vaccine | 28 | 813 | 3.4% |
| Effect | 7.4% |
Monto Study Findings
From the table above, 10.8% of the unvaccinated got the flu, while only 3.4% of the vaccinated caught it. The apparent effect of the vaccine is 10.8% – 3.4% = 7.4%. While that seems to show a vaccine effect, it might be a fluke due to sampling error. We’re assessing only 1,100 people out of a population of millions. We need to use a hypothesis test and confidence interval (CI) to make a proper statistical inference.
While the details go beyond this introductory post, here are two statistical inferences we can make using a 2-sample proportions test and CI.
- The p-value of the test is < 0.0005. The evidence strongly favors the hypothesis that the vaccine effectively reduces flu infections in the population after accounting for sampling error.
- Additionally, the confidence interval for the effect size is 3.7% to 10.9%. Our study found a sample effect of 7.4%, but it is unlikely to equal the population effect exactly due to sampling error. The CI identifies a range that is likely to include the population effect.
For more information about this and other flu vaccine studies, read my post about Flu Vaccine Effectiveness .
In conclusion, by using a representative sample and the proper methodology, we made a statistical inference about vaccine effectiveness in an entire population.
Monto AS, Ohmit SE, Petrie JG, Johnson E, Truscon R, Teich E, Rotthoff J, Boulton M, Victor JC. Comparative efficacy of inactivated and live attenuated influenza vaccines. N Engl J Med. 2009;361(13):1260-7.
How to Find the P value: Process and Calculations
P values are everywhere in statistics. They’re in all types of hypothesis tests. But how do you calculate a p-value? Unsurprisingly, the precise calculations depend on the test. However, there is a general process that applies to finding a p value.
In this post, you’ll learn how to find the p value. I’ll start by showing you the general process for all hypothesis tests. Then I’ll move on to a step-by-step example showing the calculations for a p value. This post includes a calculator so you can apply what you learn. [Read more…] about How to Find the P value: Process and Calculations
What is Power in Statistics?
Power in statistics is the probability that a hypothesis test can detect an effect in a sample when it exists in the population. It is the sensitivity of a hypothesis test. When an effect exists in the population, how likely is the test to detect it in your sample? [Read more…] about What is Power in Statistics?
Chi-Square Goodness of Fit Test: Uses & Examples
By Jim Frost 6 Comments
What is the Chi Square Goodness of Fit Test?
The chi-square goodness of fit test evaluates whether proportions of categorical or discrete outcomes in a sample follow a population distribution with hypothesized proportions. In other words, when you draw a random sample, do the observed proportions follow the values that theory suggests. [Read more…] about Chi-Square Goodness of Fit Test: Uses & Examples
Sampling Error: Definition, Sources & Minimizing
What is sampling error.
Sampling error is the difference between a sample statistic and the population parameter it estimates. It is a crucial consideration in inferential statistics where you use a sample to estimate the properties of an entire population. [Read more…] about Sampling Error: Definition, Sources & Minimizing
Inter-Rater Reliability: Definition, Examples & Assessing
What is inter-rater reliability.
Inter-rater reliability measures the agreement between subjective ratings by multiple raters, inspectors, judges, or appraisers. It answers the question, is the rating system consistent? High inter-rater reliability indicates that multiple raters’ ratings for the same item are consistent. Conversely, low reliability means they are inconsistent. [Read more…] about Inter-Rater Reliability: Definition, Examples & Assessing
Margin of Error: Formula and Interpreting
What is the margin of error.
The margin of error (MOE) for a survey tells you how near you can expect the survey results to be to the correct population value. For example, a survey indicates that 72% of respondents favor Brand A over Brand B with a 3% margin of error. In this case, the actual population percentage that prefers Brand A likely falls within the range of 72% ± 3%, or 69 – 75%. [Read more…] about Margin of Error: Formula and Interpreting
- Go to Next Page »
Hypothesis Testing
About hypothesis testing.
Watch the video for a brief overview of hypothesis testing:

Can’t see the video? Click here to watch it on YouTube.
Contents (Click to skip to the section):
What is a Hypothesis?
What is hypothesis testing.
- Hypothesis Testing Examples (One Sample Z Test).
- Hypothesis Test on a Mean (TI 83).
Bayesian Hypothesis Testing.
- More Hypothesis Testing Articles
- Hypothesis Tests in One Picture
- Critical Values
What is the Null Hypothesis?
Need help with a homework problem? Check out our tutoring page!

A hypothesis is an educated guess about something in the world around you. It should be testable, either by experiment or observation. For example:
- A new medicine you think might work.
- A way of teaching you think might be better.
- A possible location of new species.
- A fairer way to administer standardized tests.
It can really be anything at all as long as you can put it to the test.
What is a Hypothesis Statement?
If you are going to propose a hypothesis, it’s customary to write a statement. Your statement will look like this: “If I…(do this to an independent variable )….then (this will happen to the dependent variable ).” For example:
- If I (decrease the amount of water given to herbs) then (the herbs will increase in size).
- If I (give patients counseling in addition to medication) then (their overall depression scale will decrease).
- If I (give exams at noon instead of 7) then (student test scores will improve).
- If I (look in this certain location) then (I am more likely to find new species).
A good hypothesis statement should:
- Include an “if” and “then” statement (according to the University of California).
- Include both the independent and dependent variables.
- Be testable by experiment, survey or other scientifically sound technique.
- Be based on information in prior research (either yours or someone else’s).
- Have design criteria (for engineering or programming projects).
Hypothesis testing can be one of the most confusing aspects for students, mostly because before you can even perform a test, you have to know what your null hypothesis is. Often, those tricky word problems that you are faced with can be difficult to decipher. But it’s easier than you think; all you need to do is:
- Figure out your null hypothesis,
- State your null hypothesis,
- Choose what kind of test you need to perform,
- Either support or reject the null hypothesis .
If you trace back the history of science, the null hypothesis is always the accepted fact. Simple examples of null hypotheses that are generally accepted as being true are:
- DNA is shaped like a double helix.
- There are 8 planets in the solar system (excluding Pluto).
- Taking Vioxx can increase your risk of heart problems (a drug now taken off the market).
How do I State the Null Hypothesis?
You won’t be required to actually perform a real experiment or survey in elementary statistics (or even disprove a fact like “Pluto is a planet”!), so you’ll be given word problems from real-life situations. You’ll need to figure out what your hypothesis is from the problem. This can be a little trickier than just figuring out what the accepted fact is. With word problems, you are looking to find a fact that is nullifiable (i.e. something you can reject).
Hypothesis Testing Examples #1: Basic Example
A researcher thinks that if knee surgery patients go to physical therapy twice a week (instead of 3 times), their recovery period will be longer. Average recovery times for knee surgery patients is 8.2 weeks.
The hypothesis statement in this question is that the researcher believes the average recovery time is more than 8.2 weeks. It can be written in mathematical terms as: H 1 : μ > 8.2
Next, you’ll need to state the null hypothesis . That’s what will happen if the researcher is wrong . In the above example, if the researcher is wrong then the recovery time is less than or equal to 8.2 weeks. In math, that’s: H 0 μ ≤ 8.2
Rejecting the null hypothesis
Ten or so years ago, we believed that there were 9 planets in the solar system. Pluto was demoted as a planet in 2006. The null hypothesis of “Pluto is a planet” was replaced by “Pluto is not a planet.” Of course, rejecting the null hypothesis isn’t always that easy— the hard part is usually figuring out what your null hypothesis is in the first place.
Hypothesis Testing Examples (One Sample Z Test)
The one sample z test isn’t used very often (because we rarely know the actual population standard deviation ). However, it’s a good idea to understand how it works as it’s one of the simplest tests you can perform in hypothesis testing. In English class you got to learn the basics (like grammar and spelling) before you could write a story; think of one sample z tests as the foundation for understanding more complex hypothesis testing. This page contains two hypothesis testing examples for one sample z-tests .
One Sample Hypothesis Testing Example: One Tailed Z Test
Watch the video for an example:

A principal at a certain school claims that the students in his school are above average intelligence. A random sample of thirty students IQ scores have a mean score of 112.5. Is there sufficient evidence to support the principal’s claim? The mean population IQ is 100 with a standard deviation of 15.
Step 1: State the Null hypothesis . The accepted fact is that the population mean is 100, so: H 0 : μ = 100.
Step 2: State the Alternate Hypothesis . The claim is that the students have above average IQ scores, so: H 1 : μ > 100. The fact that we are looking for scores “greater than” a certain point means that this is a one-tailed test.

Step 4: State the alpha level . If you aren’t given an alpha level , use 5% (0.05).
Step 5: Find the rejection region area (given by your alpha level above) from the z-table . An area of .05 is equal to a z-score of 1.645.

Step 6: If Step 6 is greater than Step 5, reject the null hypothesis. If it’s less than Step 5, you cannot reject the null hypothesis. In this case, it is more (4.56 > 1.645), so you can reject the null.
One Sample Hypothesis Testing Examples: #3
Watch the video for an example of a two-tailed z-test:
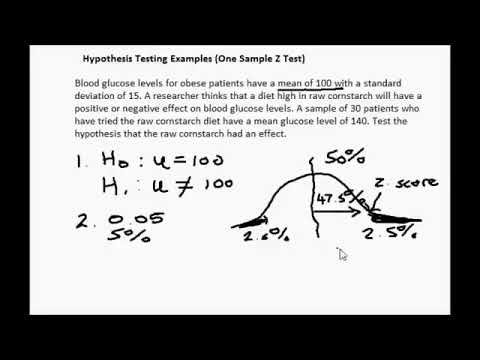
Blood glucose levels for obese patients have a mean of 100 with a standard deviation of 15. A researcher thinks that a diet high in raw cornstarch will have a positive or negative effect on blood glucose levels. A sample of 30 patients who have tried the raw cornstarch diet have a mean glucose level of 140. Test the hypothesis that the raw cornstarch had an effect.
- State the null hypothesis : H 0 :μ=100
- State the alternate hypothesis : H 1 :≠100
- State your alpha level. We’ll use 0.05 for this example. As this is a two-tailed test, split the alpha into two. 0.05/2=0.025
- Find the z-score associated with your alpha level . You’re looking for the area in one tail only . A z-score for 0.75(1-0.025=0.975) is 1.96. As this is a two-tailed test, you would also be considering the left tail (z = 1.96)
- If Step 5 is less than -1.96 or greater than 1.96 (Step 3), reject the null hypothesis . In this case, it is greater, so you can reject the null.
*This process is made much easier if you use a TI-83 or Excel to calculate the z-score (the “critical value”). See:
- Critical z value TI 83
- Z Score in Excel
Hypothesis Testing Examples: Mean (Using TI 83)
You can use the TI 83 calculator for hypothesis testing, but the calculator won’t figure out the null and alternate hypotheses; that’s up to you to read the question and input it into the calculator.
Example problem : A sample of 200 people has a mean age of 21 with a population standard deviation (σ) of 5. Test the hypothesis that the population mean is 18.9 at α = 0.05.
Step 1: State the null hypothesis. In this case, the null hypothesis is that the population mean is 18.9, so we write: H 0 : μ = 18.9
Step 2: State the alternative hypothesis. We want to know if our sample, which has a mean of 21 instead of 18.9, really is different from the population, therefore our alternate hypothesis: H 1 : μ ≠ 18.9
Step 3: Press Stat then press the right arrow twice to select TESTS.
Step 4: Press 1 to select 1:Z-Test… . Press ENTER.
Step 5: Use the right arrow to select Stats .
Step 6: Enter the data from the problem: μ 0 : 18.9 σ: 5 x : 21 n: 200 μ: ≠μ 0
Step 7: Arrow down to Calculate and press ENTER. The calculator shows the p-value: p = 2.87 × 10 -9
This is smaller than our alpha value of .05. That means we should reject the null hypothesis .
Bayesian Hypothesis Testing: What is it?

Bayesian hypothesis testing helps to answer the question: Can the results from a test or survey be repeated? Why do we care if a test can be repeated? Let’s say twenty people in the same village came down with leukemia. A group of researchers find that cell-phone towers are to blame. However, a second study found that cell-phone towers had nothing to do with the cancer cluster in the village. In fact, they found that the cancers were completely random. If that sounds impossible, it actually can happen! Clusters of cancer can happen simply by chance . There could be many reasons why the first study was faulty. One of the main reasons could be that they just didn’t take into account that sometimes things happen randomly and we just don’t know why.
It’s good science to let people know if your study results are solid, or if they could have happened by chance. The usual way of doing this is to test your results with a p-value . A p value is a number that you get by running a hypothesis test on your data. A P value of 0.05 (5%) or less is usually enough to claim that your results are repeatable. However, there’s another way to test the validity of your results: Bayesian Hypothesis testing. This type of testing gives you another way to test the strength of your results.
Traditional testing (the type you probably came across in elementary stats or AP stats) is called Non-Bayesian. It is how often an outcome happens over repeated runs of the experiment. It’s an objective view of whether an experiment is repeatable. Bayesian hypothesis testing is a subjective view of the same thing. It takes into account how much faith you have in your results. In other words, would you wager money on the outcome of your experiment?
Differences Between Traditional and Bayesian Hypothesis Testing.
Traditional testing (Non Bayesian) requires you to repeat sampling over and over, while Bayesian testing does not. The main different between the two is in the first step of testing: stating a probability model. In Bayesian testing you add prior knowledge to this step. It also requires use of a posterior probability , which is the conditional probability given to a random event after all the evidence is considered.
Arguments for Bayesian Testing.
Many researchers think that it is a better alternative to traditional testing, because it:
- Includes prior knowledge about the data.
- Takes into account personal beliefs about the results.
Arguments against.
- Including prior data or knowledge isn’t justifiable.
- It is difficult to calculate compared to non-Bayesian testing.
Back to top
Hypothesis Testing Articles
- What is Ad Hoc Testing?
- Composite Hypothesis Test
- What is a Rejection Region?
- What is a Two Tailed Test?
- How to Decide if a Hypothesis Test is a One Tailed Test or a Two Tailed Test.
- How to Decide if a Hypothesis is a Left Tailed Test or a Right-Tailed Test.
- How to State the Null Hypothesis in Statistics.
- How to Find a Critical Value .
- How to Support or Reject a Null Hypothesis.
Specific Tests:
- Brunner Munzel Test (Generalized Wilcoxon Test).
- Chi Square Test for Normality.
- Cochran-Mantel-Haenszel Test.
- Granger Causality Test .
- Hotelling’s T-Squared.
- KPSS Test .
- What is a Likelihood-Ratio Test?
- Log rank test .
- MANCOVA Assumptions.
- MANCOVA Sample Size.
- Marascuilo Procedure
- Rao’s Spacing Test
- Rayleigh test of uniformity.
- Sequential Probability Ratio Test.
- How to Run a Sign Test.
- T Test: one sample.
- T-Test: Two sample .
- Welch’s ANOVA .
- Welch’s Test for Unequal Variances .
- Z-Test: one sample .
- Z Test: Two Proportion.
- Wald Test .
Related Articles:
- What is an Acceptance Region?
- How to Calculate Chebyshev’s Theorem.
- Contrast Analysis
- Decision Rule.
- Degrees of Freedom .
- Directional Test
- False Discovery Rate
- How to calculate the Least Significant Difference.
- Levels in Statistics.
- How to Calculate Margin of Error.
- Mean Difference (Difference in Means)
- The Multiple Testing Problem .
- What is the Neyman-Pearson Lemma?
- What is an Omnibus Test?
- One Sample Median Test .
- How to Find a Sample Size (General Instructions).
- Sig 2(Tailed) meaning in results
- What is a Standardized Test Statistic?
- How to Find Standard Error
- Standardized values: Example.
- How to Calculate a T-Score.
- T-Score Vs. a Z.Score.
- Testing a Single Mean.
- Unequal Sample Sizes.
- Uniformly Most Powerful Tests.
- How to Calculate a Z-Score.
Have a language expert improve your writing
Run a free plagiarism check in 10 minutes, generate accurate citations for free.
- Knowledge Base
- Null and Alternative Hypotheses | Definitions & Examples
Null & Alternative Hypotheses | Definitions, Templates & Examples
Published on May 6, 2022 by Shaun Turney . Revised on June 22, 2023.
The null and alternative hypotheses are two competing claims that researchers weigh evidence for and against using a statistical test :
- Null hypothesis ( H 0 ): There’s no effect in the population .
- Alternative hypothesis ( H a or H 1 ) : There’s an effect in the population.
Table of contents
Answering your research question with hypotheses, what is a null hypothesis, what is an alternative hypothesis, similarities and differences between null and alternative hypotheses, how to write null and alternative hypotheses, other interesting articles, frequently asked questions.
The null and alternative hypotheses offer competing answers to your research question . When the research question asks “Does the independent variable affect the dependent variable?”:
- The null hypothesis ( H 0 ) answers “No, there’s no effect in the population.”
- The alternative hypothesis ( H a ) answers “Yes, there is an effect in the population.”
The null and alternative are always claims about the population. That’s because the goal of hypothesis testing is to make inferences about a population based on a sample . Often, we infer whether there’s an effect in the population by looking at differences between groups or relationships between variables in the sample. It’s critical for your research to write strong hypotheses .
You can use a statistical test to decide whether the evidence favors the null or alternative hypothesis. Each type of statistical test comes with a specific way of phrasing the null and alternative hypothesis. However, the hypotheses can also be phrased in a general way that applies to any test.
Receive feedback on language, structure, and formatting
Professional editors proofread and edit your paper by focusing on:
- Academic style
- Vague sentences
- Style consistency
See an example

The null hypothesis is the claim that there’s no effect in the population.
If the sample provides enough evidence against the claim that there’s no effect in the population ( p ≤ α), then we can reject the null hypothesis . Otherwise, we fail to reject the null hypothesis.
Although “fail to reject” may sound awkward, it’s the only wording that statisticians accept . Be careful not to say you “prove” or “accept” the null hypothesis.
Null hypotheses often include phrases such as “no effect,” “no difference,” or “no relationship.” When written in mathematical terms, they always include an equality (usually =, but sometimes ≥ or ≤).
You can never know with complete certainty whether there is an effect in the population. Some percentage of the time, your inference about the population will be incorrect. When you incorrectly reject the null hypothesis, it’s called a type I error . When you incorrectly fail to reject it, it’s a type II error.
Examples of null hypotheses
The table below gives examples of research questions and null hypotheses. There’s always more than one way to answer a research question, but these null hypotheses can help you get started.
| ( ) | ||
| Does tooth flossing affect the number of cavities? | Tooth flossing has on the number of cavities. | test: The mean number of cavities per person does not differ between the flossing group (µ ) and the non-flossing group (µ ) in the population; µ = µ . |
| Does the amount of text highlighted in the textbook affect exam scores? | The amount of text highlighted in the textbook has on exam scores. | : There is no relationship between the amount of text highlighted and exam scores in the population; β = 0. |
| Does daily meditation decrease the incidence of depression? | Daily meditation the incidence of depression.* | test: The proportion of people with depression in the daily-meditation group ( ) is greater than or equal to the no-meditation group ( ) in the population; ≥ . |
*Note that some researchers prefer to always write the null hypothesis in terms of “no effect” and “=”. It would be fine to say that daily meditation has no effect on the incidence of depression and p 1 = p 2 .
The alternative hypothesis ( H a ) is the other answer to your research question . It claims that there’s an effect in the population.
Often, your alternative hypothesis is the same as your research hypothesis. In other words, it’s the claim that you expect or hope will be true.
The alternative hypothesis is the complement to the null hypothesis. Null and alternative hypotheses are exhaustive, meaning that together they cover every possible outcome. They are also mutually exclusive, meaning that only one can be true at a time.
Alternative hypotheses often include phrases such as “an effect,” “a difference,” or “a relationship.” When alternative hypotheses are written in mathematical terms, they always include an inequality (usually ≠, but sometimes < or >). As with null hypotheses, there are many acceptable ways to phrase an alternative hypothesis.
Examples of alternative hypotheses
The table below gives examples of research questions and alternative hypotheses to help you get started with formulating your own.
| Does tooth flossing affect the number of cavities? | Tooth flossing has an on the number of cavities. | test: The mean number of cavities per person differs between the flossing group (µ ) and the non-flossing group (µ ) in the population; µ ≠ µ . |
| Does the amount of text highlighted in a textbook affect exam scores? | The amount of text highlighted in the textbook has an on exam scores. | : There is a relationship between the amount of text highlighted and exam scores in the population; β ≠ 0. |
| Does daily meditation decrease the incidence of depression? | Daily meditation the incidence of depression. | test: The proportion of people with depression in the daily-meditation group ( ) is less than the no-meditation group ( ) in the population; < . |
Null and alternative hypotheses are similar in some ways:
- They’re both answers to the research question.
- They both make claims about the population.
- They’re both evaluated by statistical tests.
However, there are important differences between the two types of hypotheses, summarized in the following table.
| A claim that there is in the population. | A claim that there is in the population. | |
|
| ||
| Equality symbol (=, ≥, or ≤) | Inequality symbol (≠, <, or >) | |
| Rejected | Supported | |
| Failed to reject | Not supported |
To help you write your hypotheses, you can use the template sentences below. If you know which statistical test you’re going to use, you can use the test-specific template sentences. Otherwise, you can use the general template sentences.
General template sentences
The only thing you need to know to use these general template sentences are your dependent and independent variables. To write your research question, null hypothesis, and alternative hypothesis, fill in the following sentences with your variables:
Does independent variable affect dependent variable ?
- Null hypothesis ( H 0 ): Independent variable does not affect dependent variable.
- Alternative hypothesis ( H a ): Independent variable affects dependent variable.
Test-specific template sentences
Once you know the statistical test you’ll be using, you can write your hypotheses in a more precise and mathematical way specific to the test you chose. The table below provides template sentences for common statistical tests.
| ( ) | ||
| test
with two groups | The mean dependent variable does not differ between group 1 (µ ) and group 2 (µ ) in the population; µ = µ . | The mean dependent variable differs between group 1 (µ ) and group 2 (µ ) in the population; µ ≠ µ . |
| with three groups | The mean dependent variable does not differ between group 1 (µ ), group 2 (µ ), and group 3 (µ ) in the population; µ = µ = µ . | The mean dependent variable of group 1 (µ ), group 2 (µ ), and group 3 (µ ) are not all equal in the population. |
| There is no correlation between independent variable and dependent variable in the population; ρ = 0. | There is a correlation between independent variable and dependent variable in the population; ρ ≠ 0. | |
| There is no relationship between independent variable and dependent variable in the population; β = 0. | There is a relationship between independent variable and dependent variable in the population; β ≠ 0. | |
| Two-proportions test | The dependent variable expressed as a proportion does not differ between group 1 ( ) and group 2 ( ) in the population; = . | The dependent variable expressed as a proportion differs between group 1 ( ) and group 2 ( ) in the population; ≠ . |
Note: The template sentences above assume that you’re performing one-tailed tests . One-tailed tests are appropriate for most studies.
If you want to know more about statistics , methodology , or research bias , make sure to check out some of our other articles with explanations and examples.
- Normal distribution
- Descriptive statistics
- Measures of central tendency
- Correlation coefficient
Methodology
- Cluster sampling
- Stratified sampling
- Types of interviews
- Cohort study
- Thematic analysis
Research bias
- Implicit bias
- Cognitive bias
- Survivorship bias
- Availability heuristic
- Nonresponse bias
- Regression to the mean
Hypothesis testing is a formal procedure for investigating our ideas about the world using statistics. It is used by scientists to test specific predictions, called hypotheses , by calculating how likely it is that a pattern or relationship between variables could have arisen by chance.
Null and alternative hypotheses are used in statistical hypothesis testing . The null hypothesis of a test always predicts no effect or no relationship between variables, while the alternative hypothesis states your research prediction of an effect or relationship.
The null hypothesis is often abbreviated as H 0 . When the null hypothesis is written using mathematical symbols, it always includes an equality symbol (usually =, but sometimes ≥ or ≤).
The alternative hypothesis is often abbreviated as H a or H 1 . When the alternative hypothesis is written using mathematical symbols, it always includes an inequality symbol (usually ≠, but sometimes < or >).
A research hypothesis is your proposed answer to your research question. The research hypothesis usually includes an explanation (“ x affects y because …”).
A statistical hypothesis, on the other hand, is a mathematical statement about a population parameter. Statistical hypotheses always come in pairs: the null and alternative hypotheses . In a well-designed study , the statistical hypotheses correspond logically to the research hypothesis.
Cite this Scribbr article
If you want to cite this source, you can copy and paste the citation or click the “Cite this Scribbr article” button to automatically add the citation to our free Citation Generator.
Turney, S. (2023, June 22). Null & Alternative Hypotheses | Definitions, Templates & Examples. Scribbr. Retrieved September 18, 2024, from https://www.scribbr.com/statistics/null-and-alternative-hypotheses/
Is this article helpful?

Shaun Turney
Other students also liked, inferential statistics | an easy introduction & examples, hypothesis testing | a step-by-step guide with easy examples, type i & type ii errors | differences, examples, visualizations, what is your plagiarism score.
Statistics Tutorial
Descriptive statistics, inferential statistics, stat reference, statistics - hypothesis testing.
Hypothesis testing is a formal way of checking if a hypothesis about a population is true or not.
Hypothesis Testing
A hypothesis is a claim about a population parameter .
A hypothesis test is a formal procedure to check if a hypothesis is true or not.
Examples of claims that can be checked:
The average height of people in Denmark is more than 170 cm.
The share of left handed people in Australia is not 10%.
The average income of dentists is less the average income of lawyers.
The Null and Alternative Hypothesis
Hypothesis testing is based on making two different claims about a population parameter.
The null hypothesis (\(H_{0} \)) and the alternative hypothesis (\(H_{1}\)) are the claims.
The two claims needs to be mutually exclusive , meaning only one of them can be true.
The alternative hypothesis is typically what we are trying to prove.
For example, we want to check the following claim:
"The average height of people in Denmark is more than 170 cm."
In this case, the parameter is the average height of people in Denmark (\(\mu\)).
The null and alternative hypothesis would be:
Null hypothesis : The average height of people in Denmark is 170 cm.
Alternative hypothesis : The average height of people in Denmark is more than 170 cm.
The claims are often expressed with symbols like this:
\(H_{0}\): \(\mu = 170 \: cm \)
\(H_{1}\): \(\mu > 170 \: cm \)
If the data supports the alternative hypothesis, we reject the null hypothesis and accept the alternative hypothesis.
If the data does not support the alternative hypothesis, we keep the null hypothesis.
Note: The alternative hypothesis is also referred to as (\(H_{A} \)).
The Significance Level
The significance level (\(\alpha\)) is the uncertainty we accept when rejecting the null hypothesis in the hypothesis test.
The significance level is a percentage probability of accidentally making the wrong conclusion.
Typical significance levels are:
- \(\alpha = 0.1\) (10%)
- \(\alpha = 0.05\) (5%)
- \(\alpha = 0.01\) (1%)
A lower significance level means that the evidence in the data needs to be stronger to reject the null hypothesis.
There is no "correct" significance level - it only states the uncertainty of the conclusion.
Note: A 5% significance level means that when we reject a null hypothesis:
We expect to reject a true null hypothesis 5 out of 100 times.
Advertisement
The Test Statistic
The test statistic is used to decide the outcome of the hypothesis test.
The test statistic is a standardized value calculated from the sample.
Standardization means converting a statistic to a well known probability distribution .
The type of probability distribution depends on the type of test.
Common examples are:
- Standard Normal Distribution (Z): used for Testing Population Proportions
- Student's T-Distribution (T): used for Testing Population Means
Note: You will learn how to calculate the test statistic for each type of test in the following chapters.
The Critical Value and P-Value Approach
There are two main approaches used for hypothesis tests:
- The critical value approach compares the test statistic with the critical value of the significance level.
- The p-value approach compares the p-value of the test statistic and with the significance level.
The Critical Value Approach
The critical value approach checks if the test statistic is in the rejection region .
The rejection region is an area of probability in the tails of the distribution.
The size of the rejection region is decided by the significance level (\(\alpha\)).
The value that separates the rejection region from the rest is called the critical value .
Here is a graphical illustration:
If the test statistic is inside this rejection region, the null hypothesis is rejected .
For example, if the test statistic is 2.3 and the critical value is 2 for a significance level (\(\alpha = 0.05\)):
We reject the null hypothesis (\(H_{0} \)) at 0.05 significance level (\(\alpha\))
The P-Value Approach
The p-value approach checks if the p-value of the test statistic is smaller than the significance level (\(\alpha\)).
The p-value of the test statistic is the area of probability in the tails of the distribution from the value of the test statistic.
If the p-value is smaller than the significance level, the null hypothesis is rejected .
The p-value directly tells us the lowest significance level where we can reject the null hypothesis.
For example, if the p-value is 0.03:
We reject the null hypothesis (\(H_{0} \)) at a 0.05 significance level (\(\alpha\))
We keep the null hypothesis (\(H_{0}\)) at a 0.01 significance level (\(\alpha\))
Note: The two approaches are only different in how they present the conclusion.
Steps for a Hypothesis Test
The following steps are used for a hypothesis test:
- Check the conditions
- Define the claims
- Decide the significance level
- Calculate the test statistic
One condition is that the sample is randomly selected from the population.
The other conditions depends on what type of parameter you are testing the hypothesis for.
Common parameters to test hypotheses are:
- Proportions (for qualitative data)
- Mean values (for numerical data)
You will learn the steps for both types in the following pages.

COLOR PICKER

Contact Sales
If you want to use W3Schools services as an educational institution, team or enterprise, send us an e-mail: [email protected]
Report Error
If you want to report an error, or if you want to make a suggestion, send us an e-mail: [email protected]
Top Tutorials
Top references, top examples, get certified.
Tutorial Playlist
Statistics tutorial, everything you need to know about the probability density function in statistics, the best guide to understand central limit theorem, an in-depth guide to measures of central tendency : mean, median and mode, the ultimate guide to understand conditional probability.
A Comprehensive Look at Percentile in Statistics
The Best Guide to Understand Bayes Theorem
Everything you need to know about the normal distribution, an in-depth explanation of cumulative distribution function, chi-square test, what is hypothesis testing in statistics types and examples, understanding the fundamentals of arithmetic and geometric progression, the definitive guide to understand spearman’s rank correlation, mean squared error: overview, examples, concepts and more, all you need to know about the empirical rule in statistics, the complete guide to skewness and kurtosis, a holistic look at bernoulli distribution.
All You Need to Know About Bias in Statistics
A Complete Guide to Get a Grasp of Time Series Analysis
The Key Differences Between Z-Test Vs. T-Test
The Complete Guide to Understand Pearson's Correlation
A complete guide on the types of statistical studies, everything you need to know about poisson distribution, your best guide to understand correlation vs. regression, the most comprehensive guide for beginners on what is correlation, hypothesis testing in statistics - types | examples.
Lesson 10 of 24 By Avijeet Biswal

Table of Contents
In today’s data-driven world, decisions are based on data all the time. Hypothesis plays a crucial role in that process, whether it may be making business decisions, in the health sector, academia, or in quality improvement. Without hypothesis and hypothesis tests, you risk drawing the wrong conclusions and making bad decisions. In this tutorial, you will look at Hypothesis Testing in Statistics.
What Is Hypothesis Testing in Statistics?
Hypothesis Testing is a type of statistical analysis in which you put your assumptions about a population parameter to the test. It is used to estimate the relationship between 2 statistical variables.
Let's discuss few examples of statistical hypothesis from real-life -
- A teacher assumes that 60% of his college's students come from lower-middle-class families.
- A doctor believes that 3D (Diet, Dose, and Discipline) is 90% effective for diabetic patients.
Now that you know about hypothesis testing, look at the two types of hypothesis testing in statistics.
The Ultimate Ticket to Top Data Science Job Roles
Importance of Hypothesis Testing in Data Analysis
Here is what makes hypothesis testing so important in data analysis and why it is key to making better decisions:
Avoiding Misleading Conclusions (Type I and Type II Errors)
One of the biggest benefits of hypothesis testing is that it helps you avoid jumping to the wrong conclusions. For instance, a Type I error could occur if a company launches a new product thinking it will be a hit, only to find out later that the data misled them. A Type II error might happen when a company overlooks a potentially successful product because their testing wasn’t thorough enough. By setting up the right significance level and carefully calculating the p-value, hypothesis testing minimizes the chances of these errors, leading to more accurate results.
Making Smarter Choices
Hypothesis testing is key to making smarter, evidence-based decisions. Let’s say a city planner wants to determine if building a new park will increase community engagement. By testing the hypothesis using data from similar projects, they can make an informed choice. Similarly, a teacher might use hypothesis testing to see if a new teaching method actually improves student performance. It’s about taking the guesswork out of decisions and relying on solid evidence instead.
Optimizing Business Tactics
In business, hypothesis testing is invaluable for testing new ideas and strategies before fully committing to them. For example, an e-commerce company might want to test whether offering free shipping increases sales. By using hypothesis testing, they can compare sales data from customers who received free shipping offers and those who didn’t. This allows them to base their business decisions on data, not hunches, reducing the risk of costly mistakes.
Hypothesis Testing Formula
Z = ( x̅ – μ0 ) / (σ /√n)
- Here, x̅ is the sample mean,
- μ0 is the population mean,
- σ is the standard deviation,
- n is the sample size.
How Hypothesis Testing Works?
An analyst performs hypothesis testing on a statistical sample to present evidence of the plausibility of the null hypothesis. Measurements and analyses are conducted on a random sample of the population to test a theory. Analysts use a random population sample to test two hypotheses: the null and alternative hypotheses.
The null hypothesis is typically an equality hypothesis between population parameters; for example, a null hypothesis may claim that the population means return equals zero. The alternate hypothesis is essentially the inverse of the null hypothesis (e.g., the population means the return is not equal to zero). As a result, they are mutually exclusive, and only one can be correct. One of the two possibilities, however, will always be correct.
Your Dream Career is Just Around The Corner!
Null Hypothesis and Alternative Hypothesis
The Null Hypothesis is the assumption that the event will not occur. A null hypothesis has no bearing on the study's outcome unless it is rejected.
H0 is the symbol for it, and it is pronounced H-naught.
The Alternate Hypothesis is the logical opposite of the null hypothesis. The acceptance of the alternative hypothesis follows the rejection of the null hypothesis. H1 is the symbol for it.
Let's understand this with an example.
A sanitizer manufacturer claims that its product kills 95 percent of germs on average.
To put this company's claim to the test, create a null and alternate hypothesis.
H0 (Null Hypothesis): Average = 95%.
Alternative Hypothesis (H1): The average is less than 95%.
Another straightforward example to understand this concept is determining whether or not a coin is fair and balanced. The null hypothesis states that the probability of a show of heads is equal to the likelihood of a show of tails. In contrast, the alternate theory states that the probability of a show of heads and tails would be very different.
Become a Data Scientist with Hands-on Training!
Hypothesis Testing Calculation With Examples
Let's consider a hypothesis test for the average height of women in the United States. Suppose our null hypothesis is that the average height is 5'4". We gather a sample of 100 women and determine their average height is 5'5". The standard deviation of population is 2.
To calculate the z-score, we would use the following formula:
z = ( x̅ – μ0 ) / (σ /√n)
z = (5'5" - 5'4") / (2" / √100)
z = 0.5 / (0.045)
We will reject the null hypothesis as the z-score of 11.11 is very large and conclude that there is evidence to suggest that the average height of women in the US is greater than 5'4".
Steps in Hypothesis Testing
Hypothesis testing is a statistical method to determine if there is enough evidence in a sample of data to infer that a certain condition is true for the entire population. Here’s a breakdown of the typical steps involved in hypothesis testing:
Formulate Hypotheses
- Null Hypothesis (H0): This hypothesis states that there is no effect or difference, and it is the hypothesis you attempt to reject with your test.
- Alternative Hypothesis (H1 or Ha): This hypothesis is what you might believe to be true or hope to prove true. It is usually considered the opposite of the null hypothesis.
Choose the Significance Level (α)
The significance level, often denoted by alpha (α), is the probability of rejecting the null hypothesis when it is true. Common choices for α are 0.05 (5%), 0.01 (1%), and 0.10 (10%).
Select the Appropriate Test
Choose a statistical test based on the type of data and the hypothesis. Common tests include t-tests, chi-square tests, ANOVA, and regression analysis. The selection depends on data type, distribution, sample size, and whether the hypothesis is one-tailed or two-tailed.
Collect Data
Gather the data that will be analyzed in the test. To infer conclusions accurately, this data should be representative of the population.
Calculate the Test Statistic
Based on the collected data and the chosen test, calculate a test statistic that reflects how much the observed data deviates from the null hypothesis.
Determine the p-value
The p-value is the probability of observing test results at least as extreme as the results observed, assuming the null hypothesis is correct. It helps determine the strength of the evidence against the null hypothesis.
Make a Decision
Compare the p-value to the chosen significance level:
- If the p-value ≤ α: Reject the null hypothesis, suggesting sufficient evidence in the data supports the alternative hypothesis.
- If the p-value > α: Do not reject the null hypothesis, suggesting insufficient evidence to support the alternative hypothesis.
Report the Results
Present the findings from the hypothesis test, including the test statistic, p-value, and the conclusion about the hypotheses.
Perform Post-hoc Analysis (if necessary)
Depending on the results and the study design, further analysis may be needed to explore the data more deeply or to address multiple comparisons if several hypotheses were tested simultaneously.
Types of Hypothesis Testing
To determine whether a discovery or relationship is statistically significant, hypothesis testing uses a z-test. It usually checks to see if two means are the same (the null hypothesis). Only when the population standard deviation is known and the sample size is 30 data points or more, can a z-test be applied.
A statistical test called a t-test is employed to compare the means of two groups. To determine whether two groups differ or if a procedure or treatment affects the population of interest, it is frequently used in hypothesis testing.
3. Chi-Square
You utilize a Chi-square test for hypothesis testing concerning whether your data is as predicted. To determine if the expected and observed results are well-fitted, the Chi-square test analyzes the differences between categorical variables from a random sample. The test's fundamental premise is that the observed values in your data should be compared to the predicted values that would be present if the null hypothesis were true.
ANOVA , or Analysis of Variance, is a statistical method used to compare the means of three or more groups. It’s particularly useful when you want to see if there are significant differences between multiple groups. For instance, in business, a company might use ANOVA to analyze whether three different stores are performing differently in terms of sales. It’s also widely used in fields like medical research and social sciences, where comparing group differences can provide valuable insights.
Hypothesis Testing and Confidence Intervals
Both confidence intervals and hypothesis tests are inferential techniques that depend on approximating the sample distribution. Data from a sample is used to estimate a population parameter using confidence intervals. Data from a sample is used in hypothesis testing to examine a given hypothesis. We must have a postulated parameter to conduct hypothesis testing.
Bootstrap distributions and randomization distributions are created using comparable simulation techniques. The observed sample statistic is the focal point of a bootstrap distribution, whereas the null hypothesis value is the focal point of a randomization distribution.
A variety of feasible population parameter estimates are included in confidence ranges. In this lesson, we created just two-tailed confidence intervals. There is a direct connection between these two-tail confidence intervals and these two-tail hypothesis tests. The results of a two-tailed hypothesis test and two-tailed confidence intervals typically provide the same results. In other words, a hypothesis test at the 0.05 level will virtually always fail to reject the null hypothesis if the 95% confidence interval contains the predicted value. A hypothesis test at the 0.05 level will nearly certainly reject the null hypothesis if the 95% confidence interval does not include the hypothesized parameter.
Become a Data Scientist through hands-on learning with hackathons, masterclasses, webinars, and Ask-Me-Anything sessions! Start learning!
Simple and Composite Hypothesis Testing
Depending on the population distribution, you can classify the statistical hypothesis into two types.
Simple Hypothesis: A simple hypothesis specifies an exact value for the parameter.
Composite Hypothesis: A composite hypothesis specifies a range of values.
A company is claiming that their average sales for this quarter are 1000 units. This is an example of a simple hypothesis.
Suppose the company claims that the sales are in the range of 900 to 1000 units. Then this is a case of a composite hypothesis.
One-Tailed and Two-Tailed Hypothesis Testing
The One-Tailed test, also called a directional test, considers a critical region of data that would result in the null hypothesis being rejected if the test sample falls into it, inevitably meaning the acceptance of the alternate hypothesis.
In a one-tailed test, the critical distribution area is one-sided, meaning the test sample is either greater or lesser than a specific value.
In two tails, the test sample is checked to be greater or less than a range of values in a Two-Tailed test, implying that the critical distribution area is two-sided.
If the sample falls within this range, the alternate hypothesis will be accepted, and the null hypothesis will be rejected.
Become a Data Scientist With Real-World Experience
Right Tailed Hypothesis Testing
If the larger than (>) sign appears in your hypothesis statement, you are using a right-tailed test, also known as an upper test. Or, to put it another way, the disparity is to the right. For instance, you can contrast the battery life before and after a change in production. Your hypothesis statements can be the following if you want to know if the battery life is longer than the original (let's say 90 hours):
- The null hypothesis is (H0 <= 90) or less change.
- A possibility is that battery life has risen (H1) > 90.
The crucial point in this situation is that the alternate hypothesis (H1), not the null hypothesis, decides whether you get a right-tailed test.
Left Tailed Hypothesis Testing
Alternative hypotheses that assert the true value of a parameter is lower than the null hypothesis are tested with a left-tailed test; they are indicated by the asterisk "<".
Suppose H0: mean = 50 and H1: mean not equal to 50
According to the H1, the mean can be greater than or less than 50. This is an example of a Two-tailed test.
In a similar manner, if H0: mean >=50, then H1: mean <50
Here the mean is less than 50. It is called a One-tailed test.
Type 1 and Type 2 Error
A hypothesis test can result in two types of errors.
Type 1 Error: A Type-I error occurs when sample results reject the null hypothesis despite being true.
Type 2 Error: A Type-II error occurs when the null hypothesis is not rejected when it is false, unlike a Type-I error.
Suppose a teacher evaluates the examination paper to decide whether a student passes or fails.
H0: Student has passed
H1: Student has failed
Type I error will be the teacher failing the student [rejects H0] although the student scored the passing marks [H0 was true].
Type II error will be the case where the teacher passes the student [do not reject H0] although the student did not score the passing marks [H1 is true].
Serious About Success? Don't Settle for Less
Practice Problems on Hypothesis Testing
Here are the practice problems on hypothesis testing that will help you understand how to apply these concepts in real-world scenarios:
A telecom service provider claims that customers spend an average of ₹400 per month, with a standard deviation of ₹25. However, a random sample of 50 customer bills shows a mean of ₹250 and a standard deviation of ₹15. Does this sample data support the service provider’s claim?
Solution: Let’s break this down:
- Null Hypothesis (H0): The average amount spent per month is ₹400.
- Alternate Hypothesis (H1): The average amount spent per month is not ₹400.
- Population Standard Deviation (σ): ₹25
- Sample Size (n): 50
- Sample Mean (x̄): ₹250
1. Calculate the z-value:
z=250-40025/50 −42.42
2. Compare with critical z-values: For a 5% significance level, critical z-values are -1.96 and +1.96. Since -42.42 is far outside this range, we reject the null hypothesis. The sample data suggests that the average amount spent is significantly different from ₹400.
Out of 850 customers, 400 made online grocery purchases. Can we conclude that more than 50% of customers are moving towards online grocery shopping?
Solution: Here’s how to approach it:
- Proportion of customers who shopped online (p): 400 / 850 = 0.47
- Null Hypothesis (H0): The proportion of online shoppers is 50% or more.
- Alternate Hypothesis (H1): The proportion of online shoppers is less than 50%.
- Sample Size (n): 850
- Significance Level (α): 5%
z=p-PP(1-P)/n
z=0.47-0.500.50.5/850 −1.74
2. Compare with the critical z-value: For a 5% significance level (one-tailed test), the critical z-value is -1.645. Since -1.74 is less than -1.645, we reject the null hypothesis. This means the data does not support the idea that most customers are moving towards online grocery shopping.
In a study of code quality, Team A has 250 errors in 1000 lines of code, and Team B has 300 errors in 800 lines of code. Can we say Team B performs worse than Team A?
Solution: Let’s analyze it:
- Proportion of errors for Team A (pA): 250 / 1000 = 0.25
- Proportion of errors for Team B (pB): 300 / 800 = 0.375
- Null Hypothesis (H0): Team B’s error rate is less than or equal to Team A’s.
- Alternate Hypothesis (H1): Team B’s error rate is greater than Team A’s.
- Sample Size for Team A (nA): 1000
- Sample Size for Team B (nB): 800
p=nApA+nBpBnA+nB
p=10000.25+8000.3751000+800 ≈ 0.305
z=pA−pBp(1-p)(1nA+1nB)
z=0.25−0.3750.305(1-0.305) (11000+1800) ≈ −5.72
2. Compare with the critical z-value: For a 5% significance level (one-tailed test), the critical z-value is +1.645. Since -5.72 is far less than +1.645, we reject the null hypothesis. The data indicates that Team B’s performance is significantly worse than Team A’s.
Our Data Scientist Master's Program will help you master core topics such as R, Python, Machine Learning, Tableau, Hadoop, and Spark. Get started on your journey today!
Applications of Hypothesis Testing
Apart from the practical problems, let's look at the real-world applications of hypothesis testing across various fields:
Medicine and Healthcare
In medicine, hypothesis testing plays a pivotal role in assessing the success of new treatments. For example, researchers may want to find out if a new exercise regimen improves heart health. By comparing data from patients who followed the program to those who didn’t, they can determine if the exercise significantly improves health outcomes. Such rigorous testing allows medical professionals to rely on proven methods rather than assumptions.
Quality Control and Manufacturing
In manufacturing, ensuring product quality is vital, and hypothesis testing helps maintain those standards. Suppose a beverage company introduces a new bottling process and wants to verify if it reduces contamination. By analyzing samples from the new and old processes, hypothesis testing can reveal whether the new method reduces the risk of contamination. This allows manufacturers to implement improvements that enhance product safety and quality confidently.
Education and Learning
In education and learning, hypothesis testing is a tool to evaluate the impact of innovative teaching techniques. Imagine a situation where teachers introduce project-based learning to boost critical thinking skills. By comparing the performance of students who engaged in project-based learning with those in traditional settings, educators can test their hypothesis. The results can help educators make informed choices about adopting new teaching strategies.
Environmental Science
Hypothesis testing is essential in environmental science for evaluating the effectiveness of conservation measures. For example, scientists might explore whether a new water management strategy improves river health. By collecting and comparing data on water quality before and after the implementation of the strategy, they can determine whether the intervention leads to positive changes. Such findings are crucial for guiding environmental decisions that have long-term impacts.
Marketing and Advertising
In marketing, businesses use hypothesis testing to refine their approaches. For instance, a clothing brand might test if offering limited-time discounts increases customer loyalty. By running campaigns with and without the discount and analyzing the outcomes, they can assess if the strategy boosts customer retention. Data-driven insights from hypothesis testing enable companies to design marketing strategies that resonate with their audience and drive growth.
Limitations of Hypothesis Testing
Hypothesis testing has some limitations that researchers should be aware of:
- It cannot prove or establish the truth: Hypothesis testing provides evidence to support or reject a hypothesis, but it cannot confirm the absolute truth of the research question.
- Results are sample-specific: Hypothesis testing is based on analyzing a sample from a population, and the conclusions drawn are specific to that particular sample.
- Possible errors: During hypothesis testing, there is a chance of committing type I error (rejecting a true null hypothesis) or type II error (failing to reject a false null hypothesis).
- Assumptions and requirements: Different tests have specific assumptions and requirements that must be met to accurately interpret results.
Learn All The Tricks Of The BI Trade
After reading this tutorial, you would have a much better understanding of hypothesis testing, one of the most important concepts in the field of Data Science . The majority of hypotheses are based on speculation about observed behavior, natural phenomena, or established theories.
If you are interested in statistics of data science and skills needed for such a career, you ought to explore the Post Graduate Program in Data Science.
1. What is hypothesis testing in statistics with example?
Hypothesis testing is a statistical method used to determine if there is enough evidence in a sample data to draw conclusions about a population. It involves formulating two competing hypotheses, the null hypothesis (H0) and the alternative hypothesis (Ha), and then collecting data to assess the evidence. An example: testing if a new drug improves patient recovery (Ha) compared to the standard treatment (H0) based on collected patient data.
2. What is H0 and H1 in statistics?
In statistics, H0 and H1 represent the null and alternative hypotheses. The null hypothesis, H0, is the default assumption that no effect or difference exists between groups or conditions. The alternative hypothesis, H1, is the competing claim suggesting an effect or a difference. Statistical tests determine whether to reject the null hypothesis in favor of the alternative hypothesis based on the data.
3. What is a simple hypothesis with an example?
A simple hypothesis is a specific statement predicting a single relationship between two variables. It posits a direct and uncomplicated outcome. For example, a simple hypothesis might state, "Increased sunlight exposure increases the growth rate of sunflowers." Here, the hypothesis suggests a direct relationship between the amount of sunlight (independent variable) and the growth rate of sunflowers (dependent variable), with no additional variables considered.
4. What are the 3 major types of hypothesis?
The three major types of hypotheses are:
- Null Hypothesis (H0): Represents the default assumption, stating that there is no significant effect or relationship in the data.
- Alternative Hypothesis (Ha): Contradicts the null hypothesis and proposes a specific effect or relationship that researchers want to investigate.
- Nondirectional Hypothesis: An alternative hypothesis that doesn't specify the direction of the effect, leaving it open for both positive and negative possibilities.
5. What software tools can assist with hypothesis testing?
Several software tools offering distinct features can help with hypothesis testing. R and RStudio are popular for their advanced statistical capabilities. The Python ecosystem, including libraries like SciPy and Statsmodels, also supports hypothesis testing. SAS and SPSS are well-established tools for comprehensive statistical analysis. For basic testing, Excel offers simple built-in functions.
6. How do I interpret the results of a hypothesis test?
Interpreting hypothesis test results involves comparing the p-value to the significance level (alpha). If the p-value is less than or equal to alpha, you can reject the null hypothesis, indicating statistical significance. This suggests that the observed effect is unlikely to have occurred by chance, validating your analysis findings.
7. Why is sample size important in hypothesis testing?
Sample size is crucial in hypothesis testing as it affects the test’s power. A larger sample size increases the likelihood of detecting a true effect, reducing the risk of Type II errors. Conversely, a small sample may lack the statistical power needed to identify differences, potentially leading to inaccurate conclusions.
8. Can hypothesis testing be used for non-numerical data?
Yes, hypothesis testing can be applied to non-numerical data through non-parametric tests. These tests are ideal when data doesn't meet parametric assumptions or when dealing with categorical data. Non-parametric tests, like the Chi-square or Mann-Whitney U test, provide robust methods for analyzing non-numerical data and drawing meaningful conclusions.
9. How do I choose the proper hypothesis test?
Selecting the right hypothesis test depends on several factors: the objective of your analysis, the type of data (numerical or categorical), and the sample size. Consider whether you're comparing means, proportions, or associations, and whether your data follows a normal distribution. The correct choice ensures accurate results tailored to your research question.
Find our PL-300 Microsoft Power BI Certification Training Online Classroom training classes in top cities:
| Name | Date | Place | |
|---|---|---|---|
| 12 Oct -27 Oct 2024, Weekend batch | Your City | ||
| 26 Oct -10 Nov 2024, Weekend batch | Your City | ||
| 9 Nov -24 Nov 2024, Weekend batch | Your City |
About the Author
Avijeet is a Senior Research Analyst at Simplilearn. Passionate about Data Analytics, Machine Learning, and Deep Learning, Avijeet is also interested in politics, cricket, and football.
Recommended Resources
Free eBook: Top Programming Languages For A Data Scientist
Normality Test in Minitab: Minitab with Statistics
Machine Learning Career Guide: A Playbook to Becoming a Machine Learning Engineer
- PMP, PMI, PMBOK, CAPM, PgMP, PfMP, ACP, PBA, RMP, SP, and OPM3 are registered marks of the Project Management Institute, Inc.

User Preferences
Content preview.
Arcu felis bibendum ut tristique et egestas quis:
- Ut enim ad minim veniam, quis nostrud exercitation ullamco laboris
- Duis aute irure dolor in reprehenderit in voluptate
- Excepteur sint occaecat cupidatat non proident
Keyboard Shortcuts
6a.2 - steps for hypothesis tests, the logic of hypothesis testing section .
A hypothesis, in statistics, is a statement about a population parameter, where this statement typically is represented by some specific numerical value. In testing a hypothesis, we use a method where we gather data in an effort to gather evidence about the hypothesis.
How do we decide whether to reject the null hypothesis?
- If the sample data are consistent with the null hypothesis, then we do not reject it.
- If the sample data are inconsistent with the null hypothesis, but consistent with the alternative, then we reject the null hypothesis and conclude that the alternative hypothesis is true.
Six Steps for Hypothesis Tests Section
In hypothesis testing, there are certain steps one must follow. Below these are summarized into six such steps to conducting a test of a hypothesis.
- Set up the hypotheses and check conditions : Each hypothesis test includes two hypotheses about the population. One is the null hypothesis, notated as \(H_0 \), which is a statement of a particular parameter value. This hypothesis is assumed to be true until there is evidence to suggest otherwise. The second hypothesis is called the alternative, or research hypothesis, notated as \(H_a \). The alternative hypothesis is a statement of a range of alternative values in which the parameter may fall. One must also check that any conditions (assumptions) needed to run the test have been satisfied e.g. normality of data, independence, and number of success and failure outcomes.
- Decide on the significance level, \(\alpha \): This value is used as a probability cutoff for making decisions about the null hypothesis. This alpha value represents the probability we are willing to place on our test for making an incorrect decision in regards to rejecting the null hypothesis. The most common \(\alpha \) value is 0.05 or 5%. Other popular choices are 0.01 (1%) and 0.1 (10%).
- Calculate the test statistic: Gather sample data and calculate a test statistic where the sample statistic is compared to the parameter value. The test statistic is calculated under the assumption the null hypothesis is true and incorporates a measure of standard error and assumptions (conditions) related to the sampling distribution.
- Calculate probability value (p-value), or find the rejection region: A p-value is found by using the test statistic to calculate the probability of the sample data producing such a test statistic or one more extreme. The rejection region is found by using alpha to find a critical value; the rejection region is the area that is more extreme than the critical value. We discuss the p-value and rejection region in more detail in the next section.
- Make a decision about the null hypothesis: In this step, we decide to either reject the null hypothesis or decide to fail to reject the null hypothesis. Notice we do not make a decision where we will accept the null hypothesis.
- State an overall conclusion : Once we have found the p-value or rejection region, and made a statistical decision about the null hypothesis (i.e. we will reject the null or fail to reject the null), we then want to summarize our results into an overall conclusion for our test.
We will follow these six steps for the remainder of this Lesson. In the future Lessons, the steps will be followed but may not be explained explicitly.
Step 1 is a very important step to set up correctly. If your hypotheses are incorrect, your conclusion will be incorrect. In this next section, we practice with Step 1 for the one sample situations.
- How to Conduct Hypothesis Testing in Statistics
The Fundamentals of Hypothesis Testing: What Every Student Should Know

Hypothesis testing is a fundamental statistical technique used to make inferences about populations based on sample data. This blog will guide you through the process of hypothesis testing, helping you understand and apply the concepts to solve similar assignments efficiently. By following this structured approach, you'll be able to solve your hypothesis testing homework problem with confidence.
Understanding the Basics of Hypothesis Testing
Hypothesis testing involves making a decision about the validity of a hypothesis based on sample data. It comprises four key steps: defining hypotheses, calculating the test statistic, determining the p-value, and drawing conclusions. Let's explore each of these steps in detail.
Defining Hypotheses
The first step in hypothesis testing is to define the null and alternative hypotheses. These hypotheses represent the statements we want to test.
Null Hypothesis (H0)

The null hypothesis (H0) is a statement that there is no effect or difference. It serves as the default assumption that we aim to test against.
Alternative Hypothesis (Ha or H1)
The alternative hypothesis (Ha or H1) is a statement that indicates the presence of an effect or difference. It represents what we want to prove.
Types of Tests
Depending on the direction of the hypothesis, we have three types of tests: left-tailed, right-tailed, and two-tailed tests.
Left-Tailed Test
A left-tailed test is used when we want to determine if the population mean is less than a specified value.
Right-Tailed Test
A right-tailed test is used when we want to determine if the population mean is greater than a specified value.
Two-Tailed Test
A two-tailed test is used when we want to determine if the population mean is different from a specified value, either higher or lower.
Example Scenario
Consider a scenario where we want to test if the average vehicle price from a sample is less than $27,000. We would set up our hypotheses as follows:
- Null Hypothesis (H0): μ = 27,000
- Alternative Hypothesis (Ha): μ < 27,000
Calculating the Test Statistic
Once the hypotheses are defined, the next step is to calculate the test statistic. The test statistic helps us determine the likelihood of observing the sample data under the null hypothesis.
Formula for the T-Test Statistic
The t-test statistic is calculated using the formula:
[ t = \frac{\bar{X} - \mu}{S / \sqrt{n}} ]
- (\bar{X}) is the sample mean
- (S) is the sample standard deviation
- (n) is the sample size
- (\mu) is the population mean defined in the null hypothesis
Standard Error
The denominator of the t-test formula, (S / \sqrt{n}), is known as the standard error (SE). It measures the variability of the sample mean.
Example Calculation
Let's calculate the test statistic for our vehicle price example. Given:
- Sample mean ((\bar{X})) = 25,650
- Sample standard deviation (S) = 3,488
- Sample size (n) = 10
- Population mean ((\mu)) = 27,000
First, we calculate the standard error (SE):
[ SE = \frac{S}{\sqrt{n}} = \frac{3488}{\sqrt{10}} \approx 1103 ]
Next, we calculate the test statistic (t):
[ t = \frac{25650 - 27000}{1103} \approx -1.2238 ]
Determining the P-Value
The p-value is a critical component of hypothesis testing. It indicates the probability of obtaining a test statistic as extreme as the one observed, assuming the null hypothesis is true.
Calculating the P-Value
The method to calculate the p-value depends on the type of test (left-tailed, right-tailed, or two-tailed) and the direction of the alternative hypothesis.
For a left-tailed test, the p-value is calculated using the T.DIST() function in Excel.
For a right-tailed test, the p-value is calculated using the T.DIST.RT() function in Excel.
For a two-tailed test, the p-value is calculated using the T.DIST.2T() function in Excel. When the test statistic is negative, use the absolute value function (ABS()) to remove the negative sign before calculating the p-value.
For our vehicle price example with a left-tailed test, we calculate the p-value using the T.DIST() function in Excel:
[ \text{p-value} = T.DIST(-1.2238, 9, TRUE) \approx 0.1261 ]
Drawing Conclusions
The final step in hypothesis testing is to draw a conclusion based on the p-value and a pre-determined significance level ((\alpha)).
Significance Level ((\alpha))
The significance level ((\alpha)) is the threshold for deciding whether to reject the null hypothesis. Common values for (\alpha) are 0.05, 0.01, 0.10, and 0.005.
Decision Rule
- If the p-value is less than (\alpha), we reject the null hypothesis.
- If the p-value is greater than (\alpha), we fail to reject the null hypothesis.
Example Conclusion
For our vehicle price example with (\alpha = 0.05):
- p-value = 0.1261
- (\alpha) = 0.05
Since 0.1261 > 0.05, we fail to reject the null hypothesis. There is not enough evidence to suggest that the average vehicle price is less than $27,000.
Practical Examples of Hypothesis Testing
To further illustrate hypothesis testing, let's explore three different scenarios: left-tailed test, right-tailed test, and two-tailed test.
Left-Tailed Test Example
In this example, we test if the average vehicle price is less than $27,000.
Step-by-Step Process
Define Hypotheses:
Calculate Test Statistic:
- Standard error (SE) = 1103
- Test statistic (t) = -1.2238
Determine P-Value:
Draw Conclusion:
- Since 0.1261 > 0.05, fail to reject the null hypothesis.
- Conclusion: There is not enough evidence to suggest that the average vehicle price is less than $27,000.
Right-Tailed Test Example
In this example, we test if the average vehicle price is greater than $23,500.
- Null Hypothesis (H0): μ = 23,500
- Alternative Hypothesis (Ha): μ > 23,500
- Population mean ((\mu)) = 23,500
- Test statistic (t) = 1.9490
- p-value = 0.0416
- Since 0.0416 < 0.05, reject the null hypothesis.
- Conclusion: There is enough evidence to suggest that the average vehicle price is greater than $23,500.
Two-Tailed Test Example
In this example, we test if the average vehicle price is different from $23,500.
- Alternative Hypothesis (Ha): μ ≠ 23,500
- p-value = 0.0831
- Since 0.0831 > 0.05, fail to reject the null hypothesis.
- Conclusion: There is not enough evidence to suggest that the average vehicle price is different from $23,500.
Tips for Conducting Hypothesis Testing
Successfully conducting hypothesis testing involves several critical steps. Here are some tips to help you perform hypothesis testing effectively.
Proper Data Collection
Accurate and reliable data collection is crucial for hypothesis testing. Ensure that your sample is representative of the population and collected using appropriate methods.
Random Sampling
Use random sampling techniques to avoid bias and ensure that your sample accurately represents the population.
Sample Size
Ensure that your sample size is large enough to provide reliable results. Larger sample sizes reduce the margin of error and increase the power of the test.
Verify Assumptions
Hypothesis tests often rely on certain assumptions about the data. Verify these assumptions before proceeding with the test.
Many hypothesis tests, including the t-test, assume that the data follows a normal distribution. Use graphical methods (e.g., histograms, Q-Q plots) or statistical tests (e.g., Shapiro-Wilk test) to check for normality.
Independence
Ensure that the observations in your sample are independent of each other. Independence is a key assumption for most hypothesis tests.
Utilize Software Tools
Software tools like Excel , R , and SPSS can simplify the calculations involved in hypothesis testing and reduce the risk of errors.
Excel provides several functions for hypothesis testing, such as T.DIST(), T.DIST.RT(), and T.DIST.2T(). Use these functions to calculate p-values and make decisions based on your test statistics.
R is a powerful statistical software that offers various packages for hypothesis testing. Use functions like t.test() to perform t-tests and obtain p-values and confidence intervals.
Interpret Results Carefully
Proper interpretation of the results is crucial for drawing accurate conclusions from hypothesis testing.
Statistical Significance
A statistically significant result (p-value < (\alpha)) indicates that there is strong evidence against the null hypothesis. However, it does not imply practical significance. Consider the context and the practical implications of the results.
Type I and Type II Errors
Be aware of the potential for Type I and Type II errors. A Type I error occurs when the null hypothesis is incorrectly rejected, while a Type II error occurs when the null hypothesis is not rejected despite being false. The significance level ((\alpha)) affects the probability of Type I errors, while the sample size and effect size influence the probability of Type II errors.
Report Results Transparently
When reporting the results of hypothesis testing, include all relevant information to ensure transparency and reproducibility.
Detailed Description
Provide a detailed description of the hypotheses, test statistic, p-value, significance level, and the conclusion. This information helps others understand and evaluate your analysis.
Confidence Intervals
Include confidence intervals for the estimated parameters. Confidence intervals provide a range of plausible values for the population parameter and offer additional context for interpreting the results.
Common Pitfalls in Hypothesis Testing
Hypothesis testing is a powerful tool, but it is essential to be aware of common pitfalls to avoid incorrect conclusions.
Misinterpreting P-Values
P-values indicate the probability of obtaining a test statistic as extreme as the one observed, assuming the null hypothesis is true. A small p-value suggests strong evidence against the null hypothesis, but it does not provide a measure of the effect size or practical significance.
P-Value Misconceptions
Avoid common misconceptions about p-values, such as believing that a p-value of 0.05 means there is a 5% chance that the null hypothesis is true. P-values do not measure the probability that the null hypothesis is true or false.
Ignoring Assumptions
Ignoring the assumptions underlying hypothesis tests can lead to incorrect conclusions. Always verify the assumptions before proceeding with the test.
Assumption Violations
If the assumptions are violated, consider using alternative tests that do not rely on those assumptions. For example, if the data is not normally distributed, use non-parametric tests like the Wilcoxon rank-sum test or the Mann-Whitney U test.
Overemphasizing Statistical Significance
Statistical significance does not imply practical significance. A result can be statistically significant but have a negligible practical effect. Always consider the context and practical implications of the results.
Effect Size
Report and interpret effect sizes alongside p-values. Effect sizes provide a measure of the magnitude of the observed effect and offer valuable context for interpreting the results.
Hypothesis testing is a critical tool in statistics for making inferences about populations based on sample data. By understanding the steps involved—defining hypotheses, calculating the test statistic, determining the p-value, and drawing conclusions—you can approach hypothesis testing with confidence.
Ensure proper data collection, verify assumptions, utilize software tools, interpret results carefully, and report findings transparently to enhance the reliability and validity of your hypothesis tests. By avoiding common pitfalls and considering both statistical and practical significance, you'll be well-equipped to tackle statistics homework and research projects effectively.
Post a comment...
How to conduct hypothesis testing in statistics submit your homework, attached files.
| File | Actions |
|---|

- Books, Journals, Papers
- Guides & How To’s
- Life Around The World
- Research Methods
- Functionalism
- Postmodernism
- Social Constructionism
- Structuralism
- Symbolic Interactionism
- Sociology Theorists
- General Sociology
- Social Policy
- Social Work
- Sociology of Childhood
- Sociology of Crime & Deviance
- Sociology of Art
- Sociology of Dance
- Sociology of Food
- Sociology of Sport
- Sociology of Disability
- Sociology of Economics
- Sociology of Education
- Sociology of Emotion
- Sociology of Family & Relationships
- Sociology of Gender
- Sociology of Health
- Sociology of Identity
- Sociology of Ideology
- Sociology of Inequalities
- Sociology of Knowledge
- Sociology of Language
- Sociology of Law
- Sociology of Anime
- Sociology of Film
- Sociology of Gaming
- Sociology of Literature
- Sociology of Music
- Sociology of TV
- Sociology of Migration
- Sociology of Nature & Environment
- Sociology of Politics
- Sociology of Power
- Sociology of Race & Ethnicity
- Sociology of Religion
- Sociology of Sexuality
- Sociology of Social Movements
- Sociology of Technology
- Sociology of the Life Course
- Sociology of Travel & Tourism
- Sociology of Violence & Conflict
- Sociology of Work
- Urban Sociology
- Changing Relationships Within Families
- Conjugal Role Relationships
- Criticisms of Families
- Family Forms
- Functions of the Family
- Featured Articles
- Privacy Policy
- Terms & Conditions
What is a Hypothesis?

Table of Contents
Defining the hypothesis, the role of a hypothesis in the scientific method, types of hypotheses, hypothesis formulation, hypotheses and variables.
- The Importance of Testing Hypotheses
- The Hypothesis and Sociological Theory
In sociology, as in other scientific disciplines, the hypothesis serves as a crucial building block for research. It is a central element that directs the inquiry and provides a framework for testing the relationships between social phenomena. This article will explore what a hypothesis is, how it is formulated, and its role within the broader scientific method. By understanding the hypothesis, students of sociology can grasp how sociologists construct and test theories about the social world.
A hypothesis is a specific, testable statement about the relationship between two or more variables. It acts as a proposed explanation or prediction based on limited evidence, which researchers then test through empirical investigation. In essence, it is a statement that can be supported or refuted by data gathered from observation, experimentation, or other forms of systematic inquiry. The hypothesis typically takes the form of an “if-then” statement: if one variable changes, then another will change in response.
In sociological research, a hypothesis helps to focus the investigation by offering a clear proposition that can be tested. For instance, a sociologist might hypothesize that an increase in education levels leads to a decrease in crime rates. This hypothesis gives the researcher a direction, guiding them to collect data on education and crime, and analyze the relationship between the two variables. By doing so, the hypothesis serves as a tool for making sense of complex social phenomena.
The hypothesis is a key component of the scientific method, which is the systematic process by which sociologists and other scientists investigate the world. The scientific method begins with an observation of the world, followed by the formulation of a question or problem. Based on prior knowledge, theory, or preliminary observations, researchers then develop a hypothesis, which predicts an outcome or proposes a relationship between variables.
Once a hypothesis is established, researchers gather data to test it. If the data supports the hypothesis, it may be used to build a broader theory or to further refine the understanding of the social phenomenon in question. If the data contradicts the hypothesis, researchers may revise their hypothesis or abandon it altogether, depending on the strength of the evidence. In either case, the hypothesis helps to organize the research process, ensuring that it remains focused and methodologically sound.
In sociology, this method is particularly important because the social world is highly complex. Researchers must navigate a vast range of variables—age, gender, class, race, education, and countless others—that interact in unpredictable ways. A well-constructed hypothesis allows sociologists to narrow their focus to a manageable set of variables, making the investigation more precise and efficient.
Sociologists use different types of hypotheses, depending on the nature of their research question and the methods they plan to use. Broadly speaking, hypotheses can be classified into two main types: null hypotheses and alternative (or research) hypotheses.
Null Hypothesis
The null hypothesis, denoted as H0, states that there is no relationship between the variables being studied. It is a default assumption that any observed differences or relationships are due to random chance rather than a real underlying cause. In research, the null hypothesis serves as a point of comparison. Researchers collect data to see if the results allow them to reject the null hypothesis in favor of an alternative explanation.
For example, a sociologist studying the relationship between income and political participation might propose a null hypothesis that income has no effect on political participation. The goal of the research would then be to determine whether this null hypothesis can be rejected based on the data. If the data shows a significant correlation between income and political participation, the null hypothesis would be rejected.
Alternative Hypothesis
The alternative hypothesis, denoted as H1 or Ha, proposes that there is a significant relationship between the variables. This is the hypothesis that researchers aim to support with their data. In contrast to the null hypothesis, the alternative hypothesis predicts a specific direction or effect. For example, a researcher might hypothesize that higher levels of education lead to greater political engagement. In this case, the alternative hypothesis is proposing a positive correlation between the two variables.
The alternative hypothesis is the one that guides the research design, as it directs the researcher toward gathering evidence that will either support or refute the predicted relationship. The research process is structured around testing this hypothesis and determining whether the evidence is strong enough to reject the null hypothesis.
The process of formulating a hypothesis is both an art and a science. It requires a deep understanding of the social phenomena under investigation, as well as a clear sense of what is possible to observe and measure. Hypothesis formulation is closely linked to the theoretical framework that guides the research. Sociologists draw on existing theories to generate hypotheses, ensuring that their predictions are grounded in established knowledge.
To formulate a good hypothesis, a researcher must identify the key variables and determine how they are expected to relate to one another. Variables are the factors or characteristics that are being measured in a study. In sociology, these variables often include social attributes such as class, race, gender, age, education, and income, as well as behavioral variables like voting, criminal activity, or social participation.
For example, a sociologist studying the effects of social media on self-esteem might propose the following hypothesis: “Increased time spent on social media leads to lower levels of self-esteem among adolescents.” Here, the independent variable is the time spent on social media, and the dependent variable is the level of self-esteem. The hypothesis predicts a negative relationship between the two variables: as time spent on social media increases, self-esteem decreases.
A strong hypothesis has several key characteristics. It should be clear and specific, meaning that it unambiguously states the relationship between the variables. It should also be testable, meaning that it can be supported or refuted through empirical investigation. Finally, it should be grounded in theory, meaning that it is based on existing knowledge about the social phenomenon in question.
Membership Required
You must be a member to access this content.
View Membership Levels
Mr Edwards has a PhD in sociology and 10 years of experience in sociological knowledge
Related Articles

Exploring Discourse Analysis: Language and Social Reality
Discourse analysis is a multidisciplinary approach that examines the ways in which language is used to construct meaning, shape social...

Empiricism in Sociology
Empiricism is a fundamental concept in sociology and the broader social sciences, rooted in the belief that knowledge comes from...
GET THE LATEST SOCIOLOGY
How would you rate the content on Easy Sociology?
Recommended

Propaganda Art: The Intersection of Art and Ideology

How Neoliberalism Imposes a False Consciousness
24 hour trending.

Symbolic Interactionism: Understanding Symbols
Robert merton’s strain theory: understanding societal pressure and deviance, functionalism: a sociological perspective, understanding conflict theories in sociology, the connection between education and social stratification.
Easy Sociology makes sociology as easy as possible. Our aim is to make sociology accessible for everybody. © 2023 Easy Sociology
© 2023 Easy Sociology
IMAGES
VIDEO
COMMENTS
5.2 - Writing Hypotheses. The first step in conducting a hypothesis test is to write the hypothesis statements that are going to be tested. For each test you will have a null hypothesis (H 0) and an alternative hypothesis (H a). When writing hypotheses there are three things that we need to know: (1) the parameter that we are testing (2) the ...
Table of contents. Step 1: State your null and alternate hypothesis. Step 2: Collect data. Step 3: Perform a statistical test. Step 4: Decide whether to reject or fail to reject your null hypothesis. Step 5: Present your findings. Other interesting articles. Frequently asked questions about hypothesis testing.
5. Phrase your hypothesis in three ways. To identify the variables, you can write a simple prediction in if…then form. The first part of the sentence states the independent variable and the second part states the dependent variable. If a first-year student starts attending more lectures, then their exam scores will improve.
Alternative Hypothesis (H1): The average battery life is not 500 hours. 2. Choose the Test. Explanation: Pick a statistical test that fits your data and your hypotheses. Different tests are used for various kinds of data. Example: Since you're comparing the average battery life, you use a one-sample t-test. 3.
Formulate the Hypotheses: Write your research hypotheses as a null hypothesis (H 0) and an alternative hypothesis (H A).; Data Collection: Gather data specifically aimed at testing the hypothesis.; Conduct A Test: Use a suitable statistical test to analyze your data.; Make a Decision: Based on the statistical test results, decide whether to reject the null hypothesis or fail to reject it.
Hypothesis testing is a crucial procedure to perform when you want to make inferences about a population using a random sample. These inferences include estimating population properties such as the mean, differences between means, proportions, and the relationships between variables. This post provides an overview of statistical hypothesis testing.
In hypothesis testing, the goal is to see if there is sufficient statistical evidence to reject a presumed null hypothesis in favor of a conjectured alternative hypothesis.The null hypothesis is usually denoted \(H_0\) while the alternative hypothesis is usually denoted \(H_1\). An hypothesis test is a statistical decision; the conclusion will either be to reject the null hypothesis in favor ...
The null hypothesis has the same parameter and number with an equal sign. H0: μ = $30, 000 HA: μ> $30, 000. b. x = number od students who like math. p = proportion of students who like math. The guess is that p < 0.10 and that is the alternative hypothesis. H0: p = 0.10 HA: p <0.10. c. x = age of students in this class.
S.3 Hypothesis Testing. In reviewing hypothesis tests, we start first with the general idea. Then, we keep returning to the basic procedures of hypothesis testing, each time adding a little more detail. The general idea of hypothesis testing involves: Making an initial assumption. Collecting evidence (data).
Using the p-value to make the decision. The p-value represents how likely we would be to observe such an extreme sample if the null hypothesis were true. The p-value is a probability computed assuming the null hypothesis is true, that the test statistic would take a value as extreme or more extreme than that actually observed. Since it's a probability, it is a number between 0 and 1.
Hypothesis Tests. A hypothesis test consists of five steps: 1. State the hypotheses. State the null and alternative hypotheses. These two hypotheses need to be mutually exclusive, so if one is true then the other must be false. 2. Determine a significance level to use for the hypothesis. Decide on a significance level.
What is Hypothesis Testing? Hypothesis testing in statistics uses sample data to infer the properties of a whole population.These tests determine whether a random sample provides sufficient evidence to conclude an effect or relationship exists in the population. Researchers use them to help separate genuine population-level effects from false effects that random chance can create in samples.
Step 2: State the Alternate Hypothesis. The claim is that the students have above average IQ scores, so: H 1: μ > 100. The fact that we are looking for scores "greater than" a certain point means that this is a one-tailed test. Step 3: Draw a picture to help you visualize the problem. Step 4: State the alpha level.
Step 1: State the Null Hypothesis. The null hypothesis can be thought of as the opposite of the "guess" the researchers made: in this example, the biologist thinks the plant height will be different for the fertilizers. So the null would be that there will be no difference among the groups of plants. Specifically, in more statistical language ...
The null hypothesis (H0) answers "No, there's no effect in the population.". The alternative hypothesis (Ha) answers "Yes, there is an effect in the population.". The null and alternative are always claims about the population. That's because the goal of hypothesis testing is to make inferences about a population based on a sample.
Revision notes on Introduction to Hypothesis Testing for the College Board AP® Statistics syllabus, written by the Statistics experts at Save My Exams.
Step 1: State the Null Hypothesis. The null hypothesis can be thought of as the opposite of the "guess" the researchers made. In the example presented in the previous section, the biologist "guesses" plant height will be different for the various fertilizers. So the null hypothesis would be that there will be no difference among the groups of ...
The term "hypothesis" may make you think about science, where we investigate a hypothesis. This is along the right track. In statistics, a hypothesis test calculates some quantity under a given assumption. The result of the test allows us to interpret whether the assumption holds or whether the assumption has been violated.
Hypothesis testing is based on making two different claims about a population parameter. The null hypothesis (H 0) and the alternative hypothesis (H 1) are the claims. The two claims needs to be mutually exclusive, meaning only one of them can be true. The alternative hypothesis is typically what we are trying to prove.
Hypothesis plays a crucial role in that process, whether it may be making business decisions, in the health sector, academia, or in quality improvement. Without hypothesis and hypothesis tests, you risk drawing the wrong conclusions and making bad decisions. In this tutorial, you will look at Hypothesis Testing in Statistics.
This statistics video tutorial provides a basic introduction into hypothesis testing. It provides examples and practice problems that explains how to state ...
Make a decision about the null hypothesis: In this step, we decide to either reject the null hypothesis or decide to fail to reject the null hypothesis. Notice we do not make a decision where we will accept the null hypothesis. State an overall conclusion: Once we have found the p-value or rejection region, and made a statistical decision about ...
The null hypothesis (H0) is a statement that there is no effect or difference. It serves as the default assumption that we aim to test against. Alternative Hypothesis (Ha or H1) The alternative hypothesis (Ha or H1) is a statement that indicates the presence of an effect or difference. It represents what we want to prove. Types of Tests
H 0 (Null Hypothesis): Population parameter =, ≤, ≥ some value. H A (Alternative Hypothesis): Population parameter <, >, ≠ some value. Note that the null hypothesis always contains the equal sign. We interpret the hypotheses as follows: Null hypothesis: The sample data provides no evidence to support some claim being made by an individual.
By doing so, the hypothesis serves as a tool for making sense of complex social phenomena. The Role of a Hypothesis in the Scientific Method. The hypothesis is a key component of the scientific method, which is the systematic process by which sociologists and other scientists investigate the world. The scientific method begins with an ...