- Privacy Policy
Home » Descriptive Research Design – Types, Methods and Examples

Descriptive Research Design – Types, Methods and Examples
Table of Contents

Descriptive Research Design
Definition:
Descriptive research design is a type of research methodology that aims to describe or document the characteristics, behaviors, attitudes, opinions, or perceptions of a group or population being studied.
Descriptive research design does not attempt to establish cause-and-effect relationships between variables or make predictions about future outcomes. Instead, it focuses on providing a detailed and accurate representation of the data collected, which can be useful for generating hypotheses, exploring trends, and identifying patterns in the data.
Types of Descriptive Research Design
Types of Descriptive Research Design are as follows:
Cross-sectional Study
This involves collecting data at a single point in time from a sample or population to describe their characteristics or behaviors. For example, a researcher may conduct a cross-sectional study to investigate the prevalence of certain health conditions among a population, or to describe the attitudes and beliefs of a particular group.
Longitudinal Study
This involves collecting data over an extended period of time, often through repeated observations or surveys of the same group or population. Longitudinal studies can be used to track changes in attitudes, behaviors, or outcomes over time, or to investigate the effects of interventions or treatments.
This involves an in-depth examination of a single individual, group, or situation to gain a detailed understanding of its characteristics or dynamics. Case studies are often used in psychology, sociology, and business to explore complex phenomena or to generate hypotheses for further research.
Survey Research
This involves collecting data from a sample or population through standardized questionnaires or interviews. Surveys can be used to describe attitudes, opinions, behaviors, or demographic characteristics of a group, and can be conducted in person, by phone, or online.
Observational Research
This involves observing and documenting the behavior or interactions of individuals or groups in a natural or controlled setting. Observational studies can be used to describe social, cultural, or environmental phenomena, or to investigate the effects of interventions or treatments.
Correlational Research
This involves examining the relationships between two or more variables to describe their patterns or associations. Correlational studies can be used to identify potential causal relationships or to explore the strength and direction of relationships between variables.
Data Analysis Methods
Descriptive research design data analysis methods depend on the type of data collected and the research question being addressed. Here are some common methods of data analysis for descriptive research:
Descriptive Statistics
This method involves analyzing data to summarize and describe the key features of a sample or population. Descriptive statistics can include measures of central tendency (e.g., mean, median, mode) and measures of variability (e.g., range, standard deviation).
Cross-tabulation
This method involves analyzing data by creating a table that shows the frequency of two or more variables together. Cross-tabulation can help identify patterns or relationships between variables.
Content Analysis
This method involves analyzing qualitative data (e.g., text, images, audio) to identify themes, patterns, or trends. Content analysis can be used to describe the characteristics of a sample or population, or to identify factors that influence attitudes or behaviors.
Qualitative Coding
This method involves analyzing qualitative data by assigning codes to segments of data based on their meaning or content. Qualitative coding can be used to identify common themes, patterns, or categories within the data.
Visualization
This method involves creating graphs or charts to represent data visually. Visualization can help identify patterns or relationships between variables and make it easier to communicate findings to others.
Comparative Analysis
This method involves comparing data across different groups or time periods to identify similarities and differences. Comparative analysis can help describe changes in attitudes or behaviors over time or differences between subgroups within a population.
Applications of Descriptive Research Design
Descriptive research design has numerous applications in various fields. Some of the common applications of descriptive research design are:
- Market research: Descriptive research design is widely used in market research to understand consumer preferences, behavior, and attitudes. This helps companies to develop new products and services, improve marketing strategies, and increase customer satisfaction.
- Health research: Descriptive research design is used in health research to describe the prevalence and distribution of a disease or health condition in a population. This helps healthcare providers to develop prevention and treatment strategies.
- Educational research: Descriptive research design is used in educational research to describe the performance of students, schools, or educational programs. This helps educators to improve teaching methods and develop effective educational programs.
- Social science research: Descriptive research design is used in social science research to describe social phenomena such as cultural norms, values, and beliefs. This helps researchers to understand social behavior and develop effective policies.
- Public opinion research: Descriptive research design is used in public opinion research to understand the opinions and attitudes of the general public on various issues. This helps policymakers to develop effective policies that are aligned with public opinion.
- Environmental research: Descriptive research design is used in environmental research to describe the environmental conditions of a particular region or ecosystem. This helps policymakers and environmentalists to develop effective conservation and preservation strategies.
Descriptive Research Design Examples
Here are some real-time examples of descriptive research designs:
- A restaurant chain wants to understand the demographics and attitudes of its customers. They conduct a survey asking customers about their age, gender, income, frequency of visits, favorite menu items, and overall satisfaction. The survey data is analyzed using descriptive statistics and cross-tabulation to describe the characteristics of their customer base.
- A medical researcher wants to describe the prevalence and risk factors of a particular disease in a population. They conduct a cross-sectional study in which they collect data from a sample of individuals using a standardized questionnaire. The data is analyzed using descriptive statistics and cross-tabulation to identify patterns in the prevalence and risk factors of the disease.
- An education researcher wants to describe the learning outcomes of students in a particular school district. They collect test scores from a representative sample of students in the district and use descriptive statistics to calculate the mean, median, and standard deviation of the scores. They also create visualizations such as histograms and box plots to show the distribution of scores.
- A marketing team wants to understand the attitudes and behaviors of consumers towards a new product. They conduct a series of focus groups and use qualitative coding to identify common themes and patterns in the data. They also create visualizations such as word clouds to show the most frequently mentioned topics.
- An environmental scientist wants to describe the biodiversity of a particular ecosystem. They conduct an observational study in which they collect data on the species and abundance of plants and animals in the ecosystem. The data is analyzed using descriptive statistics to describe the diversity and richness of the ecosystem.
How to Conduct Descriptive Research Design
To conduct a descriptive research design, you can follow these general steps:
- Define your research question: Clearly define the research question or problem that you want to address. Your research question should be specific and focused to guide your data collection and analysis.
- Choose your research method: Select the most appropriate research method for your research question. As discussed earlier, common research methods for descriptive research include surveys, case studies, observational studies, cross-sectional studies, and longitudinal studies.
- Design your study: Plan the details of your study, including the sampling strategy, data collection methods, and data analysis plan. Determine the sample size and sampling method, decide on the data collection tools (such as questionnaires, interviews, or observations), and outline your data analysis plan.
- Collect data: Collect data from your sample or population using the data collection tools you have chosen. Ensure that you follow ethical guidelines for research and obtain informed consent from participants.
- Analyze data: Use appropriate statistical or qualitative analysis methods to analyze your data. As discussed earlier, common data analysis methods for descriptive research include descriptive statistics, cross-tabulation, content analysis, qualitative coding, visualization, and comparative analysis.
- I nterpret results: Interpret your findings in light of your research question and objectives. Identify patterns, trends, and relationships in the data, and describe the characteristics of your sample or population.
- Draw conclusions and report results: Draw conclusions based on your analysis and interpretation of the data. Report your results in a clear and concise manner, using appropriate tables, graphs, or figures to present your findings. Ensure that your report follows accepted research standards and guidelines.
When to Use Descriptive Research Design
Descriptive research design is used in situations where the researcher wants to describe a population or phenomenon in detail. It is used to gather information about the current status or condition of a group or phenomenon without making any causal inferences. Descriptive research design is useful in the following situations:
- Exploratory research: Descriptive research design is often used in exploratory research to gain an initial understanding of a phenomenon or population.
- Identifying trends: Descriptive research design can be used to identify trends or patterns in a population, such as changes in consumer behavior or attitudes over time.
- Market research: Descriptive research design is commonly used in market research to understand consumer preferences, behavior, and attitudes.
- Health research: Descriptive research design is useful in health research to describe the prevalence and distribution of a disease or health condition in a population.
- Social science research: Descriptive research design is used in social science research to describe social phenomena such as cultural norms, values, and beliefs.
- Educational research: Descriptive research design is used in educational research to describe the performance of students, schools, or educational programs.
Purpose of Descriptive Research Design
The main purpose of descriptive research design is to describe and measure the characteristics of a population or phenomenon in a systematic and objective manner. It involves collecting data that describe the current status or condition of the population or phenomenon of interest, without manipulating or altering any variables.
The purpose of descriptive research design can be summarized as follows:
- To provide an accurate description of a population or phenomenon: Descriptive research design aims to provide a comprehensive and accurate description of a population or phenomenon of interest. This can help researchers to develop a better understanding of the characteristics of the population or phenomenon.
- To identify trends and patterns: Descriptive research design can help researchers to identify trends and patterns in the data, such as changes in behavior or attitudes over time. This can be useful for making predictions and developing strategies.
- To generate hypotheses: Descriptive research design can be used to generate hypotheses or research questions that can be tested in future studies. For example, if a descriptive study finds a correlation between two variables, this could lead to the development of a hypothesis about the causal relationship between the variables.
- To establish a baseline: Descriptive research design can establish a baseline or starting point for future research. This can be useful for comparing data from different time periods or populations.
Characteristics of Descriptive Research Design
Descriptive research design has several key characteristics that distinguish it from other research designs. Some of the main characteristics of descriptive research design are:
- Objective : Descriptive research design is objective in nature, which means that it focuses on collecting factual and accurate data without any personal bias. The researcher aims to report the data objectively without any personal interpretation.
- Non-experimental: Descriptive research design is non-experimental, which means that the researcher does not manipulate any variables. The researcher simply observes and records the behavior or characteristics of the population or phenomenon of interest.
- Quantitative : Descriptive research design is quantitative in nature, which means that it involves collecting numerical data that can be analyzed using statistical techniques. This helps to provide a more precise and accurate description of the population or phenomenon.
- Cross-sectional: Descriptive research design is often cross-sectional, which means that the data is collected at a single point in time. This can be useful for understanding the current state of the population or phenomenon, but it may not provide information about changes over time.
- Large sample size: Descriptive research design typically involves a large sample size, which helps to ensure that the data is representative of the population of interest. A large sample size also helps to increase the reliability and validity of the data.
- Systematic and structured: Descriptive research design involves a systematic and structured approach to data collection, which helps to ensure that the data is accurate and reliable. This involves using standardized procedures for data collection, such as surveys, questionnaires, or observation checklists.
Advantages of Descriptive Research Design
Descriptive research design has several advantages that make it a popular choice for researchers. Some of the main advantages of descriptive research design are:
- Provides an accurate description: Descriptive research design is focused on accurately describing the characteristics of a population or phenomenon. This can help researchers to develop a better understanding of the subject of interest.
- Easy to conduct: Descriptive research design is relatively easy to conduct and requires minimal resources compared to other research designs. It can be conducted quickly and efficiently, and data can be collected through surveys, questionnaires, or observations.
- Useful for generating hypotheses: Descriptive research design can be used to generate hypotheses or research questions that can be tested in future studies. For example, if a descriptive study finds a correlation between two variables, this could lead to the development of a hypothesis about the causal relationship between the variables.
- Large sample size : Descriptive research design typically involves a large sample size, which helps to ensure that the data is representative of the population of interest. A large sample size also helps to increase the reliability and validity of the data.
- Can be used to monitor changes : Descriptive research design can be used to monitor changes over time in a population or phenomenon. This can be useful for identifying trends and patterns, and for making predictions about future behavior or attitudes.
- Can be used in a variety of fields : Descriptive research design can be used in a variety of fields, including social sciences, healthcare, business, and education.
Limitation of Descriptive Research Design
Descriptive research design also has some limitations that researchers should consider before using this design. Some of the main limitations of descriptive research design are:
- Cannot establish cause and effect: Descriptive research design cannot establish cause and effect relationships between variables. It only provides a description of the characteristics of the population or phenomenon of interest.
- Limited generalizability: The results of a descriptive study may not be generalizable to other populations or situations. This is because descriptive research design often involves a specific sample or situation, which may not be representative of the broader population.
- Potential for bias: Descriptive research design can be subject to bias, particularly if the researcher is not objective in their data collection or interpretation. This can lead to inaccurate or incomplete descriptions of the population or phenomenon of interest.
- Limited depth: Descriptive research design may provide a superficial description of the population or phenomenon of interest. It does not delve into the underlying causes or mechanisms behind the observed behavior or characteristics.
- Limited utility for theory development: Descriptive research design may not be useful for developing theories about the relationship between variables. It only provides a description of the variables themselves.
- Relies on self-report data: Descriptive research design often relies on self-report data, such as surveys or questionnaires. This type of data may be subject to biases, such as social desirability bias or recall bias.
About the author

Muhammad Hassan
Researcher, Academic Writer, Web developer
You may also like

Survey Research – Types, Methods, Examples

Basic Research – Types, Methods and Examples

Experimental Design – Types, Methods, Guide

Observational Research – Methods and Guide

Correlational Research – Methods, Types and...

Ethnographic Research -Types, Methods and Guide
Educational resources and simple solutions for your research journey

What is Descriptive Research? Definition, Methods, Types and Examples
Descriptive research is a methodological approach that seeks to depict the characteristics of a phenomenon or subject under investigation. In scientific inquiry, it serves as a foundational tool for researchers aiming to observe, record, and analyze the intricate details of a particular topic. This method provides a rich and detailed account that aids in understanding, categorizing, and interpreting the subject matter.
Descriptive research design is widely employed across diverse fields, and its primary objective is to systematically observe and document all variables and conditions influencing the phenomenon.
After this descriptive research definition, let’s look at this example. Consider a researcher working on climate change adaptation, who wants to understand water management trends in an arid village in a specific study area. She must conduct a demographic survey of the region, gather population data, and then conduct descriptive research on this demographic segment. The study will then uncover details on “what are the water management practices and trends in village X.” Note, however, that it will not cover any investigative information about “why” the patterns exist.
Table of Contents
What is descriptive research?
If you’ve been wondering “What is descriptive research,” we’ve got you covered in this post! In a nutshell, descriptive research is an exploratory research method that helps a researcher describe a population, circumstance, or phenomenon. It can help answer what , where , when and how questions, but not why questions. In other words, it does not involve changing the study variables and does not seek to establish cause-and-effect relationships.

Importance of descriptive research
Now, let’s delve into the importance of descriptive research. This research method acts as the cornerstone for various academic and applied disciplines. Its primary significance lies in its ability to provide a comprehensive overview of a phenomenon, enabling researchers to gain a nuanced understanding of the variables at play. This method aids in forming hypotheses, generating insights, and laying the groundwork for further in-depth investigations. The following points further illustrate its importance:
Provides insights into a population or phenomenon: Descriptive research furnishes a comprehensive overview of the characteristics and behaviors of a specific population or phenomenon, thereby guiding and shaping the research project.
Offers baseline data: The data acquired through this type of research acts as a reference for subsequent investigations, laying the groundwork for further studies.
Allows validation of sampling methods: Descriptive research validates sampling methods, aiding in the selection of the most effective approach for the study.
Helps reduce time and costs: It is cost-effective and time-efficient, making this an economical means of gathering information about a specific population or phenomenon.
Ensures replicability: Descriptive research is easily replicable, ensuring a reliable way to collect and compare information from various sources.
When to use descriptive research design?
Determining when to use descriptive research depends on the nature of the research question. Before diving into the reasons behind an occurrence, understanding the how, when, and where aspects is essential. Descriptive research design is a suitable option when the research objective is to discern characteristics, frequencies, trends, and categories without manipulating variables. It is therefore often employed in the initial stages of a study before progressing to more complex research designs. To put it in another way, descriptive research precedes the hypotheses of explanatory research. It is particularly valuable when there is limited existing knowledge about the subject.
Some examples are as follows, highlighting that these questions would arise before a clear outline of the research plan is established:
- In the last two decades, what changes have occurred in patterns of urban gardening in Mumbai?
- What are the differences in climate change perceptions of farmers in coastal versus inland villages in the Philippines?
Characteristics of descriptive research
Coming to the characteristics of descriptive research, this approach is characterized by its focus on observing and documenting the features of a subject. Specific characteristics are as below.
- Quantitative nature: Some descriptive research types involve quantitative research methods to gather quantifiable information for statistical analysis of the population sample.
- Qualitative nature: Some descriptive research examples include those using the qualitative research method to describe or explain the research problem.
- Observational nature: This approach is non-invasive and observational because the study variables remain untouched. Researchers merely observe and report, without introducing interventions that could impact the subject(s).
- Cross-sectional nature: In descriptive research, different sections belonging to the same group are studied, providing a “snapshot” of sorts.
- Springboard for further research: The data collected are further studied and analyzed using different research techniques. This approach helps guide the suitable research methods to be employed.
Types of descriptive research
There are various descriptive research types, each suited to different research objectives. Take a look at the different types below.
- Surveys: This involves collecting data through questionnaires or interviews to gather qualitative and quantitative data.
- Observational studies: This involves observing and collecting data on a particular population or phenomenon without influencing the study variables or manipulating the conditions. These may be further divided into cohort studies, case studies, and cross-sectional studies:
- Cohort studies: Also known as longitudinal studies, these studies involve the collection of data over an extended period, allowing researchers to track changes and trends.
- Case studies: These deal with a single individual, group, or event, which might be rare or unusual.
- Cross-sectional studies : A researcher collects data at a single point in time, in order to obtain a snapshot of a specific moment.
- Focus groups: In this approach, a small group of people are brought together to discuss a topic. The researcher moderates and records the group discussion. This can also be considered a “participatory” observational method.
- Descriptive classification: Relevant to the biological sciences, this type of approach may be used to classify living organisms.
Descriptive research methods
Several descriptive research methods can be employed, and these are more or less similar to the types of approaches mentioned above.
- Surveys: This method involves the collection of data through questionnaires or interviews. Surveys may be done online or offline, and the target subjects might be hyper-local, regional, or global.
- Observational studies: These entail the direct observation of subjects in their natural environment. These include case studies, dealing with a single case or individual, as well as cross-sectional and longitudinal studies, for a glimpse into a population or changes in trends over time, respectively. Participatory observational studies such as focus group discussions may also fall under this method.
Researchers must carefully consider descriptive research methods, types, and examples to harness their full potential in contributing to scientific knowledge.
Examples of descriptive research
Now, let’s consider some descriptive research examples.
- In social sciences, an example could be a study analyzing the demographics of a specific community to understand its socio-economic characteristics.
- In business, a market research survey aiming to describe consumer preferences would be a descriptive study.
- In ecology, a researcher might undertake a survey of all the types of monocots naturally occurring in a region and classify them up to species level.
These examples showcase the versatility of descriptive research across diverse fields.
Advantages of descriptive research
There are several advantages to this approach, which every researcher must be aware of. These are as follows:
- Owing to the numerous descriptive research methods and types, primary data can be obtained in diverse ways and be used for developing a research hypothesis .
- It is a versatile research method and allows flexibility.
- Detailed and comprehensive information can be obtained because the data collected can be qualitative or quantitative.
- It is carried out in the natural environment, which greatly minimizes certain types of bias and ethical concerns.
- It is an inexpensive and efficient approach, even with large sample sizes
Disadvantages of descriptive research
On the other hand, this design has some drawbacks as well:
- It is limited in its scope as it does not determine cause-and-effect relationships.
- The approach does not generate new information and simply depends on existing data.
- Study variables are not manipulated or controlled, and this limits the conclusions to be drawn.
- Descriptive research findings may not be generalizable to other populations.
- Finally, it offers a preliminary understanding rather than an in-depth understanding.
To reiterate, the advantages of descriptive research lie in its ability to provide a comprehensive overview, aid hypothesis generation, and serve as a preliminary step in the research process. However, its limitations include a potential lack of depth, inability to establish cause-and-effect relationships, and susceptibility to bias.
Frequently asked questions
When should researchers conduct descriptive research.
Descriptive research is most appropriate when researchers aim to portray and understand the characteristics of a phenomenon without manipulating variables. It is particularly valuable in the early stages of a study.
What is the difference between descriptive and exploratory research?
Descriptive research focuses on providing a detailed depiction of a phenomenon, while exploratory research aims to explore and generate insights into an issue where little is known.
What is the difference between descriptive and experimental research?
Descriptive research observes and documents without manipulating variables, whereas experimental research involves intentional interventions to establish cause-and-effect relationships.
Is descriptive research only for social sciences?
No, various descriptive research types may be applicable to all fields of study, including social science, humanities, physical science, and biological science.
How important is descriptive research?
The importance of descriptive research lies in its ability to provide a glimpse of the current state of a phenomenon, offering valuable insights and establishing a basic understanding. Further, the advantages of descriptive research include its capacity to offer a straightforward depiction of a situation or phenomenon, facilitate the identification of patterns or trends, and serve as a useful starting point for more in-depth investigations. Additionally, descriptive research can contribute to the development of hypotheses and guide the formulation of research questions for subsequent studies.
Editage All Access is a subscription-based platform that unifies the best AI tools and services designed to speed up, simplify, and streamline every step of a researcher’s journey. The Editage All Access Pack is a one-of-a-kind subscription that unlocks full access to an AI writing assistant, literature recommender, journal finder, scientific illustration tool, and exclusive discounts on professional publication services from Editage.
Based on 22+ years of experience in academia, Editage All Access empowers researchers to put their best research forward and move closer to success. Explore our top AI Tools pack, AI Tools + Publication Services pack, or Build Your Own Plan. Find everything a researcher needs to succeed, all in one place – Get All Access now starting at just $14 a month !
Related Posts

What are the Best Research Funding Sources

Inductive vs. Deductive Research Approach
Have a language expert improve your writing
Run a free plagiarism check in 10 minutes, automatically generate references for free.
- Knowledge Base
- Methodology
- Descriptive Research Design | Definition, Methods & Examples
Descriptive Research Design | Definition, Methods & Examples
Published on 5 May 2022 by Shona McCombes . Revised on 10 October 2022.
Descriptive research aims to accurately and systematically describe a population, situation or phenomenon. It can answer what , where , when , and how questions , but not why questions.
A descriptive research design can use a wide variety of research methods to investigate one or more variables . Unlike in experimental research , the researcher does not control or manipulate any of the variables, but only observes and measures them.
Table of contents
When to use a descriptive research design, descriptive research methods.
Descriptive research is an appropriate choice when the research aim is to identify characteristics, frequencies, trends, and categories.
It is useful when not much is known yet about the topic or problem. Before you can research why something happens, you need to understand how, when, and where it happens.
- How has the London housing market changed over the past 20 years?
- Do customers of company X prefer product Y or product Z?
- What are the main genetic, behavioural, and morphological differences between European wildcats and domestic cats?
- What are the most popular online news sources among under-18s?
- How prevalent is disease A in population B?
Prevent plagiarism, run a free check.
Descriptive research is usually defined as a type of quantitative research , though qualitative research can also be used for descriptive purposes. The research design should be carefully developed to ensure that the results are valid and reliable .
Survey research allows you to gather large volumes of data that can be analysed for frequencies, averages, and patterns. Common uses of surveys include:
- Describing the demographics of a country or region
- Gauging public opinion on political and social topics
- Evaluating satisfaction with a company’s products or an organisation’s services
Observations
Observations allow you to gather data on behaviours and phenomena without having to rely on the honesty and accuracy of respondents. This method is often used by psychological, social, and market researchers to understand how people act in real-life situations.
Observation of physical entities and phenomena is also an important part of research in the natural sciences. Before you can develop testable hypotheses , models, or theories, it’s necessary to observe and systematically describe the subject under investigation.
Case studies
A case study can be used to describe the characteristics of a specific subject (such as a person, group, event, or organisation). Instead of gathering a large volume of data to identify patterns across time or location, case studies gather detailed data to identify the characteristics of a narrowly defined subject.
Rather than aiming to describe generalisable facts, case studies often focus on unusual or interesting cases that challenge assumptions, add complexity, or reveal something new about a research problem .
Cite this Scribbr article
If you want to cite this source, you can copy and paste the citation or click the ‘Cite this Scribbr article’ button to automatically add the citation to our free Reference Generator.
McCombes, S. (2022, October 10). Descriptive Research Design | Definition, Methods & Examples. Scribbr. Retrieved 21 August 2024, from https://www.scribbr.co.uk/research-methods/descriptive-research-design/
Is this article helpful?

Shona McCombes
Other students also liked, a quick guide to experimental design | 5 steps & examples, correlational research | guide, design & examples, qualitative vs quantitative research | examples & methods.

An official website of the United States government
The .gov means it’s official. Federal government websites often end in .gov or .mil. Before sharing sensitive information, make sure you’re on a federal government site.
The site is secure. The https:// ensures that you are connecting to the official website and that any information you provide is encrypted and transmitted securely.
- Publications
- Account settings
Preview improvements coming to the PMC website in October 2024. Learn More or Try it out now .
- Advanced Search
- Journal List
- HHS Author Manuscripts
Characteristics of Qualitative Descriptive Studies: A Systematic Review
MSN, CRNP, Doctoral Candidate, University of Pennsylvania School of Nursing
Justine S. Sefcik
MS, RN, Doctoral Candidate, University of Pennsylvania School of Nursing
Christine Bradway
PhD, CRNP, FAAN, Associate Professor of Gerontological Nursing, University of Pennsylvania School of Nursing
Qualitative description (QD) is a term that is widely used to describe qualitative studies of health care and nursing-related phenomena. However, limited discussions regarding QD are found in the existing literature. In this systematic review, we identified characteristics of methods and findings reported in research articles published in 2014 whose authors identified the work as QD. After searching and screening, data were extracted from the sample of 55 QD articles and examined to characterize research objectives, design justification, theoretical/philosophical frameworks, sampling and sample size, data collection and sources, data analysis, and presentation of findings. In this review, three primary findings were identified. First, despite inconsistencies, most articles included characteristics consistent with limited, available QD definitions and descriptions. Next, flexibility or variability of methods was common and desirable for obtaining rich data and achieving understanding of a phenomenon. Finally, justification for how a QD approach was chosen and why it would be an appropriate fit for a particular study was limited in the sample and, therefore, in need of increased attention. Based on these findings, recommendations include encouragement to researchers to provide as many details as possible regarding the methods of their QD study so that readers can determine whether the methods used were reasonable and effective in producing useful findings.
Qualitative description (QD) is a label used in qualitative research for studies which are descriptive in nature, particularly for examining health care and nursing-related phenomena ( Polit & Beck, 2009 , 2014 ). QD is a widely cited research tradition and has been identified as important and appropriate for research questions focused on discovering the who, what, and where of events or experiences and gaining insights from informants regarding a poorly understood phenomenon. It is also the label of choice when a straight description of a phenomenon is desired or information is sought to develop and refine questionnaires or interventions ( Neergaard et al., 2009 ; Sullivan-Bolyai et al., 2005 ).
Despite many strengths and frequent citations of its use, limited discussions regarding QD are found in qualitative research textbooks and publications. To the best of our knowledge, only seven articles include specific guidance on how to design, implement, analyze, or report the results of a QD study ( Milne & Oberle, 2005 ; Neergaard, Olesen, Andersen, & Sondergaard, 2009 ; Sandelowski, 2000 , 2010 ; Sullivan-Bolyai, Bova, & Harper, 2005 ; Vaismoradi, Turunen, & Bondas, 2013 ; Willis, Sullivan-Bolyai, Knafl, & Zichi-Cohen, 2016 ). Furthermore, little is known about characteristics of QD as reported in journal-published, nursing-related, qualitative studies. Therefore, the purpose of this systematic review was to describe specific characteristics of methods and findings of studies reported in journal articles (published in 2014) self-labeled as QD. In this review, we did not have a goal to judge whether QD was done correctly but rather to report on the features of the methods and findings.
Features of QD
Several QD design features and techniques have been described in the literature. First, researchers generally draw from a naturalistic perspective and examine a phenomenon in its natural state ( Sandelowski, 2000 ). Second, QD has been described as less theoretical compared to other qualitative approaches ( Neergaard et al., 2009 ), facilitating flexibility in commitment to a theory or framework when designing and conducting a study ( Sandelowski, 2000 , 2010 ). For example, researchers may or may not decide to begin with a theory of the targeted phenomenon and do not need to stay committed to a theory or framework if their investigations take them down another path ( Sandelowski, 2010 ). Third, data collection strategies typically involve individual and/or focus group interviews with minimal to semi-structured interview guides ( Neergaard et al., 2009 ; Sandelowski, 2000 ). Fourth, researchers commonly employ purposeful sampling techniques such as maximum variation sampling which has been described as being useful for obtaining broad insights and rich information ( Neergaard et al., 2009 ; Sandelowski, 2000 ). Fifth, content analysis (and in many cases, supplemented by descriptive quantitative data to describe the study sample) is considered a primary strategy for data analysis ( Neergaard et al., 2009 ; Sandelowski, 2000 ). In some instances thematic analysis may also be used to analyze data; however, experts suggest care should be taken that this type of analysis is not confused with content analysis ( Vaismoradi et al., 2013 ). These data analysis approaches allow researchers to stay close to the data and as such, interpretation is of low-inference ( Neergaard et al., 2009 ), meaning that different researchers will agree more readily on the same findings even if they do not choose to present the findings in the same way ( Sandelowski, 2000 ). Finally, representation of study findings in published reports is expected to be straightforward, including comprehensive descriptive summaries and accurate details of the data collected, and presented in a way that makes sense to the reader ( Neergaard et al., 2009 ; Sandelowski, 2000 ).
It is also important to acknowledge that variations in methods or techniques may be appropriate across QD studies ( Sandelowski, 2010 ). For example, when consistent with the study goals, decisions may be made to use techniques from other qualitative traditions, such as employing a constant comparative analytic approach typically associated with grounded theory ( Sandelowski, 2000 ).
Search Strategy and Study Screening
The PubMed electronic database was searched for articles written in English and published from January 1, 2014 to December 31, 2014, using the terms, “qualitative descriptive study,” “qualitative descriptive design,” and “qualitative description,” combined with “nursing.” This specific publication year, “2014,” was chosen because it was the most recent full year at the time of beginning this systematic review. As we did not intend to identify trends in QD approaches over time, it seemed reasonable to focus on the nursing QD studies published in a certain year. The inclusion criterion for this review was data-based, nursing-related, research articles in which authors used the terms QD, qualitative descriptive study, or qualitative descriptive design in their titles or abstracts as well as in the main texts of the publication.
All articles yielded through an initial search in PubMed were exported into EndNote X7 ( Thomson Reuters, 2014 ), a reference management software, and duplicates were removed. Next, titles and abstracts were reviewed to determine if the publication met inclusion criteria; all articles meeting inclusion criteria were then read independently in full by two authors (HK and JS) to determine if the terms – QD or qualitative descriptive study/design – were clearly stated in the main texts. Any articles in which researchers did not specifically state these key terms in the main text were then excluded, even if the terms had been used in the study title or abstract. In one article, for example, although “qualitative descriptive study” was reported in the published abstract, the researchers reported a “qualitative exploratory design” in the main text of the article ( Sundqvist & Carlsson, 2014 ); therefore, this article was excluded from our review. Despite the possibility that there may be other QD studies published in 2014 that were not labeled as such, to facilitate our screening process we only included articles where the researchers clearly used our search terms for their approach. Finally, the two authors compared, discussed, and reconciled their lists of articles with a third author (CB).
Study Selection
Initially, although the year 2014 was specifically requested, 95 articles were identified (due to ahead of print/Epub) and exported into the EndNote program. Three duplicate publications were removed and the 20 articles with final publication dates of 2015 were also excluded. The remaining 72 articles were then screened by examining titles, abstracts, and full-texts. Based on our inclusion criteria, 15 (of 72) were then excluded because QD or QD design/study was not identified in the main text. We then re-examined the remaining 57 articles and excluded two additional articles that did not meet inclusion criteria (e.g., QD was only reported as an analytic approach in the data analysis section). The remaining 55 publications met inclusion criteria and comprised the sample for our systematic review (see Figure 1 ).

Flow Diagram of Study Selection
Of the 55 publications, 23 originated from North America (17 in the United States; 6 in Canada), 12 from Asia, 11 from Europe, 7 from Australia and New Zealand, and 2 from South America. Eleven studies were part of larger research projects and two of them were reported as part of larger mixed-methods studies. Four were described as a secondary analysis.
Quality Appraisal Process
Following the identification of the 55 publications, two authors (HK and JS) independently examined each article using the Critical Appraisal Skills Programme (CASP) qualitative checklist ( CASP, 2013 ). The CASP was chosen to determine the general adequacy (or rigor) of the qualitative studies included in this review as the CASP criteria are generic and intend to be applied to qualitative studies in general. In addition, the CASP was useful because we were able to examine the internal consistency between study aims and methods and between study aims and findings as well as the usefulness of findings ( CASP, 2013 ). The CASP consists of 10 main questions with several sub-questions to consider when making a decision about the main question ( CASP, 2013 ). The first two questions have reviewers examine the clarity of study aims and appropriateness of using qualitative research to achieve the aims. With the next eight questions, reviewers assess study design, sampling, data collection, and analysis as well as the clarity of the study’s results statement and the value of the research. We used the seven questions and 17 sub-questions related to methods and statement of findings to evaluate the articles. The results of this process are presented in Table 1 .
CASP Questions and Quality Appraisal Results (N = 55)
| CASP Questions • CASP Subquestions | Results | |||||
|---|---|---|---|---|---|---|
| Yes | No | Can’t tell | ||||
| Was the research design appropriate to address the aims of the research? | ||||||
| • Did the researcher justify the research design? | 26 | 47.3 | 28 | 50.9 | 1 | 1.8 |
| Was the recruitment strategy appropriate to the aims of the research? | ||||||
| • Did the researcher explain how the participants were selected? | 44 | 80 | 6 | 10.9 | 5 | 9.1 |
| Was the data collected in a way that addressed the research issue? | ||||||
| • Was the setting for data collection justified? | 31 | 56.4 | 21 | 38.2 | 3 | 5.4 |
| • Was it clear how data were collected e.g., focus group, semistructured interview etc.? | 55 | 100 | 0 | 0.0 | 0 | 0.0 |
| • Did the researcher justify the methods chosen? | 13 | 23.6 | 41 | 74.5 | 1 | 1.8 |
| • Did the researcher make the methods explicit e.g., for the interview method, was there an indication of how interviews were conducted, or did they use a topic guide? | 51 | 92.7 | 4 | 7.3 | 0 | 0.0 |
| • Was the form of data clear e.g., tape recordings, video materials, notes, etc.? | 54 | 98.2 | 0 | 0.0 | 1 | 1.8 |
| • Did the researcher discuss saturation of data? | 20 | 36.4 | 35 | 63.6 | 0 | 0.0 |
| Has the relationship between researcher and participants been adequately considered? | ||||||
| • Did the researcher critically examine their own role, potential bias, and influence during data collection, including sample recruitment and choice of location | 4 | 7.3 | 50 | 90.9 | 1 | 1.8 |
| Have ethical issues been taken into consideration? | ||||||
| • Was there sufficient detail about how the research was explained to participants for the reader to assess whether ethical standards were maintained? | 49 | 89.1 | 4 | 7.3 | 2 | 3.6 |
| • Was approval sought from an ethics committee? | 51 | 92.7 | 4 | 7.3 | 0 | 0.0 |
| Was the data analysis sufficiently rigorous? | ||||||
| • Was there an in-depth description of the analysis process? | 46 | 83.6 | 9 | 16.4 | 0 | 0.0 |
| • Was thematic or content analysis used. If so, was it clear how the categories/themes derived from the data? | 51 | 92.7 | 3 | 5.5 | 1 | 1.8 |
| • Did the researcher critically examine their own role, potential bias and influence during analysis and selection of data for presentation? | 20 | 36.4 | 30 | 54.5 | 5 | 9.1 |
| Was there a clear statement of findings? | ||||||
| • Were the findings explicit? | 55 | 100 | 0 | 0 | 0 | 0 |
| • Did the researcher discuss the credibility of their findings (e.g., triangulation) | 46 | 83.6 | 8 | 14.5 | 1 | 1.8 |
| • Were the findings discussed in relation to the original research question? | 55 | 100 | 0 | 0 | 0 | 0 |
Note . The CASP questions are adapted from “10 questions to help you make sense of qualitative research,” by Critical Appraisal Skills Programme, 2013, retrieved from http://media.wix.com/ugd/dded87_29c5b002d99342f788c6ac670e49f274.pdf . Its license can be found at http://creativecommons.org/licenses/by-nc-sa/3.0/
Once articles were assessed by the two authors independently, all three authors discussed and reconciled our assessment. No articles were excluded based on CASP results; rather, results were used to depict the general adequacy (or rigor) of all 55 articles meeting inclusion criteria for our systematic review. In addition, the CASP was included to enhance our examination of the relationship between the methods and the usefulness of the findings documented in each of the QD articles included in this review.
Process for Data Extraction and Analysis
To further assess each of the 55 articles, data were extracted on: (a) research objectives, (b) design justification, (c) theoretical or philosophical framework, (d) sampling and sample size, (e) data collection and data sources, (f) data analysis, and (g) presentation of findings (see Table 2 ). We discussed extracted data and identified common and unique features in the articles included in our systematic review. Findings are described in detail below and in Table 3 .
Elements for Data Extraction
| Elements | Data Extraction |
|---|---|
| Research objectives | • Verbs used in objectives or aims |
| • Focuses of study | |
| Design justification | • If the article cited references for qualitative description |
| • If the article offered rationale to choose qualitative description | |
| • References cited | |
| • Rationale reported | |
| Theoretical or philosophical frameworks | • If the article has theoretical or philosophical frameworks for study |
| • Theoretical or philosophical frameworks reported | |
| • How the frameworks were used in data collection and analysis | |
| Sampling and sample sizes | • Sampling strategies (e.g., purposeful sampling, maximum variation) |
| • Sample size | |
| Data collection and sources | • Data collection techniques (e.g., individual or focus-group interviews, interview guide, surveys, field notes) |
| Data analysis | • Data analysis techniques (e.g., qualitative content analysis, thematic analysis, constant comparison) |
| • If data saturation was achieved | |
| Presentation of findings | • Statement of findings |
| • Consistency with research objectives |
Data Extraction and Analysis Results
| Authors Country | Research Objectives | Design justification | Theoretical/ philosophical frameworks | Sampling/ sample size | Data collection and data sources | Data analysis | Findings |
|---|---|---|---|---|---|---|---|
| • USA | • Explore • Responses to communication strategies | • (-) Reference • (-) Rationale | Not reported (NR) | • Purposive sampling/ maximum variation • 32 family members | • Interviews • Observations • Review of daily flow sheet • Demographics | • Inductive and deductive qualitative content analysis • (-) Data saturation | Five themes about family members’ perceptions of nursing communication approaches |
| • Sweden | • Describe • Experiences of using guidelines in daily practice | • (-) Reference • (+) Rationale • Part of a research program | NR | • Unspecified • 8 care providers | • Semistructured, individual interviews • Interview guide | • Qualitative content analysis • (-) Data saturation | One theme and seven subthemes about care providers’ experiences of using guidelines in daily practice |
| • USA | • Examine • Culturally specific views of processes and causes of midlife weight gain | • (-) Reference • (-) Rationale | Health belief model and Kleiman’s explanatory model | • Unspecified • 19 adults | • Semistructured, individual interview | • Conventional content analysis • (-) Data saturation | Three main categories (from the model) and eight subthemes about causes of weight gain in midlife |
| • Iran | • Explore • Factors initiating responsibility among medical trainees | • (-) Reference • (+) Rationale | NR | • Convenience, snowball, and maximum variation sampling • 15 trainees and other professionals | • Semistructured, individual interview • Interview guide | • Conventional content analysis • Constant comparison • (+) Data saturation | Two themes and individual and non- individual-based factors per theme |
| • Iran | • Explore • Factors related to job satisfaction and dissatisfaction | • (-) Reference • (-) Rationale | NR | • Convenience sampling • 85 nurses | • Semistructured focus group interviews • Interview guide | • Thematic analysis • (+) Data saturation | Three main themes and associated factors regarding job satisfaction and dissatisfaction |
| • Norway | • Describe • Perceptions on simulation-based team training | • (-) Reference • (-) Rationale | NR | • Strategic sampling • 18 registered nurses | • Semistructured individual interviews | • Inductive content analysis • (-) Data saturation | One main category, three categories, and six sub- categories regarding nurses’ perceptions on simulation-based team training |
| • USA | • Determine • Barriers and supports for attending college and nursing school | • (-) Reference • (-) Rationale | NR | • Unspecified • 45 students | • Focus-group interviews • Using Photovoice and SHOWeD | • Constant comparison • (-) Data saturation | Five themes about facilitators and barriers |
| • USA | • Explore • Reasons for choosing home birth and birth experiences | • (-) Reference • (-) Rationale | NR | • Purposeful sampling • 20 women | • Semistructured focus-group interviews • Interview guide • Field notes | • Qualitative content analysis • (+) Data saturation | Five common themes and concepts about reasons for choosing home birth based on their birth experiences |
| • New Zealand | • Explore • Normal fetal activity related to hunger and satiation | • (+) Reference • (+) Rationale • • Denzin & Lincoln (2011) | NR | • Purposive sampling • 19 pregnant women | • Semistructured individual interviews • Open-ended questions | • Inductive qualitative content analysis • Descriptive statistical analysis • (+) Data saturation | Four patterns regarding fetal activities in relation to meal anticipation, maternal hunger, maternal meal consummation, and maternal satiety |
| • Italy | • Explore, describe, and compare • perceptions of nursing caring | • (+) Reference • (-) Rationale • | NR | • Purposive sampling • 20 nurses and 20 patients | • Semistructured individual interviews • Interview guide • Field notes during interviews | • Unspecified various analytic strategies including constant comparison • (-) Data saturation | Nursing caring from both patients’ and nurses’ perspectives – a summary of data in visible caring and invisible caring |
| • Hong Kong | • Address • How to reduce coronary heart disease risks | • (+) Reference • (+) Rationale • Secondary analysis • • | NR | • Convenience and snowball sampling • 105 patients | • Focus-group interviews • Interview guide | • Content analysis • (+) Data saturation | Four categories about patients’ abilities to reduce coronary heart disease |
| • Taiwan | • Explore • Reasons for young–old people not killing themselves | • (-) Reference • (-) Rationale | NR | • Convenience sampling • 31 older adults | • Semistructured individual interviews • Interview guide • Observation with memos/reflective journal | • Content analysis • (+) Data saturation | Six themes regarding reasons for not committing to suicide |
| • USA | • Explore • Neonatal intensive care unit experiences | • (+) Reference • (+) Rationale • | NR | • Purposive sampling and convenience sample • 15 mothers | • Semistructured individual interviews • Interview guide | • Qualitative content analysis • (+) Data saturation | Four themes about participants’ experiences of neonatal intensive care unit |
| • Colombia | • Investigate • Barriers/facilitators to implementing evidence-based nursing | • (+) Reference • (-) Rationale • | Ottawa model for research use: knowledge translation framework | • Convenience sampling • 13 nursing professionals | • Semistructured individual interviews • Interview guide | • Inductive qualitative content analysis • Constant comparison • (-) Data saturation | Four main barriers and potential facilitators to evidence-based nursing |
| • Australia | • Explore • Perceptions and utilization of diaries | • (+) Reference • (-) Rationale • | NR | • Unspecified • 19 patients and families | • Responses to open-ended questions on survey | • Unspecified analysis strategy • (-) Data saturation | Five themes regarding perceptions on use of diaries and descriptive statistics using frequencies of utilization |
| • USA | • Explore • Knowledge, attitudes, and beliefs about sexual consent | • (-) Reference • (-) Rationale • Part of a larger mixed-method study | Theory of planned behavior | • Purposive sampling • snowball sampling • 26 women | • Semistructured focus-group interviews • Interview guide | • Content analysis • (+) Data saturation | Three main categories and subthemes regarding sexual consent |
| • Sweden | • Describe • Experiences of knowledge development in wound management | • (+) Reference • (+) Rationale: weak • | NR | • Purposive sampling • 16 district nurses | • Individual interviews • Interview guide | • Qualitative content analysis • (-) Data saturation | Three categories and eleven sub-categories about knowledge development experiences in wound management |
| • USA | • Describe • Parental-pain journey, beliefs about pain, and attitudes/behaviors related to children’s responses | • (+) Reference • (+) Rationale • • • Part of a larger mixed methods study | NR | • Purposive sampling • 9 parents | • Individual interviews • One open- ended question | • Qualitative content analysis • (+) Data saturation | Two main themes, categories, and subcategories about parents’ experiences of observing children’s pain |
| • USA | • Describe • Challenges and barriers in providing culturally competent care | • (+) Reference • (+) Rationale • • Secondary analysis | NR | • Stratified sampling • 253 nurses | • Written responses to 2 open-ended questions on survey | • Thematic analysis • (-) Data saturation | Three themes regarding challenges/barriers |
| • Denmark | • Describe • Experiences of childbirth | • (-) Reference • (-) Rationale • A substudy | NR | • Purposive sampling with maximum variation • Partners of 10 women | • Semistructured, individual interviews • Interview guide | • Thematic analysis • (+) Data saturation | Three themes and four subthemes about partners’ experiences of women’s childbirth |
| • Australia | • Explore • Perceptions about medical nutrition and hydration at the end of life | • (+) Reference • (+) Rationale • | NR | • Purposeful sampling • 10 nurses | • Focus-group interviews | • “analyzed thematically” • (-) Data saturation | One main theme and four subthemes regarding nurses’ perceptions on EOL- related medical nutrition and hydration |
| • USA | • Describe • Reasons for leaving a home visiting program early | • (-) Reference • (-) Rationale | NR | • Convenience sample • 32 mothers, nurses, and nurse supervisors | • Semistructured, individual interviews • Focus-group interviews • Interview guide | • Inductive content analysis • Constant comparison approach • (+) Data saturation | Three sets of reasons for leaving a home visiting program |
| • Sweden | • Explore and describe • Beliefs and attitudes around the decision for a caesarean section | • (+) Reference • (+) Rationale • • | NR | • Unspecified • 21 males | • Individual telephone interviews | • Thematic analysis • Constant comparison approach • (-) Data saturation | Two themes and subthemes in relation to the research objective |
| • Taiwan | • Explore • Illness experiences of early onset of knee osteoarthritis | • (+) Reference • (+) Rationale • • • Part of a large research series | NR | • Purposive sampling • 17 adults | • Semistructured, Individual interviews • Interview guide • Memo/field notes (observations) | • Inductive content analysis • (+) Data saturation | Three major themes and nine subthemes regarding experiences of early onset-knee osteoarthritis |
| • Australia | • Explore • Perceptions about bedside handover (new model) by nurses | • (+) Reference • (+) Rationale • • | NR | • Purposive sampling • 30 patients | • Semistructured, individual interviews • Interview guide | • Thematic content analysis • (-) Data analysis | Two dominant themes and related subthemes regarding patients’ thoughts about nurses’ bedside handover |
| • Sweden | • Identify • Patterns in learning when living with diabetes | • (-) Reference • (-) Rationale | NR | • Purposive sampling with variations in age and sex • 13 participants | • Semistructured, individual interviews (3 times over 3 years) | • analysis process • Inductive qualitative content analysis • (-) Data saturation | Five main patterns of learning when living with diabetes for three years following diagnosis |
| • Canada | • Evaluate • Book chat intervention based on a novel | • (-) Reference • (-) Rationale • Part of a larger research project | NR | • Unspecified • 11 long-term- care staff | • Questionnaire with two open- ended questions | • Thematic content analysis • (-) Data saturation | Five themes (positive comments) about the book chat with brief description |
| • Taiwan | • Explore • Facilitators and barriers to implementing smoking- cessation counseling services | • (-) Reference • (-) Rationale | NR | • Unspecified • 16 nurse- counselors | • Semistructured individual interviews • Interview guide | • Inductive content analysis • Constant comparison • (-) Data saturation | Two themes and eight subthemes about facilitators and barriers described using 2-4 quotations per subtheme |
| • USA | • Identify • Educational strategies to manage disruptive behavior | • (-) Reference • (-) Rationale • Part of a larger study | NR | • Unspecified • 9 nurses | • Semistructured, individual interviews • Interview guide | • Content analysis procedures • (-) Data saturation | Two main themes regarding education strategies for nurse educators |
| • USA | • Explore • Experiences of difficulty resolving patient- related concerns | • (-) Reference • (-) Rationale • Secondary analysis | NR | • Unspecified • 1932 physician, nursing, and midwifery professionals | • E-mail survey with multiple- choice and free- text responses | • Inductive thematic analysis • Descriptive statistics • (-) Data saturation | One overarching theme and four subthemes about professionals’ experiences of difficulty resolving patient-related concerns |
| • Singapore | • Explicate • Experience of quality of life for older adults | • (+) Reference • (+) Rationale • | Parse’s human becoming paradigm | • Unspecified • 10 elderly residents | • Individual interviews • Interview questions presented (Parse) | • Unspecified analysis techniques • (-) Data saturation | Three themes presented using both participants’ language and the researcher’s language |
| • China | • Explore • Perspectives on learning about caring | • (-) Reference • (-) Rationale | NR | • Purposeful sampling • 20 nursing students | • Focus-group interviews • Interview guide | • Conventional content analysis • (-) Data saturation | Four categories and associated subcategories about facilitators and challenges to learning about caring |
| • Poland | • Describe and assess • Components of the patient–nurse relationship and pediatric-ward amenities | • (+) Reference • (-) Rationale • | NR | • Purposeful, maximum variation sampling • 26 parents or caregivers and 22 children | • Individual interviews | • Qualitative content analysis • (-) Data saturation | Five main topics described from the perspectives of children and parents |
| • Canada | • Evaluate • Acceptability and feasibility of hand-massage therapy | • (-) Reference • (-) Rationale • Secondary to a RCT | Focused on feasibility and acceptability | • Unspecified • 40 patients | • Semistructured, individual interviews • Field notes • Video recording | • Thematic analysis for acceptability • Quantitative ratings of video items for feasibility • (-) Data analysis | Summary of data focusing on predetermined indicators of acceptability and descriptive statistics to present feasibility |
| • USA | • Understand • Challenges occurring during transitions of care | • (+) Reference • (+) Rationale • • Part of a larger study | NR | • Convenience sample • 22 nurses | • Focus groups • Interview guide | • Qualitative content analysis methods • (+) Data analysis | Three themes about challenges regarding transitions of care: |
| • Canada | • Understand • Factors that influence nurses’ retention in their current job | • (-) Reference • (-) Rationale | NR | • Purposeful sampling • 41 nurses | • Focus-group interviews • Interview guide | • Directed content analysis • (+) Data saturation | Nurses’ reasons to stay and leave their current job |
| • Australia | • Extend • Understanding of caregivers’ views on advance care planning | • (+) Reference • (+) Rationale • • Grounded theory overtone | NR | • Theoretical sampling • 18 caregivers | • Semistructured focus group and individual interviews • Interview guide • Vignette technique | • Inductive, cyclic, and constant comparative analysis • (-) Data analysis | Three themes regarding caregivers’ perceptions on advance care planning |
| • USA | • Describe • Outcomes older adults with epilepsy hope to achieve in management | • (-) Reference • (-) Rationale | NR | • Unspecified • 20 patients | • Individual interview | • Conventional content analysis • (-) Data saturation | Six main themes and associated subthemes regarding what older adults hoped to achieve in management of their epilepsy |
| • The Netherlands | • Gain • Experience of personal dignity and factors influencing it | • (+) Reference • (-) Rationale • | Model of dignity in illness | • Maximum variation sampling • 30 nursing home residents | • Individual interviews • Interview guide | • Thematic analysis • Constant comparison • (+) Data saturation | The threatening effect of illness and three domains being threatened by illness in relation to participants’ experiences of personal dignity |
| • USA | • Identify and describe • Needs in mental health services and “ideal” program | • (+) Reference • (+) Rationale • • There is a primary study | NR | • Unspecified • 52 family members | • Semistructured, individual and focus-group interviews | • “Standard content analytic procedures” with case-ordered meta-matrix • (-) Data saturation | Two main topics – (a) intervention modalities that would fit family members’ needs in mental health services and (b) topics that programs should address |
| • USA | • “What are the perceptions of staff nurses regarding palliative care…?” | • (-) Reference • (-) Rationale | NR | • Purposive, convenience sampling • 18 nurses | • Semistructured and focus-group interviews • Interview guide | • Ritchie and Spencer’s framework for data analysis • (-) Data saturation | Five thematic categories and associated subcategories about nurses’ perceptions of palliative care |
| • Canada | • Describe • Experience of caring for a relative with dementia | • (+) Reference • (+) Rationale • Sandelowski ( ; ) • Secondary analysis • Phenomenological overtone | NR | • Purposive sampling • 11 bereaved family members | • Individual interviews • 27 transcripts from the primary study | • Unspecified • (-) Data saturation | Five major themes regarding the journey with dementia from the time prior to diagnosis and into bereavement |
| • Canada | • Describe Experience of fetal fibronectin testing | • (+) Reference • (+) Rationale • • | NR | • Unspecified • 17 women | • Semistructured individual interviews • Interview guide | • Conventional content analysis • (+) Data saturation | One overarching theme, three themes, and six subthemes about women’s experiences of fetal fibronectin testing |
| • New Zealand | • Explore • Role of nurses in providing palliative and end-of-life care | • (+) Reference • (+) Rationale • • Part of a larger study | NR | • Purposeful sampling • 21 nurses | • Semistructured individual interviews | • Thematic analysis • (-) Data saturation | Three themes about practice nurses’ experiences in providing palliative and end-of-life care |
| • Brazil | • Understand • Experience with postnatal depression | • (+) Reference • (-) Rationale • | NR | • Purposeful, criterion sampling • 15 women with postnatal depression | • Minimally structured, individual interviews | • Thematic analysis • (+) Data saturation | Two themes – women’s “bad thoughts” and their four types of responses to fear of harm (with frequencies) |
| • Australia | • Understand • Experience of peripherally inserted central catheter insertion | • (+) Reference • (+) Rationale • | NR | • Purposeful sampling • 10 patients | • Semistructured, individual interviews • Interview guide | • Thematic analysis • (+) Data saturation | Four themes regarding patients’ experiences of peripherally inserted central catheter insertion |
| • USA | • Discover • Context, values, and background meaning of cultural competency | • (+) Reference • (+) Rationale • | Focused on cultural competence | • Purposive, maximum variation, and network • 20 experts | • Semistructured, individual interviews | • Within-case and across-case analysis • (-) Data saturation | Three themes regarding cultural competency |
| • USA | • Explore and describe • Cancer experience | • (+) Reference • (+) Rationale • | NR | • Unspecified • 15 patients | • Longitudinal individual interviews (4 time points) • 40 interviews | • Inductive content analysis • (-) Data saturation | Processes and themes about adolescent identify work and cancer identify work across the illness trajectory |
| • Sweden | • Explore • Experiences of giving support to patients during the transition | • (-) Reference • (-) Rationale | Focused on support and transition | • Unspecified (but likely purposeful sampling) • 8 nurses | • Semistructured Individual interviews • Interview guide | • Content analysis • (-) Data saturation | One theme, three main categories, and eight associated categories |
| • Taiwan | • Describe • Process of women’s recovery from stillbirth | • (+) Reference • (+) Rationale • | NR | • Purposeful sampling • 21 women | • Individual interview techniques | • Inductive analytic approaches ( ) • (+) Data saturation | Three stages (themes) regarding the recovery process of Taiwanese women with stillbirth |
| • Iran | • Describe • Perspectives of causes of medication errors | • (+) Reference • (+) Rationale • | NR | • Purposeful sampling • 24 nursing students | • Focus-group interviews • Observations with notes | • Content analysis • (-) Data saturation | Two main themes about nursing students’ perceptions on causes of medication errors |
| • Iran | • Explore • Image of nursing | • (-) Reference • (-) Rationale | NR | • Purposeful sampling • 18 male nurses | • Semistructured individual, interviews • Field notes | • Content analysis • (-) Data saturation | Two main views (themes) on nursing presented with subthemes per view |
| • Spain | • Ascertain • Barriers to sexual expression | • (-) Reference • (-) Rationale | NR | • Maximum variation • 100 staff and residents | • Semistructured, individual interview | • Content analysis • (-) Data saturation | 40% of participants without identification of barriers and 60% with seven most cited barriers to sexual expression in the long-term care setting |
| • Canada | • Explore • Perceptions of empowerment in academic nursing environments | • (+) Reference • (+) Rationale • Sandelowski ( , ) | Theories of structural power in organizations and psychological empowerment | • Unspecified • 8 clinical instructors | • Semistructured, individual • interview guide | • Unspecified (but used pre-determined concepts) • (+) Data saturation | Structural empowerment and psychological empowerment described using predetermined concepts |
| • China | • Investigate • Meaning of life and health experience with chronic illness | • (+) Reference • (+) Rationale • Sandelowski ( , ) | Positive health philosophy | • Purposive, convenience sampling • 11 patients | • Individual interviews • Observations of daily behavior with field notes | • Thematic analysis • (-) Data saturation | Four themes regarding the meaning of life and health when living with chronic illnesses |
Note . NR = not reported
Quality Appraisal Results
Justification for use of a QD design was evident in close to half (47.3%) of the 55 publications. While most researchers clearly described recruitment strategies (80%) and data collection methods (100%), justification for how the study setting was selected was only identified in 38.2% of the articles and almost 75% of the articles did not include any reason for the choice of data collection methods (e.g., focus-group interviews). In the vast majority (90.9%) of the articles, researchers did not explain their involvement and positionality during the process of recruitment and data collection or during data analysis (63.6%). Ethical standards were reported in greater than 89% of all articles and most articles included an in-depth description of data analysis (83.6%) and development of categories or themes (92.7%). Finally, all researchers clearly stated their findings in relation to research questions/objectives. Researchers of 83.3% of the articles discussed the credibility of their findings (see Table 1 ).
Research Objectives
In statements of study objectives and/or questions, the most frequently used verbs were “explore” ( n = 22) and “describe” ( n = 17). Researchers also used “identify” ( n = 3), “understand” ( n = 4), or “investigate” ( n = 2). Most articles focused on participants’ experiences related to certain phenomena ( n = 18), facilitators/challenges/factors/reasons ( n = 14), perceptions about specific care/nursing practice/interventions ( n = 11), and knowledge/attitudes/beliefs ( n = 3).
Design Justification
A total of 30 articles included references for QD. The most frequently cited references ( n = 23) were “Whatever happened to qualitative description?” ( Sandelowski, 2000 ) and “What’s in a name? Qualitative description revisited” ( Sandelowski, 2010 ). Other references cited included “Qualitative description – the poor cousin of health research?” ( Neergaard et al., 2009 ), “Reaching the parts other methods cannot reach: an introduction to qualitative methods in health and health services research” ( Pope & Mays, 1995 ), and general research textbooks ( Polit & Beck, 2004 , 2012 ).
In 26 articles (and not necessarily the same as those citing specific references to QD), researchers provided a rationale for selecting QD. Most researchers chose QD because this approach aims to produce a straight description and comprehensive summary of the phenomenon of interest using participants’ language and staying close to the data (or using low inference).
Authors of two articles distinctly stated a QD design, yet also acknowledged grounded-theory or phenomenological overtones by adopting some techniques from these qualitative traditions ( Michael, O'Callaghan, Baird, Hiscock, & Clayton, 2014 ; Peacock, Hammond-Collins, & Forbes, 2014 ). For example, Michael et al. (2014 , p. 1066) reported:
The research used a qualitative descriptive design with grounded theory overtones ( Sandelowski, 2000 ). We sought to provide a comprehensive summary of participants’ views through theoretical sampling; multiple data sources (focus groups [FGs] and interviews); inductive, cyclic, and constant comparative analysis; and condensation of data into thematic representations ( Corbin & Strauss, 1990 , 2008 ).
Authors of four additional articles included language suggestive of a grounded-theory or phenomenological tradition, e.g., by employing a constant comparison technique or translating themes stated in participants’ language into the primary language of the researchers during data analysis ( Asemani et al., 2014 ; Li, Lee, Chen, Jeng, & Chen, 2014 ; Ma, 2014 ; Soule, 2014 ). Additionally, Li et al. (2014) specifically reported use of a grounded-theory approach.
Theoretical or Philosophical Framework
In most (n = 48) articles, researchers did not specify any theoretical or philosophical framework. Of those articles in which a framework or philosophical stance was included, the authors of five articles described the framework as guiding the development of an interview guide ( Al-Zadjali, Keller, Larkey, & Evans, 2014 ; DeBruyn, Ochoa-Marin, & Semenic, 2014 ; Fantasia, Sutherland, Fontenot, & Ierardi, 2014 ; Ma, 2014 ; Wiens, Babenko-Mould, & Iwasiw, 2014 ). In two articles, data analysis was described as including key concepts of a framework being used as pre-determined codes or categories ( Al-Zadjali et al., 2014 ; Wiens et al., 2014 ). Oosterveld-Vlug et al. (2014) and Zhang, Shan, and Jiang (2014) discussed a conceptual model and underlying philosophy in detail in the background or discussion section, although the model and philosophy were not described as being used in developing interview questions or analyzing data.
Sampling and Sample Size
In 38 of the 55 articles, researchers reported ‘purposeful sampling’ or some derivation of purposeful sampling such as convenience ( n = 10), maximum variation ( n = 8), snowball ( n = 3), and theoretical sampling ( n = 1). In three instances ( Asemani et al., 2014 ; Chan & Lopez, 2014 ; Soule, 2014 ), multiple sampling strategies were described, for example, a combination of snowball, convenience, and maximum variation sampling. In articles where maximum variation sampling was employed, “variation” referred to seeking diversity in participants’ demographics ( n = 7; e.g., age, gender, and education level), while one article did not include details regarding how their maximum variation sampling strategy was operationalized ( Marcinowicz, Abramowicz, Zarzycka, Abramowicz, & Konstantynowicz, 2014 ). Authors of 17 articles did not specify their sampling techniques.
Sample sizes ranged from 8 to 1,932 with nine studies in the 8–10 participant range and 24 studies in the 11–20 participant range. The participant range of 21–30 and 31–50 was reported in eight articles each. Six studies included more than 50 participants. Two of these articles depicted quite large sample sizes (N=253, Hart & Mareno, 2014 ; N=1,932, Lyndon et al., 2014 ) and the authors of these articles described the use of survey instruments and analysis of responses to open-ended questions. This was in contrast to studies with smaller sample sizes where individual interviews and focus groups were more commonly employed.
Data Collection and Data Sources
In a majority of studies, researchers collected data through individual ( n = 39) and/or focus-group ( n = 14) interviews that were semistructured. Most researchers reported that interviews were audiotaped ( n = 51) and interview guides were described as the primary data collection tool in 29 of the 51 studies. In some cases, researchers also described additional data sources, for example, taking memos or field notes during participant observation sessions or as a way to reflect their thoughts about interviews ( n = 10). Written responses to open-ended questions in survey questionnaires were another type of data source in a small number of studies ( n = 4).
Data Analysis
The analysis strategy most commonly used in the QD studies included in this review was qualitative content analysis ( n = 30). Among the studies where this technique was used, most researchers described an inductive approach; researchers of two studies analyzed data both inductively and deductively. Thematic analysis was adopted in 14 studies and the constant comparison technique in 10 studies. In nine studies, researchers employed multiple techniques to analyze data including qualitative content analysis with constant comparison ( Asemani et al., 2014 ; DeBruyn et al., 2014 ; Holland, Christensen, Shone, Kearney, & Kitzman, 2014 ; Li et al., 2014 ) and thematic analysis with constant comparison ( Johansson, Hildingsson, & Fenwick, 2014 ; Oosterveld-Vlug et al., 2014 ). In addition, five teams conducted descriptive statistical analysis using both quantitative and qualitative data and counting the frequencies of codes/themes ( Ewens, Chapman, Tulloch, & Hendricks, 2014 ; Miller, 2014 ; Santos, Sandelowski, & Gualda, 2014 ; Villar, Celdran, Faba, & Serrat, 2014 ) or targeted events through video monitoring ( Martorella, Boitor, Michaud, & Gelinas, 2014 ). Tseng, Chen, and Wang (2014) cited Thorne, Reimer Kirkham, and O’Flynn-Magee (2004)’s interpretive description as the inductive analytic approach. In five out of 55 articles, researchers did not specifically name their analysis strategies, despite including descriptions about procedural aspects of data analysis. Researchers of 20 studies reported that data saturation for their themes was achieved.
Presentation of Findings
Researchers described participants’ experiences of health care, interventions, or illnesses in 18 articles and presented straightforward, focused, detailed descriptions of facilitators, challenges, factors, reasons, and causes in 15 articles. Participants’ perceptions of specific care, interventions, or programs were described in detail in 11 articles. All researchers presented their findings with extensive descriptions including themes or categories. In 25 of 55 articles, figures or tables were also presented to illustrate or summarize the findings. In addition, the authors of three articles summarized, organized, and described their data using key concepts of conceptual models ( Al-Zadjali et al., 2014 ; Oosterveld-Vlug et al., 2014 ; Wiens et al., 2014 ). Martorella et al. (2014) assessed acceptability and feasibility of hand massage therapy and arranged their findings in relation to pre-determined indicators of acceptability and feasibility. In one longitudinal QD study ( Kneck, Fagerberg, Eriksson, & Lundman, 2014 ), the researchers presented the findings as several key patterns of learning for persons living with diabetes; in another longitudinal QD study ( Stegenga & Macpherson, 2014 ), findings were presented as processes and themes regarding patients’ identity work across the cancer trajectory. In another two studies, the researchers described and compared themes or categories from two different perspectives, such as patients and nurses ( Canzan, Heilemann, Saiani, Mortari, & Ambrosi, 2014 ) or parents and children ( Marcinowicz et al., 2014 ). Additionally, Ma (2014) reported themes using both participants’ language and the researcher’s language.
In this systematic review, we examined and reported specific characteristics of methods and findings reported in journal articles self-identified as QD and published during one calendar year. To accomplish this we identified 55 articles that met inclusion criteria, performed a quality appraisal following CASP guidelines, and extracted and analyzed data focusing on QD features. In general, three primary findings emerged. First, despite inconsistencies, most QD publications had the characteristics that were originally observed by Sandelowski (2000) and summarized by other limited available QD literature. Next, there are no clear boundaries in methods used in the QD studies included in this review; in a number of studies, researchers adopted and combined techniques originating from other qualitative traditions to obtain rich data and increase their understanding of the phenomenon under investigation. Finally, justification for how QD was chosen and why it would be an appropriate fit for a particular study is an area in need of increased attention.
In general, the overall characteristics were consistent with design features of QD studies described in the literature ( Neergaard et al., 2009 ; Sandelowski, 2000 , 2010 ; Vaismoradi et al., 2013 ). For example, many authors reported that study objectives were to describe or explore participants’ experiences and factors related to certain phenomena, events, or interventions. In most cases, these authors cited Sandelowski (2000) as a reference for this particular characteristic. It was rare that theoretical or philosophical frameworks were identified, which also is consistent with descriptions of QD. In most studies, researchers used purposeful sampling and its derivative sampling techniques, collected data through interviews, and analyzed data using qualitative content analysis or thematic analysis. Moreover, all researchers presented focused or comprehensive, descriptive summaries of data including themes or categories answering their research questions. These characteristics do not indicate that there are correct ways to do QD studies; rather, they demonstrate how others designed and produced QD studies.
In several studies, researchers combined techniques that originated from other qualitative traditions for sampling, data collection, and analysis. This flexibility or variability, a key feature of recently published QD studies, may indicate that there are no clear boundaries in designing QD studies. Sandelowski (2010) articulated: “in the actual world of research practice, methods bleed into each other; they are so much messier than textbook depictions” (p. 81). Hammersley (2007) also observed:
“We are not so much faced with a set of clearly differentiated qualitative approaches as with a complex landscape of variable practice in which the inhabitants use a range of labels (‘ethnography’, ‘discourse analysis’, ‘life history work’, narrative study’, ……, and so on) in diverse and open-ended ways in order to characterize their orientation, and probably do this somewhat differently across audiences and occasions” (p. 293).
This concept of having no clear boundaries in methods when designing a QD study should enable researchers to obtain rich data and produce a comprehensive summary of data through various data collection and analysis approaches to answer their research questions. For example, using an ethnographical approach (e.g., participant observation) in data collection for a QD study may facilitate an in-depth description of participants’ nonverbal expressions and interactions with others and their environment as well as situations or events in which researchers are interested ( Kawulich, 2005 ). One example found in our review is that Adams et al. (2014) explored family members’ responses to nursing communication strategies for patients in intensive care units (ICUs). In this study, researchers conducted interviews with family members, observed interactions between healthcare providers, patients, and family members in ICUs, attended ICU rounds and family meetings, and took field notes about their observations and reflections. Accordingly, the variability in methods provided Adams and colleagues (2014) with many different aspects of data that were then used to complement participants’ interviews (i.e., data triangulation). Moreover, by using a constant comparison technique in addition to qualitative content analysis or thematic analysis in QD studies, researchers compare each case with others looking for similarities and differences as well as reasoning why differences exist, to generate more general understanding of phenomena of interest ( Thorne, 2000 ). In fact, this constant comparison analysis is compatible with qualitative content analysis and thematic analysis and we found several examples of using this approach in studies we reviewed ( Asemani et al., 2014 ; DeBruyn et al., 2014 ; Holland et al., 2014 ; Johansson et al., 2014 ; Li et al., 2014 ; Oosterveld-Vlug et al., 2014 ).
However, this flexibility or variability in methods of QD studies may cause readers’ as well as researchers’ confusion in designing and often labeling qualitative studies ( Neergaard et al., 2009 ). Especially, it could be difficult for scholars unfamiliar with qualitative studies to differentiate QD studies with “hues, tones, and textures” of qualitative traditions ( Sandelowski, 2000 , p. 337) from grounded theory, phenomenological, and ethnographical research. In fact, the major difference is in the presentation of the findings (or outcomes of qualitative research) ( Neergaard et al., 2009 ; Sandelowski, 2000 ). The final products of grounded theory, phenomenological, and ethnographical research are a generation of a theory, a description of the meaning or essence of people’s lived experience, and an in-depth, narrative description about certain culture, respectively, through researchers’ intensive/deep interpretations, reflections, and/or transformation of data ( Streubert & Carpenter, 2011 ). In contrast, QD studies result in “a rich, straight description” of experiences, perceptions, or events using language from the collected data ( Neergaard et al., 2009 ) through low-inference (or data-near) interpretations during data analysis ( Sandelowski, 2000 , 2010 ). This feature is consistent with our finding regarding presentation of findings: in all QD articles included in this systematic review, the researchers presented focused or comprehensive, descriptive summaries to their research questions.
Finally, an explanation or justification of why a QD approach was chosen or appropriate for the study aims was not found in more than half of studies in the sample. While other qualitative approaches, including grounded theory, phenomenology, ethnography, and narrative analysis, are used to better understand people’s thoughts, behaviors, and situations regarding certain phenomena ( Sullivan-Bolyai et al., 2005 ), as noted above, the results will likely read differently than those for a QD study ( Carter & Little, 2007 ). Therefore, it is important that researchers accurately label and justify their choices of approach, particularly for studies focused on participants’ experiences, which could be addressed with other qualitative traditions. Justifying one’s research epistemology, methodology, and methods allows readers to evaluate these choices for internal consistency, provides context to assist in understanding the findings, and contributes to the transparency of choices, all of which enhance the rigor of the study ( Carter & Little, 2007 ; Wu, Thompson, Aroian, McQuaid, & Deatrick, 2016 ).
Use of the CASP tool drew our attention to the credibility and usefulness of the findings of the QD studies included in this review. Although justification for study design and methods was lacking in many articles, most authors reported techniques of recruitment, data collection, and analysis that appeared. Internal consistencies among study objectives, methods, and findings were achieved in most studies, increasing readers’ confidence that the findings of these studies are credible and useful in understanding under-explored phenomenon of interest.
In summary, our findings support the notion that many scholars employ QD and include a variety of commonly observed characteristics in their study design and subsequent publications. Based on our review, we found that QD as a scholarly approach allows flexibility as research questions and study findings emerge. We encourage authors to provide as many details as possible regarding how QD was chosen for a particular study as well as details regarding methods to facilitate readers’ understanding and evaluation of the study design and rigor. We acknowledge the challenge of strict word limitation with submissions to print journals; potential solutions include collaboration with journal editors and staff to consider creative use of charts or tables, or using more citations and less text in background sections so that methods sections are robust.
Limitations
Several limitations of this review deserve mention. First, only articles where researchers explicitly stated in the main body of the article that a QD design was employed were included. In contrast, articles labeled as QD in only the title or abstract, or without their research design named were not examined due to the lack of certainty that the researchers actually carried out a QD study. As a result, we may have excluded some studies where a QD design was followed. Second, only one database was searched and therefore we did not identify or describe potential studies following a QD approach that were published in non-PubMed databases. Third, our review is limited by reliance on what was included in the published version of a study. In some cases, this may have been a result of word limits or specific styles imposed by journals, or inconsistent reporting preferences of authors and may have limited our ability to appraise the general adequacy with the CASP tool and examine specific characteristics of these studies.
Conclusions
A systematic review was conducted by examining QD research articles focused on nursing-related phenomena and published in one calendar year. Current patterns include some characteristics of QD studies consistent with the previous observations described in the literature, a focus on the flexibility or variability of methods in QD studies, and a need for increased explanations of why QD was an appropriate label for a particular study. Based on these findings, recommendations include encouragement to authors to provide as many details as possible regarding the methods of their QD study. In this way, readers can thoroughly consider and examine if the methods used were effective and reasonable in producing credible and useful findings.
Acknowledgments
This work was supported in part by the John A. Hartford Foundation’s National Hartford Centers of Gerontological Nursing Excellence Award Program.
Hyejin Kim is a Ruth L. Kirschstein NRSA Predoctoral Fellow (F31NR015702) and 2013–2015 National Hartford Centers of Gerontological Nursing Excellence Patricia G. Archbold Scholar. Justine Sefcik is a Ruth L. Kirschstein Predoctoral Fellow (F31NR015693) through the National Institutes of Health, National Institute of Nursing Research.
Conflict of Interest Statement
The Authors declare that there is no conflict of interest.
Contributor Information
Hyejin Kim, MSN, CRNP, Doctoral Candidate, University of Pennsylvania School of Nursing.
Justine S. Sefcik, MS, RN, Doctoral Candidate, University of Pennsylvania School of Nursing.
Christine Bradway, PhD, CRNP, FAAN, Associate Professor of Gerontological Nursing, University of Pennsylvania School of Nursing.
- Adams JA, Anderson RA, Docherty SL, Tulsky JA, Steinhauser KE, Bailey DE., Jr Nursing strategies to support family members of ICU patients at high risk of dying. Heart & Lung. 2014; 43 (5):406–415. [ PMC free article ] [ PubMed ] [ Google Scholar ]
- Ahlin J, Ericson-Lidman E, Norberg A, Strandberg G. Care providers' experiences of guidelines in daily work at a municipal residential care facility for older people. Scandinavian Journal of Caring Sciences. 2014; 28 (2):355–363. [ PubMed ] [ Google Scholar ]
- Al-Zadjali M, Keller C, Larkey L, Evans B. GCC women: causes and processes of midlife weight gain. Health Care for Women International. 2014; 35 (11–12):1267–1286. [ PubMed ] [ Google Scholar ]
- Asemani O, Iman MT, Moattari M, Tabei SZ, Sharif F, Khayyer M. An exploratory study on the elements that might affect medical students' and residents' responsibility during clinical training. Journal of Medical Ethics and History of Medicine. 2014; 7 :8. [ PMC free article ] [ PubMed ] [ Google Scholar ]
- Atefi N, Abdullah KL, Wong LP, Mazlom R. Factors influencing registered nurses perception of their overall job satisfaction: a qualitative study. International Nursing Review. 2014; 61 (3):352–360. [ PubMed ] [ Google Scholar ]
- Ballangrud R, Hall-Lord ML, Persenius M, Hedelin B. Intensive care nurses' perceptions of simulation-based team training for building patient safety in intensive care: a descriptive qualitative study. Intensive and Critical Care Nursing. 2014; 30 (4):179–187. [ PubMed ] [ Google Scholar ]
- Benavides-Vaello S, Katz JR, Peterson JC, Allen CB, Paul R, Charette-Bluff AL, Morris P. Nursing and health sciences workforce diversity research using. PhotoVoice: a college and high school student participatory project. Journal of Nursing Education. 2014; 53 (4):217–222. [ PubMed ] [ Google Scholar ]
- Bernhard C, Zielinski R, Ackerson K, English J. Home birth after hospital birth: women's choices and reflections. Journal of Midwifery and Women's Health. 2014; 59 (2):160–166. [ PubMed ] [ Google Scholar ]
- Borbasi S, Jackson D, Langford RW. Navigating the maze of nursing research: An interactive learning adventure. 2nd. New South Wales, Australia: Mosby/Elsevier; 2008. [ Google Scholar ]
- Bradford B, Maude R. Fetal response to maternal hunger and satiation - novel finding from a qualitative descriptive study of maternal perception of fetal movements. BMC Pregnancy and Childbirth. 2014; 14 :288. [ PMC free article ] [ PubMed ] [ Google Scholar ]
- Burns N, Grove SK. The practice of nursing research: Conduct, critique, & utilization. 5th. Philadelphia, PA: Elsevier/Saunders; 2005. [ Google Scholar ]
- Canzan F, Heilemann MV, Saiani L, Mortari L, Ambrosi E. Visible and invisible caring in nursing from the perspectives of patients and nurses in the gerontological context. Scandinavian Journal of Caring Sciences. 2014; 28 (4):732–740. [ PubMed ] [ Google Scholar ]
- Carter SM, Littler M. Justifying knowledge, justifying methods, taking action: Epistemologies, methodologies, and methods in qualitative research. Qualitative Health Research. 2007; 17 (10):1316–1328. [ PubMed ] [ Google Scholar ]
- Critical Appraisal Skills Programme (CASP 2013) 10 questions to help you make sense of qualitative research. Oxford: CASP; 2013. Retrieved from http://media.wix.com/ugd/dded87_29c5b002d99342f788c6ac670e49f274.pdf . [ Google Scholar ]
- Chan CW, Lopez V. A qualitative descriptive study of risk reduction for coronary disease among the Hong Kong Chinese. Public Health Nursing. 2014; 31 (4):327–335. [ PubMed ] [ Google Scholar ]
- Chen YJ, Tsai YF, Lee SH, Lee HL. Protective factors against suicide among young-old Chinese outpatients. BMC Public Health. 2014; 14 :372. [ PMC free article ] [ PubMed ] [ Google Scholar ]
- Cleveland LM, Bonugli R. Experiences of mothers of infants with neonatal abstinence syndrome in the neonatal intensive care unit. Journal of Obstetric Gynecologic, & Neonatal Nursing. 2014; 43 (3):318–329. [ PubMed ] [ Google Scholar ]
- Corbin J, Strauss A. Basics of qualitative research: Techniques and procedures for developing grounded theory. 3rd. Thousand Oaks, CA: Sage Publications; 2008. [ Google Scholar ]
- Corbin JM, Strauss A. Grounded theory research: Procedures, canons and evaluation criteria. Qualitative Sociology. 1990; 13 (1):3–21. [ Google Scholar ]
- DeBruyn RR, Ochoa-Marin SC, Semenic S. Barriers and facilitators to evidence-based nursing in Colombia: perspectives of nurse educators, nurse researchers and graduate students. Investigación y Educación en Enfermería. 2014; 32 (1):9–21. [ PubMed ] [ Google Scholar ]
- Denzin NK, Lincoln YS. The Discipline and practice of qualitative research. In: Denzin NK, Lincoln YS, editors. Handbook of qualitative research. 2nd. Thousand Oaks, CA: Sage Publications; 2000. pp. 1–28. [ Google Scholar ]
- Ewens B, Chapman R, Tulloch A, Hendricks JM. ICU survivors' utilisation of diaries post discharge: a qualitative descriptive study. Australian Critical Care. 2014; 27 (1):28–35. [ PubMed ] [ Google Scholar ]
- Fantasia HC, Sutherland MA, Fontenot H, Ierardi JA. Knowledge, attitudes and beliefs about contraceptive and sexual consent negotiation among college women. Journal of Forensic Nursing. 2014; 10 (4):199–207. [ PubMed ] [ Google Scholar ]
- Friman A, Wahlberg AC, Mattiasson AC, Ebbeskog B. District nurses' knowledge development in wound management: ongoing learning without organizational support. Primary Health Care Research & Development. 2014; 15 (4):386–395. [ PubMed ] [ Google Scholar ]
- Gaughan V, Logan D, Sethna N, Mott S. Parents' perspective of their journey caring for a child with chronic neuropathic pain. Pain Management Nursing. 2014; 15 (1):246–257. [ PubMed ] [ Google Scholar ]
- Hammersley M. The issue of quality in qualitative research. International Journal of Research & Method in Education. 2007; 30 (3):287–305. [ Google Scholar ]
- Hart PL, Mareno N. Cultural challenges and barriers through the voices of nurses. Journal of Clinical Nursing. 2014; 23 (15–16):2223–2232. [ PubMed ] [ Google Scholar ]
- Hasman K, Kjaergaard H, Esbensen BA. Fathers' experience of childbirth when non-progressive labour occurs and augmentation is established. A qualitative study. Sexual & Reproductive HealthCare. 2014; 5 (2):69–73. [ PubMed ] [ Google Scholar ]
- Higgins I, van der Riet P, Sneesby L, Good P. Nutrition and hydration in dying patients: the perceptions of acute care nurses. Journal of Clinical Nursing. 2014; 23 (17–18):2609–2617. [ PubMed ] [ Google Scholar ]
- Holland ML, Christensen JJ, Shone LP, Kearney MH, Kitzman HJ. Women's reasons for attrition from a nurse home visiting program. Journal of Obstetric, Gynecologic, & Neonatal Nursing. 2014; 43 (1):61–70. [ PMC free article ] [ PubMed ] [ Google Scholar ]
- Johansson M, Hildingsson I, Fenwick J. 'As long as they are safe--birth mode does not matter' Swedish fathers' experiences of decision-making around caesarean section. Women and Birth. 2014; 27 (3):208–213. [ PubMed ] [ Google Scholar ]
- Kao MH, Tsai YF. Illness experiences in middle-aged adults with early-stage knee osteoarthritis: findings from a qualitative study. Journal of Advanced Nursing. 2014; 70 (7):1564–1572. [ PubMed ] [ Google Scholar ]
- Kawulich BB. Participant observation as a data collection method. Forum: Qualitative Social Research. 2005; 6 (2) Art. 43. Retrieved from http://www.qualitative-research.net/index.php/fqs/article/view/466/997 . [ Google Scholar ]
- Kerr D, McKay K, Klim S, Kelly AM, McCann T. Attitudes of emergency department patients about handover at the bedside. Journal of Clinical Nursing. 2014; 23 (11–12):1685–1693. [ PubMed ] [ Google Scholar ]
- Kneck A, Fagerberg I, Eriksson LE, Lundman B. Living with diabetes - development of learning patterns over a 3-year period. International Journal of Qualitative Studies on Health and Well-being. 2014; 9 :24375. [ PMC free article ] [ PubMed ] [ Google Scholar ]
- Krippendorf K. Content analysis: An introduction to its methodology. 2nd. Thousand Oaks, CA: Sage Publications; 2004. [ Google Scholar ]
- Larocque N, Schotsman C, Kaasalainen S, Crawshaw D, McAiney C, Brazil E. Using a book chat to improve attitudes and perceptions of long-term care staff about dementia. Journal of Gerontological Nursing. 2014; 40 (5):46–52. [ PubMed ] [ Google Scholar ]
- Li IC, Lee SY, Chen CY, Jeng YQ, Chen YC. Facilitators and barriers to effective smoking cessation: counselling services for inpatients from nurse-counsellors' perspectives--a qualitative study. International Journal of Environmental Research and Public Health. 2014; 11 (5):4782–4798. [ PMC free article ] [ PubMed ] [ Google Scholar ]
- Lux KM, Hutcheson JB, Peden AR. Ending disruptive behavior: staff nurse recommendations to nurse educators. Nurse Education in Practice. 2014; 14 (1):37–42. [ PubMed ] [ Google Scholar ]
- Lyndon A, Zlatnik MG, Maxfield DG, Lewis A, McMillan C, Kennedy HP. Contributions of clinical disconnections and unresolved conflict to failures in intrapartum safety. Journal of Obstetric, Gynecologic, & Neonatal Nursing. 2014; 43 (1):2–12. [ PMC free article ] [ PubMed ] [ Google Scholar ]
- Ma F, Li J, Liang H, Bai Y, Song J. Baccalaureate nursing students' perspectives on learning about caring in China: a qualitative descriptive study. BMC Medical Education. 2014; 14 :42. [ PMC free article ] [ PubMed ] [ Google Scholar ]
- Ma L. A humanbecoming qualitative descriptive study on quality of life with older adults. Nursing Science Quarterly. 2014; 27 (2):132–141. [ PubMed ] [ Google Scholar ]
- Marcinowicz L, Abramowicz P, Zarzycka D, Abramowicz M, Konstantynowicz J. How hospitalized children and parents perceive nurses and hospital amenities: A qualitative descriptive study in Poland. Journal of Child Health Care. 2014 [ PubMed ] [ Google Scholar ]
- Martorella G, Boitor M, Michaud C, Gelinas C. Feasibility and acceptability of hand massage therapy for pain management of postoperative cardiac surgery patients in the intensive care unit. Heart & Lung. 2014; 43 (5):437–444. [ PubMed ] [ Google Scholar ]
- McDonough A, Callans KM, Carroll DL. Understanding the challenges during transitions of care for children with critical airway conditions. ORL Head and Neck Nursing. 2014; 32 (4):12–17. [ PubMed ] [ Google Scholar ]
- McGilton KS, Boscart VM, Brown M, Bowers B. Making tradeoffs between the reasons to leave and reasons to stay employed in long-term care homes: perspectives of licensed nursing staff. International Journal of Nursing Studies. 2014; 51 (6):917–926. [ PubMed ] [ Google Scholar ]
- Michael N, O'Callaghan C, Baird A, Hiscock N, Clayton J. Cancer caregivers advocate a patient- and family-centered approach to advance care planning. Journal of Pain and Symptom Management. 2014; 47 (6):1064–1077. [ PubMed ] [ Google Scholar ]
- Miller WR. Patient-centered outcomes in older adults with epilepsy. Seizure. 2014; 23 (8):592–597. [ PMC free article ] [ PubMed ] [ Google Scholar ]
- Milne J, Oberle K. Enhancing rigor in qualitative description: a case study. Journal of Wound Ostomy & Continence Nursing. 2005; 32 (6):413–420. [ PubMed ] [ Google Scholar ]
- Neergaard MA, Olesen F, Andersen RS, Sondergaard J. Qualitative description - the poor cousin of health research? BMC Medical Research Methodology. 2009; 9 :52. [ PMC free article ] [ PubMed ] [ Google Scholar ]
- O'Shea MF. Staff nurses' perceptions regarding palliative care for hospitalized older adults. The American Journal of Nursing. 2014; 114 (11):26–34. [ PubMed ] [ Google Scholar ]
- Oosterveld-Vlug MG, Pasman HR, van Gennip IE, Muller MT, Willems DL, Onwuteaka-Philipsen BD. Dignity and the factors that influence it according to nursing home residents: a qualitative interview study. Journal of Advanced Nursing. 2014; 70 (1):97–106. [ PubMed ] [ Google Scholar ]
- Oruche UM, Draucker C, Alkhattab H, Knopf A, Mazurcyk J. Interventions for family members of adolescents with disruptive behavior disorders. Journal of Child and Adolescent Psychiatric Nursing. 2014; 27 (3):99–108. [ PMC free article ] [ PubMed ] [ Google Scholar ]
- Parse RR. Qualitative inquiry: The path of sciencing. Sudbury, MA: Jones and Barlett; 2001. [ Google Scholar ]
- Peacock SC, Hammond-Collins K, Forbes DA. The journey with dementia from the perspective of bereaved family caregivers: a qualitative descriptive study. BMC Nursing. 2014; 13 (1):42. [ PMC free article ] [ PubMed ] [ Google Scholar ]
- Peterson WE, Sprague AE, Reszel J, Walker M, Fell DB, Perkins SL, Johnson M. Women's perspectives of the fetal fibronectin testing process: a qualitative descriptive study. BMC Pregnancy and Childbirth. 2014; 14 :190. [ PMC free article ] [ PubMed ] [ Google Scholar ]
- Polit DF, Beck CT. Nursing research: principles and methods. 7. Philadelphia, PA: Lippincott Williams & Wilkins; 2004. [ Google Scholar ]
- Polit DF, Beck CT. International differences in nursing research, 2005–2006. Journal of Nursing Scholarship. 2009; 41 (1):44–53. [ PubMed ] [ Google Scholar ]
- Polit DF, Beck CT. Nursing research: generating and assessing evidence for nursing practice. 9. Philadelphia, PA: Wolters Kluwer Health/Lippincott Williams & Wilkins; 2012. [ Google Scholar ]
- Polit DF, Beck CT. Essentials of Nursing Research: Appraising Evidence for Nursing Practice. 8. Philadelphia, PA: Wolters Kluwer Health; Lippincott Willians & Wilkins; 2014. Supplement for Chapter 14: Qualitative Descriptive Studies. Retrieved from http://downloads.lww.com/wolterskluwer_vitalstream_com/sample-content/9781451176797_Polit/samples/CS_Chapter_14.pdf . [ Google Scholar ]
- Pope C, Mays N. Qualitative research in health care. 3rd. Victoria, Australia: Blackwell Publishing; 2006. [ Google Scholar ]
- Pope C, Mays N. Reaching the parts other methods cannot reach: an introduction to qualitative methods in health and health services research. BMJ. 1995; 311 (6996):42–45. [ PMC free article ] [ PubMed ] [ Google Scholar ]
- Raphael D, Waterworth S, Gott M. The role of practice nurses in providing palliative and end-of-life care to older patients with long-term conditions. International Journal of Palliative Nursing. 2014; 20 (8):373–379. [ PubMed ] [ Google Scholar ]
- Saldana J. Longitudinal qualitative research: Analyzing change through time. Walnut Creek, CA: AltaMira Press; 2003. [ Google Scholar ]
- Sandelowski M. Whatever happened to qualitative description? Research in Nursing & Health. 2000; 23 (4):334–340. [ PubMed ] [ Google Scholar ]
- Sandelowski M. What's in a name? Qualitative description revisited. Research in Nursing & Health. 2010; 33 (1):77–84. [ PubMed ] [ Google Scholar ]
- Santos HP, Jr, Sandelowski M, Gualda DM. Bad thoughts: Brazilian women's responses to mothering while experiencing postnatal depression. Midwifery. 2014; 30 (6):788–794. [ PubMed ] [ Google Scholar ]
- Sharp R, Grech C, Fielder A, Mikocka-Walus A, Cummings M, Esterman A. The patient experience of a peripherally inserted central catheter (PICC): A qualitative descriptive study. Contemporary Nurse. 2014; 48 (1):26–35. [ PubMed ] [ Google Scholar ]
- Soule I. Cultural competence in health care: an emerging theory. ANS Advances in Nursing Science. 2014; 37 (1):48–60. [ PubMed ] [ Google Scholar ]
- Stegenga K, Macpherson CF. "I'm a survivor, go study that word and you'll see my name": adolescent and cancer identity work over the first year after diagnosis. Cancer Nursing. 2014; 37 (6):418–428. [ PubMed ] [ Google Scholar ]
- Streubert HJ, Carpenter DR. Qualitative research in nursing: Advancing the humanistic imperative. 5th. Philadelphia, PA: Lippincott Williams & Wilkins; 2011. [ Google Scholar ]
- Sturesson A, Ziegert K. Prepare the patient for future challenges when facing hemodialysis: nurses' experiences. International Journal of Qualitative Studies on Health and Well-being. 2014; 9 :22952. [ PMC free article ] [ PubMed ] [ Google Scholar ]
- Sullivan-Bolyai S, Bova C, Harper D. Developing and refining interventions in persons with health disparities: the use of qualitative description. Nursing Outlook. 2005; 53 (3):127–133. [ PubMed ] [ Google Scholar ]
- Sundqvist AS, Carlsson AA. Holding the patient's life in my hands: Swedish registered nurse anaesthetists' perspective of advocacy. Scandinavian Journal of Caring Sciences. 2014; 28 (2):281–288. [ PubMed ] [ Google Scholar ]
- Thomson Reuters. EndNote X7. 2014 Retrieved from http://endnote.com/product-details/x7 .
- Thorne S. Data analysis in qualitative research. Evidence Based Nursing. 2000; 3 :68–70. [ Google Scholar ]
- Thorne S, Reimer Kirkham S, O’Flynn-Magee K. The analytic challenge in interpretive description. International Journal of Qualitative Methods. 2004; 3 (1):1–11. [ Google Scholar ]
- Tseng YF, Chen CH, Wang HH. Taiwanese women's process of recovery from stillbirth: a qualitative descriptive study. Research in Nursing & Health. 2014; 37 (3):219–228. [ PubMed ] [ Google Scholar ]
- Vaismoradi M, Jordan S, Turunen H, Bondas T. Nursing students' perspectives of the cause of medication errors. Nurse Education Today. 2014; 34 (3):434–440. [ PubMed ] [ Google Scholar ]
- Vaismoradi M, Turunen H, Bondas T. Content analysis and thematic analysis: Implications for conducting a qualitative descriptive study. Nursing & Health Sciences. 2013; 15 (3):398–405. [ PubMed ] [ Google Scholar ]
- Valizadeh L, Zamanzadeh V, Fooladi MM, Azadi A, Negarandeh R, Monadi M. The image of nursing, as perceived by Iranian male nurses. Nursing & Health Sciences. 2014; 16 (3):307–313. [ PubMed ] [ Google Scholar ]
- Villar F, Celdran M, Faba J, Serrat R. Barriers to sexual expression in residential aged care facilities (RACFs): comparison of staff and residents' views. Journal of Advanced Nursing. 2014; 70 (11):2518–2527. [ PubMed ] [ Google Scholar ]
- Wiens S, Babenko-Mould Y, Iwasiw C. Clinical instructors' perceptions of structural and psychological empowerment in academic nursing environments. Journal of Nursing Education. 2014; 53 (5):265–270. [ PubMed ] [ Google Scholar ]
- Willis DG, Sullivan-Bolyai S, Knafl K, Zichi-Cohen M. Distinguishing Features and Similarities Between Descriptive Phenomenological and Qualitative Description Research. West J Nurs Res. 2016 [ PubMed ] [ Google Scholar ]
- Wu YP, Thompson D, Aroian KJ, McQuaid EL, Deatrick JA. Commentary: Writing and Evaluating Qualitative Research Reports. J Pediatr Psychol. 2016; 41 (5):493–505. [ PMC free article ] [ PubMed ] [ Google Scholar ]
- Zhang H, Shan W, Jiang A. The meaning of life and health experience for the Chinese elderly with chronic illness: a qualitative study from positive health philosophy. International Journal of Nursing Practice. 2014; 20 (5):530–539. [ PubMed ] [ Google Scholar ]

- Section 2: Home
- Developing the Quantitative Research Design
- Qualitative Descriptive Design
Overview of Descriptive Design
Sources of data.
- Design and Development Research (DDR) For Instructional Design
- Qualitative Narrative Inquiry Research
- Action Research Resource
- Case Study Design in an Applied Doctorate
- SAGE Research Methods
- Research Examples (SAGE) This link opens in a new window
- Dataset Examples (SAGE) This link opens in a new window
- IRB Resource Center This link opens in a new window
A descriptive design is a flexible, exploratory approach to qualitative research. Descriptive design is referred to in the literature by other labels including generic, general, basic, traditional, interpretive, and pragmatic. Descriptive design as an acceptable research design for dissertation and other robust scholarly research has received varying degrees of acceptance within the academic community. However, descriptive design has been gaining momentum since the early 2000’s as a suitable design for studies that do not fall into the more mainstream genres of qualitative research (ie. Case study, phenomenology, ethnography, narrative inquiry and grounded theory). In contrast to other qualitative designs, descriptive design is not aligned to specific methods (for example, bracketing in phenomenology, bounded systems in case study, or constant comparative analysis in grounded theory). Rather, descriptive design “borrows” methods appropriate to the proposed study from other designs.
Arguments supporting the flexible nature of descriptive designs describe it as being preferable to forcing a research approach into a design that is not quite appropriate for the nature of the intended study. However, descriptive design has also been criticized for this mixing of methods as well as for the limited literature describing it. The descriptive design can be the foundation for a rigorous study within the ADE program. Because of the flexibility of the methods used, a descriptive design provides the researcher with the opportunity to choose methods best suited to a practice-based research purpose.
- Example Descriptive Design in an Applied Doctorate
| best suited to descriptive design are about the practical consequences and useful applications about an issue or problem. | of descriptive design is to answer exploratory qualitative questions that do not fit into the framework of a more traditional design | can draw on any type of qualitative source including personal accounts (ie. Interviews), documents, or artifacts. |
| Benefits | Cautions |
|---|---|
| A practical design appropriate for practitioners in the field Examines participants’ perceptions or experiences related to a practice problem Appropriate when the purpose of the research does not require intense to sustained interactions with participants Since it draws on or “borrows” methods from other designs, it is a flexible design that is malleable to a variety of research situations. | More than one data source may be needed for triangulation Deep or intense understandings of life experiences or complex phenomenon may suggest an alternative design such as phenomenology or narrative inquiry Without specific, aligned methods, descriptive design novice researchers can unintentionally introduce “method slurring” and produce a study not based in a rigorous philosophical paradigm as are more traditional designs. |
Sources of Data in Descriptive Design
Because of the exploratory nature of descriptive design, the triangulation of multiple sources of data are often used for additional insight into the phenomenon. Sources of data that can be used in descriptive studies are similar to those that may be used in other qualitative designs and include interviews, focus groups, documents, artifacts, and observations.
The following video provides additional considerations for triangulation in qualitative designs including descriptive design: Triangulation: Pairing Thematic and Content Analysis
- << Previous: Developing the Qualitative Research Design
- Next: Design and Development Research (DDR) For Instructional Design >>
- Last Updated: Jul 28, 2023 8:05 AM
- URL: https://resources.nu.edu/c.php?g=1013605
© Copyright 2024 National University. All Rights Reserved.
Privacy Policy | Consumer Information

Bridging the Gap: Overcome these 7 flaws in descriptive research design
Descriptive research design is a powerful tool used by scientists and researchers to gather information about a particular group or phenomenon. This type of research provides a detailed and accurate picture of the characteristics and behaviors of a particular population or subject. By observing and collecting data on a given topic, descriptive research helps researchers gain a deeper understanding of a specific issue and provides valuable insights that can inform future studies.
In this blog, we will explore the definition, characteristics, and common flaws in descriptive research design, and provide tips on how to avoid these pitfalls to produce high-quality results. Whether you are a seasoned researcher or a student just starting, understanding the fundamentals of descriptive research design is essential to conducting successful scientific studies.
Table of Contents
What Is Descriptive Research Design?
The descriptive research design involves observing and collecting data on a given topic without attempting to infer cause-and-effect relationships. The goal of descriptive research is to provide a comprehensive and accurate picture of the population or phenomenon being studied and to describe the relationships, patterns, and trends that exist within the data.
Descriptive research methods can include surveys, observational studies , and case studies, and the data collected can be qualitative or quantitative . The findings from descriptive research provide valuable insights and inform future research, but do not establish cause-and-effect relationships.
Importance of Descriptive Research in Scientific Studies
1. understanding of a population or phenomenon.
Descriptive research provides a comprehensive picture of the characteristics and behaviors of a particular population or phenomenon, allowing researchers to gain a deeper understanding of the topic.
2. Baseline Information
The information gathered through descriptive research can serve as a baseline for future research and provide a foundation for further studies.
3. Informative Data
Descriptive research can provide valuable information and insights into a particular topic, which can inform future research, policy decisions, and programs.
4. Sampling Validation
Descriptive research can be used to validate sampling methods and to help researchers determine the best approach for their study.
5. Cost Effective
Descriptive research is often less expensive and less time-consuming than other research methods , making it a cost-effective way to gather information about a particular population or phenomenon.
6. Easy to Replicate
Descriptive research is straightforward to replicate, making it a reliable way to gather and compare information from multiple sources.
Key Characteristics of Descriptive Research Design
The primary purpose of descriptive research is to describe the characteristics, behaviors, and attributes of a particular population or phenomenon.
2. Participants and Sampling
Descriptive research studies a particular population or sample that is representative of the larger population being studied. Furthermore, sampling methods can include convenience, stratified, or random sampling.
3. Data Collection Techniques
Descriptive research typically involves the collection of both qualitative and quantitative data through methods such as surveys, observational studies, case studies, or focus groups.
4. Data Analysis
Descriptive research data is analyzed to identify patterns, relationships, and trends within the data. Statistical techniques , such as frequency distributions and descriptive statistics, are commonly used to summarize and describe the data.
5. Focus on Description
Descriptive research is focused on describing and summarizing the characteristics of a particular population or phenomenon. It does not make causal inferences.
6. Non-Experimental
Descriptive research is non-experimental, meaning that the researcher does not manipulate variables or control conditions. The researcher simply observes and collects data on the population or phenomenon being studied.
When Can a Researcher Conduct Descriptive Research?
A researcher can conduct descriptive research in the following situations:
- To better understand a particular population or phenomenon
- To describe the relationships between variables
- To describe patterns and trends
- To validate sampling methods and determine the best approach for a study
- To compare data from multiple sources.
Types of Descriptive Research Design
1. survey research.
Surveys are a type of descriptive research that involves collecting data through self-administered or interviewer-administered questionnaires. Additionally, they can be administered in-person, by mail, or online, and can collect both qualitative and quantitative data.
2. Observational Research
Observational research involves observing and collecting data on a particular population or phenomenon without manipulating variables or controlling conditions. It can be conducted in naturalistic settings or controlled laboratory settings.
3. Case Study Research
Case study research is a type of descriptive research that focuses on a single individual, group, or event. It involves collecting detailed information on the subject through a variety of methods, including interviews, observations, and examination of documents.
4. Focus Group Research
Focus group research involves bringing together a small group of people to discuss a particular topic or product. Furthermore, the group is usually moderated by a researcher and the discussion is recorded for later analysis.
5. Ethnographic Research
Ethnographic research involves conducting detailed observations of a particular culture or community. It is often used to gain a deep understanding of the beliefs, behaviors, and practices of a particular group.
Advantages of Descriptive Research Design
1. provides a comprehensive understanding.
Descriptive research provides a comprehensive picture of the characteristics, behaviors, and attributes of a particular population or phenomenon, which can be useful in informing future research and policy decisions.
2. Non-invasive
Descriptive research is non-invasive and does not manipulate variables or control conditions, making it a suitable method for sensitive or ethical concerns.
3. Flexibility
Descriptive research allows for a wide range of data collection methods , including surveys, observational studies, case studies, and focus groups, making it a flexible and versatile research method.
4. Cost-effective
Descriptive research is often less expensive and less time-consuming than other research methods. Moreover, it gives a cost-effective option to many researchers.
5. Easy to Replicate
Descriptive research is easy to replicate, making it a reliable way to gather and compare information from multiple sources.
6. Informs Future Research
The insights gained from a descriptive research can inform future research and inform policy decisions and programs.
Disadvantages of Descriptive Research Design
1. limited scope.
Descriptive research only provides a snapshot of the current situation and cannot establish cause-and-effect relationships.
2. Dependence on Existing Data
Descriptive research relies on existing data, which may not always be comprehensive or accurate.
3. Lack of Control
Researchers have no control over the variables in descriptive research, which can limit the conclusions that can be drawn.
The researcher’s own biases and preconceptions can influence the interpretation of the data.
5. Lack of Generalizability
Descriptive research findings may not be applicable to other populations or situations.
6. Lack of Depth
Descriptive research provides a surface-level understanding of a phenomenon, rather than a deep understanding.
7. Time-consuming
Descriptive research often requires a large amount of data collection and analysis, which can be time-consuming and resource-intensive.
7 Ways to Avoid Common Flaws While Designing Descriptive Research
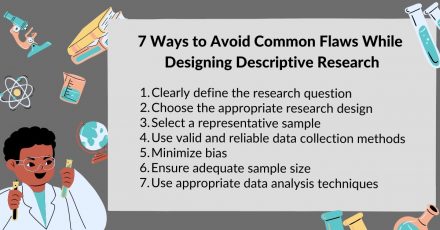
1. Clearly define the research question
A clearly defined research question is the foundation of any research study, and it is important to ensure that the question is both specific and relevant to the topic being studied.
2. Choose the appropriate research design
Choosing the appropriate research design for a study is crucial to the success of the study. Moreover, researchers should choose a design that best fits the research question and the type of data needed to answer it.
3. Select a representative sample
Selecting a representative sample is important to ensure that the findings of the study are generalizable to the population being studied. Researchers should use a sampling method that provides a random and representative sample of the population.
4. Use valid and reliable data collection methods
Using valid and reliable data collection methods is important to ensure that the data collected is accurate and can be used to answer the research question. Researchers should choose methods that are appropriate for the study and that can be administered consistently and systematically.
5. Minimize bias
Bias can significantly impact the validity and reliability of research findings. Furthermore, it is important to minimize bias in all aspects of the study, from the selection of participants to the analysis of data.
6. Ensure adequate sample size
An adequate sample size is important to ensure that the results of the study are statistically significant and can be generalized to the population being studied.
7. Use appropriate data analysis techniques
The appropriate data analysis technique depends on the type of data collected and the research question being asked. Researchers should choose techniques that are appropriate for the data and the question being asked.
Have you worked on descriptive research designs? How was your experience creating a descriptive design? What challenges did you face? Do write to us or leave a comment below and share your insights on descriptive research designs!

extremely very educative
Indeed very educative and useful. Well explained. Thank you
Simple,easy to understand
Excellent and easy to understand queries and questions get answered easily. Its rather clear than any confusion. Thanks a million Shritika Sirisilla.
Easy to understand. Well written , educative and informative
Rate this article Cancel Reply
Your email address will not be published.

Enago Academy's Most Popular Articles

- Publishing Research
10 Tips to Prevent Research Papers From Being Retracted
Research paper retractions represent a critical event in the scientific community. When a published article…

- Industry News
Google Releases 2024 Scholar Metrics, Evaluates Impact of Scholarly Articles
Google has released its 2024 Scholar Metrics, assessing scholarly articles from 2019 to 2023. This…
![What is Academic Integrity and How to Uphold it [FREE CHECKLIST]](https://www.enago.com/academy/wp-content/uploads/2024/05/FeatureImages-59-210x136.png "descriptive research design theory")
Ensuring Academic Integrity and Transparency in Academic Research: A comprehensive checklist for researchers
Academic integrity is the foundation upon which the credibility and value of scientific findings are…

- Reporting Research
How to Optimize Your Research Process: A step-by-step guide
For researchers across disciplines, the path to uncovering novel findings and insights is often filled…

- Trending Now
Breaking Barriers: Sony and Nature unveil “Women in Technology Award”
Sony Group Corporation and the prestigious scientific journal Nature have collaborated to launch the inaugural…
Choosing the Right Analytical Approach: Thematic analysis vs. content analysis for…
Comparing Cross Sectional and Longitudinal Studies: 5 steps for choosing the right…
Research Recommendations – Guiding policy-makers for evidence-based decision making

Sign-up to read more
Subscribe for free to get unrestricted access to all our resources on research writing and academic publishing including:
- 2000+ blog articles
- 50+ Webinars
- 10+ Expert podcasts
- 50+ Infographics
- 10+ Checklists
- Research Guides
We hate spam too. We promise to protect your privacy and never spam you.
- AI in Academia
- Promoting Research
- Career Corner
- Diversity and Inclusion
- Infographics
- Expert Video Library
- Other Resources
- Enago Learn
- Upcoming & On-Demand Webinars
- Peer Review Week 2024
- Open Access Week 2023
- Conference Videos
- Enago Report
- Journal Finder
- Enago Plagiarism & AI Grammar Check
- Editing Services
- Publication Support Services
- Research Impact
- Translation Services
- Publication solutions
- AI-Based Solutions
- Thought Leadership
- Call for Articles
- Call for Speakers
- Author Training
- Edit Profile
I am looking for Editing/ Proofreading services for my manuscript Tentative date of next journal submission:

In your opinion, what is the most effective way to improve integrity in the peer review process?
Have a language expert improve your writing
Run a free plagiarism check in 10 minutes, generate accurate citations for free.
- Knowledge Base
Methodology
- What Is a Research Design | Types, Guide & Examples
What Is a Research Design | Types, Guide & Examples
Published on June 7, 2021 by Shona McCombes . Revised on November 20, 2023 by Pritha Bhandari.
A research design is a strategy for answering your research question using empirical data. Creating a research design means making decisions about:
- Your overall research objectives and approach
- Whether you’ll rely on primary research or secondary research
- Your sampling methods or criteria for selecting subjects
- Your data collection methods
- The procedures you’ll follow to collect data
- Your data analysis methods
A well-planned research design helps ensure that your methods match your research objectives and that you use the right kind of analysis for your data.
Table of contents
Step 1: consider your aims and approach, step 2: choose a type of research design, step 3: identify your population and sampling method, step 4: choose your data collection methods, step 5: plan your data collection procedures, step 6: decide on your data analysis strategies, other interesting articles, frequently asked questions about research design.
- Introduction
Before you can start designing your research, you should already have a clear idea of the research question you want to investigate.
There are many different ways you could go about answering this question. Your research design choices should be driven by your aims and priorities—start by thinking carefully about what you want to achieve.
The first choice you need to make is whether you’ll take a qualitative or quantitative approach.
| Qualitative approach | Quantitative approach |
|---|---|
| and describe frequencies, averages, and correlations about relationships between variables |
Qualitative research designs tend to be more flexible and inductive , allowing you to adjust your approach based on what you find throughout the research process.
Quantitative research designs tend to be more fixed and deductive , with variables and hypotheses clearly defined in advance of data collection.
It’s also possible to use a mixed-methods design that integrates aspects of both approaches. By combining qualitative and quantitative insights, you can gain a more complete picture of the problem you’re studying and strengthen the credibility of your conclusions.
Practical and ethical considerations when designing research
As well as scientific considerations, you need to think practically when designing your research. If your research involves people or animals, you also need to consider research ethics .
- How much time do you have to collect data and write up the research?
- Will you be able to gain access to the data you need (e.g., by travelling to a specific location or contacting specific people)?
- Do you have the necessary research skills (e.g., statistical analysis or interview techniques)?
- Will you need ethical approval ?
At each stage of the research design process, make sure that your choices are practically feasible.
Here's why students love Scribbr's proofreading services
Discover proofreading & editing
Within both qualitative and quantitative approaches, there are several types of research design to choose from. Each type provides a framework for the overall shape of your research.
Types of quantitative research designs
Quantitative designs can be split into four main types.
- Experimental and quasi-experimental designs allow you to test cause-and-effect relationships
- Descriptive and correlational designs allow you to measure variables and describe relationships between them.
| Type of design | Purpose and characteristics |
|---|---|
| Experimental | relationships effect on a |
| Quasi-experimental | ) |
| Correlational | |
| Descriptive |
With descriptive and correlational designs, you can get a clear picture of characteristics, trends and relationships as they exist in the real world. However, you can’t draw conclusions about cause and effect (because correlation doesn’t imply causation ).
Experiments are the strongest way to test cause-and-effect relationships without the risk of other variables influencing the results. However, their controlled conditions may not always reflect how things work in the real world. They’re often also more difficult and expensive to implement.
Types of qualitative research designs
Qualitative designs are less strictly defined. This approach is about gaining a rich, detailed understanding of a specific context or phenomenon, and you can often be more creative and flexible in designing your research.
The table below shows some common types of qualitative design. They often have similar approaches in terms of data collection, but focus on different aspects when analyzing the data.
| Type of design | Purpose and characteristics |
|---|---|
| Grounded theory | |
| Phenomenology |
Your research design should clearly define who or what your research will focus on, and how you’ll go about choosing your participants or subjects.
In research, a population is the entire group that you want to draw conclusions about, while a sample is the smaller group of individuals you’ll actually collect data from.
Defining the population
A population can be made up of anything you want to study—plants, animals, organizations, texts, countries, etc. In the social sciences, it most often refers to a group of people.
For example, will you focus on people from a specific demographic, region or background? Are you interested in people with a certain job or medical condition, or users of a particular product?
The more precisely you define your population, the easier it will be to gather a representative sample.
- Sampling methods
Even with a narrowly defined population, it’s rarely possible to collect data from every individual. Instead, you’ll collect data from a sample.
To select a sample, there are two main approaches: probability sampling and non-probability sampling . The sampling method you use affects how confidently you can generalize your results to the population as a whole.
| Probability sampling | Non-probability sampling |
|---|---|
Probability sampling is the most statistically valid option, but it’s often difficult to achieve unless you’re dealing with a very small and accessible population.
For practical reasons, many studies use non-probability sampling, but it’s important to be aware of the limitations and carefully consider potential biases. You should always make an effort to gather a sample that’s as representative as possible of the population.
Case selection in qualitative research
In some types of qualitative designs, sampling may not be relevant.
For example, in an ethnography or a case study , your aim is to deeply understand a specific context, not to generalize to a population. Instead of sampling, you may simply aim to collect as much data as possible about the context you are studying.
In these types of design, you still have to carefully consider your choice of case or community. You should have a clear rationale for why this particular case is suitable for answering your research question .
For example, you might choose a case study that reveals an unusual or neglected aspect of your research problem, or you might choose several very similar or very different cases in order to compare them.
Data collection methods are ways of directly measuring variables and gathering information. They allow you to gain first-hand knowledge and original insights into your research problem.
You can choose just one data collection method, or use several methods in the same study.
Survey methods
Surveys allow you to collect data about opinions, behaviors, experiences, and characteristics by asking people directly. There are two main survey methods to choose from: questionnaires and interviews .
| Questionnaires | Interviews |
|---|---|
| ) |
Observation methods
Observational studies allow you to collect data unobtrusively, observing characteristics, behaviors or social interactions without relying on self-reporting.
Observations may be conducted in real time, taking notes as you observe, or you might make audiovisual recordings for later analysis. They can be qualitative or quantitative.
| Quantitative observation | |
|---|---|
Other methods of data collection
There are many other ways you might collect data depending on your field and topic.
| Field | Examples of data collection methods |
|---|---|
| Media & communication | Collecting a sample of texts (e.g., speeches, articles, or social media posts) for data on cultural norms and narratives |
| Psychology | Using technologies like neuroimaging, eye-tracking, or computer-based tasks to collect data on things like attention, emotional response, or reaction time |
| Education | Using tests or assignments to collect data on knowledge and skills |
| Physical sciences | Using scientific instruments to collect data on things like weight, blood pressure, or chemical composition |
If you’re not sure which methods will work best for your research design, try reading some papers in your field to see what kinds of data collection methods they used.
Secondary data
If you don’t have the time or resources to collect data from the population you’re interested in, you can also choose to use secondary data that other researchers already collected—for example, datasets from government surveys or previous studies on your topic.
With this raw data, you can do your own analysis to answer new research questions that weren’t addressed by the original study.
Using secondary data can expand the scope of your research, as you may be able to access much larger and more varied samples than you could collect yourself.
However, it also means you don’t have any control over which variables to measure or how to measure them, so the conclusions you can draw may be limited.
As well as deciding on your methods, you need to plan exactly how you’ll use these methods to collect data that’s consistent, accurate, and unbiased.
Planning systematic procedures is especially important in quantitative research, where you need to precisely define your variables and ensure your measurements are high in reliability and validity.
Operationalization
Some variables, like height or age, are easily measured. But often you’ll be dealing with more abstract concepts, like satisfaction, anxiety, or competence. Operationalization means turning these fuzzy ideas into measurable indicators.
If you’re using observations , which events or actions will you count?
If you’re using surveys , which questions will you ask and what range of responses will be offered?
You may also choose to use or adapt existing materials designed to measure the concept you’re interested in—for example, questionnaires or inventories whose reliability and validity has already been established.
Reliability and validity
Reliability means your results can be consistently reproduced, while validity means that you’re actually measuring the concept you’re interested in.
| Reliability | Validity |
|---|---|
| ) ) |
For valid and reliable results, your measurement materials should be thoroughly researched and carefully designed. Plan your procedures to make sure you carry out the same steps in the same way for each participant.
If you’re developing a new questionnaire or other instrument to measure a specific concept, running a pilot study allows you to check its validity and reliability in advance.
Sampling procedures
As well as choosing an appropriate sampling method , you need a concrete plan for how you’ll actually contact and recruit your selected sample.
That means making decisions about things like:
- How many participants do you need for an adequate sample size?
- What inclusion and exclusion criteria will you use to identify eligible participants?
- How will you contact your sample—by mail, online, by phone, or in person?
If you’re using a probability sampling method , it’s important that everyone who is randomly selected actually participates in the study. How will you ensure a high response rate?
If you’re using a non-probability method , how will you avoid research bias and ensure a representative sample?
Data management
It’s also important to create a data management plan for organizing and storing your data.
Will you need to transcribe interviews or perform data entry for observations? You should anonymize and safeguard any sensitive data, and make sure it’s backed up regularly.
Keeping your data well-organized will save time when it comes to analyzing it. It can also help other researchers validate and add to your findings (high replicability ).
On its own, raw data can’t answer your research question. The last step of designing your research is planning how you’ll analyze the data.
Quantitative data analysis
In quantitative research, you’ll most likely use some form of statistical analysis . With statistics, you can summarize your sample data, make estimates, and test hypotheses.
Using descriptive statistics , you can summarize your sample data in terms of:
- The distribution of the data (e.g., the frequency of each score on a test)
- The central tendency of the data (e.g., the mean to describe the average score)
- The variability of the data (e.g., the standard deviation to describe how spread out the scores are)
The specific calculations you can do depend on the level of measurement of your variables.
Using inferential statistics , you can:
- Make estimates about the population based on your sample data.
- Test hypotheses about a relationship between variables.
Regression and correlation tests look for associations between two or more variables, while comparison tests (such as t tests and ANOVAs ) look for differences in the outcomes of different groups.
Your choice of statistical test depends on various aspects of your research design, including the types of variables you’re dealing with and the distribution of your data.
Qualitative data analysis
In qualitative research, your data will usually be very dense with information and ideas. Instead of summing it up in numbers, you’ll need to comb through the data in detail, interpret its meanings, identify patterns, and extract the parts that are most relevant to your research question.
Two of the most common approaches to doing this are thematic analysis and discourse analysis .
| Approach | Characteristics |
|---|---|
| Thematic analysis | |
| Discourse analysis |
There are many other ways of analyzing qualitative data depending on the aims of your research. To get a sense of potential approaches, try reading some qualitative research papers in your field.
If you want to know more about the research process , methodology , research bias , or statistics , make sure to check out some of our other articles with explanations and examples.
- Simple random sampling
- Stratified sampling
- Cluster sampling
- Likert scales
- Reproducibility
Statistics
- Null hypothesis
- Statistical power
- Probability distribution
- Effect size
- Poisson distribution
Research bias
- Optimism bias
- Cognitive bias
- Implicit bias
- Hawthorne effect
- Anchoring bias
- Explicit bias
A research design is a strategy for answering your research question . It defines your overall approach and determines how you will collect and analyze data.
A well-planned research design helps ensure that your methods match your research aims, that you collect high-quality data, and that you use the right kind of analysis to answer your questions, utilizing credible sources . This allows you to draw valid , trustworthy conclusions.
Quantitative research designs can be divided into two main categories:
- Correlational and descriptive designs are used to investigate characteristics, averages, trends, and associations between variables.
- Experimental and quasi-experimental designs are used to test causal relationships .
Qualitative research designs tend to be more flexible. Common types of qualitative design include case study , ethnography , and grounded theory designs.
The priorities of a research design can vary depending on the field, but you usually have to specify:
- Your research questions and/or hypotheses
- Your overall approach (e.g., qualitative or quantitative )
- The type of design you’re using (e.g., a survey , experiment , or case study )
- Your data collection methods (e.g., questionnaires , observations)
- Your data collection procedures (e.g., operationalization , timing and data management)
- Your data analysis methods (e.g., statistical tests or thematic analysis )
A sample is a subset of individuals from a larger population . Sampling means selecting the group that you will actually collect data from in your research. For example, if you are researching the opinions of students in your university, you could survey a sample of 100 students.
In statistics, sampling allows you to test a hypothesis about the characteristics of a population.
Operationalization means turning abstract conceptual ideas into measurable observations.
For example, the concept of social anxiety isn’t directly observable, but it can be operationally defined in terms of self-rating scores, behavioral avoidance of crowded places, or physical anxiety symptoms in social situations.
Before collecting data , it’s important to consider how you will operationalize the variables that you want to measure.
A research project is an academic, scientific, or professional undertaking to answer a research question . Research projects can take many forms, such as qualitative or quantitative , descriptive , longitudinal , experimental , or correlational . What kind of research approach you choose will depend on your topic.
Cite this Scribbr article
If you want to cite this source, you can copy and paste the citation or click the “Cite this Scribbr article” button to automatically add the citation to our free Citation Generator.
McCombes, S. (2023, November 20). What Is a Research Design | Types, Guide & Examples. Scribbr. Retrieved August 23, 2024, from https://www.scribbr.com/methodology/research-design/
Is this article helpful?
Shona McCombes
Other students also liked, guide to experimental design | overview, steps, & examples, how to write a research proposal | examples & templates, ethical considerations in research | types & examples, get unlimited documents corrected.
✔ Free APA citation check included ✔ Unlimited document corrections ✔ Specialized in correcting academic texts
- Search Menu
Sign in through your institution
- Browse content in Arts and Humanities
- Browse content in Archaeology
- Anglo-Saxon and Medieval Archaeology
- Archaeological Methodology and Techniques
- Archaeology by Region
- Archaeology of Religion
- Archaeology of Trade and Exchange
- Biblical Archaeology
- Contemporary and Public Archaeology
- Environmental Archaeology
- Historical Archaeology
- History and Theory of Archaeology
- Industrial Archaeology
- Landscape Archaeology
- Mortuary Archaeology
- Prehistoric Archaeology
- Underwater Archaeology
- Zooarchaeology
- Browse content in Architecture
- Architectural Structure and Design
- History of Architecture
- Residential and Domestic Buildings
- Theory of Architecture
- Browse content in Art
- Art Subjects and Themes
- History of Art
- Industrial and Commercial Art
- Theory of Art
- Biographical Studies
- Byzantine Studies
- Browse content in Classical Studies
- Classical History
- Classical Philosophy
- Classical Mythology
- Classical Numismatics
- Classical Literature
- Classical Reception
- Classical Art and Architecture
- Classical Oratory and Rhetoric
- Greek and Roman Epigraphy
- Greek and Roman Law
- Greek and Roman Papyrology
- Greek and Roman Archaeology
- Late Antiquity
- Religion in the Ancient World
- Social History
- Digital Humanities
- Browse content in History
- Colonialism and Imperialism
- Diplomatic History
- Environmental History
- Genealogy, Heraldry, Names, and Honours
- Genocide and Ethnic Cleansing
- Historical Geography
- History by Period
- History of Emotions
- History of Agriculture
- History of Education
- History of Gender and Sexuality
- Industrial History
- Intellectual History
- International History
- Labour History
- Legal and Constitutional History
- Local and Family History
- Maritime History
- Military History
- National Liberation and Post-Colonialism
- Oral History
- Political History
- Public History
- Regional and National History
- Revolutions and Rebellions
- Slavery and Abolition of Slavery
- Social and Cultural History
- Theory, Methods, and Historiography
- Urban History
- World History
- Browse content in Language Teaching and Learning
- Language Learning (Specific Skills)
- Language Teaching Theory and Methods
- Browse content in Linguistics
- Applied Linguistics
- Cognitive Linguistics
- Computational Linguistics
- Forensic Linguistics
- Grammar, Syntax and Morphology
- Historical and Diachronic Linguistics
- History of English
- Language Acquisition
- Language Evolution
- Language Reference
- Language Variation
- Language Families
- Lexicography
- Linguistic Anthropology
- Linguistic Theories
- Linguistic Typology
- Phonetics and Phonology
- Psycholinguistics
- Sociolinguistics
- Translation and Interpretation
- Writing Systems
- Browse content in Literature
- Bibliography
- Children's Literature Studies
- Literary Studies (Asian)
- Literary Studies (European)
- Literary Studies (Eco-criticism)
- Literary Studies (Romanticism)
- Literary Studies (American)
- Literary Studies (Modernism)
- Literary Studies - World
- Literary Studies (1500 to 1800)
- Literary Studies (19th Century)
- Literary Studies (20th Century onwards)
- Literary Studies (African American Literature)
- Literary Studies (British and Irish)
- Literary Studies (Early and Medieval)
- Literary Studies (Fiction, Novelists, and Prose Writers)
- Literary Studies (Gender Studies)
- Literary Studies (Graphic Novels)
- Literary Studies (History of the Book)
- Literary Studies (Plays and Playwrights)
- Literary Studies (Poetry and Poets)
- Literary Studies (Postcolonial Literature)
- Literary Studies (Queer Studies)
- Literary Studies (Science Fiction)
- Literary Studies (Travel Literature)
- Literary Studies (War Literature)
- Literary Studies (Women's Writing)
- Literary Theory and Cultural Studies
- Mythology and Folklore
- Shakespeare Studies and Criticism
- Browse content in Media Studies
- Browse content in Music
- Applied Music
- Dance and Music
- Ethics in Music
- Ethnomusicology
- Gender and Sexuality in Music
- Medicine and Music
- Music Cultures
- Music and Religion
- Music and Media
- Music and Culture
- Music Education and Pedagogy
- Music Theory and Analysis
- Musical Scores, Lyrics, and Libretti
- Musical Structures, Styles, and Techniques
- Musicology and Music History
- Performance Practice and Studies
- Race and Ethnicity in Music
- Sound Studies
- Browse content in Performing Arts
- Browse content in Philosophy
- Aesthetics and Philosophy of Art
- Epistemology
- Feminist Philosophy
- History of Western Philosophy
- Metaphysics
- Moral Philosophy
- Non-Western Philosophy
- Philosophy of Science
- Philosophy of Language
- Philosophy of Mind
- Philosophy of Perception
- Philosophy of Action
- Philosophy of Law
- Philosophy of Religion
- Philosophy of Mathematics and Logic
- Practical Ethics
- Social and Political Philosophy
- Browse content in Religion
- Biblical Studies
- Christianity
- East Asian Religions
- History of Religion
- Judaism and Jewish Studies
- Qumran Studies
- Religion and Education
- Religion and Health
- Religion and Politics
- Religion and Science
- Religion and Law
- Religion and Art, Literature, and Music
- Religious Studies
- Browse content in Society and Culture
- Cookery, Food, and Drink
- Cultural Studies
- Customs and Traditions
- Ethical Issues and Debates
- Hobbies, Games, Arts and Crafts
- Natural world, Country Life, and Pets
- Popular Beliefs and Controversial Knowledge
- Sports and Outdoor Recreation
- Technology and Society
- Travel and Holiday
- Visual Culture
- Browse content in Law
- Arbitration
- Browse content in Company and Commercial Law
- Commercial Law
- Company Law
- Browse content in Comparative Law
- Systems of Law
- Competition Law
- Browse content in Constitutional and Administrative Law
- Government Powers
- Judicial Review
- Local Government Law
- Military and Defence Law
- Parliamentary and Legislative Practice
- Construction Law
- Contract Law
- Browse content in Criminal Law
- Criminal Procedure
- Criminal Evidence Law
- Sentencing and Punishment
- Employment and Labour Law
- Environment and Energy Law
- Browse content in Financial Law
- Banking Law
- Insolvency Law
- History of Law
- Human Rights and Immigration
- Intellectual Property Law
- Browse content in International Law
- Private International Law and Conflict of Laws
- Public International Law
- IT and Communications Law
- Jurisprudence and Philosophy of Law
- Law and Politics
- Law and Society
- Browse content in Legal System and Practice
- Courts and Procedure
- Legal Skills and Practice
- Legal System - Costs and Funding
- Primary Sources of Law
- Regulation of Legal Profession
- Medical and Healthcare Law
- Browse content in Policing
- Criminal Investigation and Detection
- Police and Security Services
- Police Procedure and Law
- Police Regional Planning
- Browse content in Property Law
- Personal Property Law
- Restitution
- Study and Revision
- Terrorism and National Security Law
- Browse content in Trusts Law
- Wills and Probate or Succession
- Browse content in Medicine and Health
- Browse content in Allied Health Professions
- Arts Therapies
- Clinical Science
- Dietetics and Nutrition
- Occupational Therapy
- Operating Department Practice
- Physiotherapy
- Radiography
- Speech and Language Therapy
- Browse content in Anaesthetics
- General Anaesthesia
- Browse content in Clinical Medicine
- Acute Medicine
- Cardiovascular Medicine
- Clinical Genetics
- Clinical Pharmacology and Therapeutics
- Dermatology
- Endocrinology and Diabetes
- Gastroenterology
- Genito-urinary Medicine
- Geriatric Medicine
- Infectious Diseases
- Medical Toxicology
- Medical Oncology
- Pain Medicine
- Palliative Medicine
- Rehabilitation Medicine
- Respiratory Medicine and Pulmonology
- Rheumatology
- Sleep Medicine
- Sports and Exercise Medicine
- Clinical Neuroscience
- Community Medical Services
- Critical Care
- Emergency Medicine
- Forensic Medicine
- Haematology
- History of Medicine
- Browse content in Medical Dentistry
- Oral and Maxillofacial Surgery
- Paediatric Dentistry
- Restorative Dentistry and Orthodontics
- Surgical Dentistry
- Browse content in Medical Skills
- Clinical Skills
- Communication Skills
- Nursing Skills
- Surgical Skills
- Medical Ethics
- Medical Statistics and Methodology
- Browse content in Neurology
- Clinical Neurophysiology
- Neuropathology
- Nursing Studies
- Browse content in Obstetrics and Gynaecology
- Gynaecology
- Occupational Medicine
- Ophthalmology
- Otolaryngology (ENT)
- Browse content in Paediatrics
- Neonatology
- Browse content in Pathology
- Chemical Pathology
- Clinical Cytogenetics and Molecular Genetics
- Histopathology
- Medical Microbiology and Virology
- Patient Education and Information
- Browse content in Pharmacology
- Psychopharmacology
- Browse content in Popular Health
- Caring for Others
- Complementary and Alternative Medicine
- Self-help and Personal Development
- Browse content in Preclinical Medicine
- Cell Biology
- Molecular Biology and Genetics
- Reproduction, Growth and Development
- Primary Care
- Professional Development in Medicine
- Browse content in Psychiatry
- Addiction Medicine
- Child and Adolescent Psychiatry
- Forensic Psychiatry
- Learning Disabilities
- Old Age Psychiatry
- Psychotherapy
- Browse content in Public Health and Epidemiology
- Epidemiology
- Public Health
- Browse content in Radiology
- Clinical Radiology
- Interventional Radiology
- Nuclear Medicine
- Radiation Oncology
- Reproductive Medicine
- Browse content in Surgery
- Cardiothoracic Surgery
- Gastro-intestinal and Colorectal Surgery
- General Surgery
- Neurosurgery
- Paediatric Surgery
- Peri-operative Care
- Plastic and Reconstructive Surgery
- Surgical Oncology
- Transplant Surgery
- Trauma and Orthopaedic Surgery
- Vascular Surgery
- Browse content in Science and Mathematics
- Browse content in Biological Sciences
- Aquatic Biology
- Biochemistry
- Bioinformatics and Computational Biology
- Developmental Biology
- Ecology and Conservation
- Evolutionary Biology
- Genetics and Genomics
- Microbiology
- Molecular and Cell Biology
- Natural History
- Plant Sciences and Forestry
- Research Methods in Life Sciences
- Structural Biology
- Systems Biology
- Zoology and Animal Sciences
- Browse content in Chemistry
- Analytical Chemistry
- Computational Chemistry
- Crystallography
- Environmental Chemistry
- Industrial Chemistry
- Inorganic Chemistry
- Materials Chemistry
- Medicinal Chemistry
- Mineralogy and Gems
- Organic Chemistry
- Physical Chemistry
- Polymer Chemistry
- Study and Communication Skills in Chemistry
- Theoretical Chemistry
- Browse content in Computer Science
- Artificial Intelligence
- Computer Architecture and Logic Design
- Game Studies
- Human-Computer Interaction
- Mathematical Theory of Computation
- Programming Languages
- Software Engineering
- Systems Analysis and Design
- Virtual Reality
- Browse content in Computing
- Business Applications
- Computer Security
- Computer Games
- Computer Networking and Communications
- Digital Lifestyle
- Graphical and Digital Media Applications
- Operating Systems
- Browse content in Earth Sciences and Geography
- Atmospheric Sciences
- Environmental Geography
- Geology and the Lithosphere
- Maps and Map-making
- Meteorology and Climatology
- Oceanography and Hydrology
- Palaeontology
- Physical Geography and Topography
- Regional Geography
- Soil Science
- Urban Geography
- Browse content in Engineering and Technology
- Agriculture and Farming
- Biological Engineering
- Civil Engineering, Surveying, and Building
- Electronics and Communications Engineering
- Energy Technology
- Engineering (General)
- Environmental Science, Engineering, and Technology
- History of Engineering and Technology
- Mechanical Engineering and Materials
- Technology of Industrial Chemistry
- Transport Technology and Trades
- Browse content in Environmental Science
- Applied Ecology (Environmental Science)
- Conservation of the Environment (Environmental Science)
- Environmental Sustainability
- Environmentalist Thought and Ideology (Environmental Science)
- Management of Land and Natural Resources (Environmental Science)
- Natural Disasters (Environmental Science)
- Nuclear Issues (Environmental Science)
- Pollution and Threats to the Environment (Environmental Science)
- Social Impact of Environmental Issues (Environmental Science)
- History of Science and Technology
- Browse content in Materials Science
- Ceramics and Glasses
- Composite Materials
- Metals, Alloying, and Corrosion
- Nanotechnology
- Browse content in Mathematics
- Applied Mathematics
- Biomathematics and Statistics
- History of Mathematics
- Mathematical Education
- Mathematical Finance
- Mathematical Analysis
- Numerical and Computational Mathematics
- Probability and Statistics
- Pure Mathematics
- Browse content in Neuroscience
- Cognition and Behavioural Neuroscience
- Development of the Nervous System
- Disorders of the Nervous System
- History of Neuroscience
- Invertebrate Neurobiology
- Molecular and Cellular Systems
- Neuroendocrinology and Autonomic Nervous System
- Neuroscientific Techniques
- Sensory and Motor Systems
- Browse content in Physics
- Astronomy and Astrophysics
- Atomic, Molecular, and Optical Physics
- Biological and Medical Physics
- Classical Mechanics
- Computational Physics
- Condensed Matter Physics
- Electromagnetism, Optics, and Acoustics
- History of Physics
- Mathematical and Statistical Physics
- Measurement Science
- Nuclear Physics
- Particles and Fields
- Plasma Physics
- Quantum Physics
- Relativity and Gravitation
- Semiconductor and Mesoscopic Physics
- Browse content in Psychology
- Affective Sciences
- Clinical Psychology
- Cognitive Psychology
- Cognitive Neuroscience
- Criminal and Forensic Psychology
- Developmental Psychology
- Educational Psychology
- Evolutionary Psychology
- Health Psychology
- History and Systems in Psychology
- Music Psychology
- Neuropsychology
- Organizational Psychology
- Psychological Assessment and Testing
- Psychology of Human-Technology Interaction
- Psychology Professional Development and Training
- Research Methods in Psychology
- Social Psychology
- Browse content in Social Sciences
- Browse content in Anthropology
- Anthropology of Religion
- Human Evolution
- Medical Anthropology
- Physical Anthropology
- Regional Anthropology
- Social and Cultural Anthropology
- Theory and Practice of Anthropology
- Browse content in Business and Management
- Business Strategy
- Business Ethics
- Business History
- Business and Government
- Business and Technology
- Business and the Environment
- Comparative Management
- Corporate Governance
- Corporate Social Responsibility
- Entrepreneurship
- Health Management
- Human Resource Management
- Industrial and Employment Relations
- Industry Studies
- Information and Communication Technologies
- International Business
- Knowledge Management
- Management and Management Techniques
- Operations Management
- Organizational Theory and Behaviour
- Pensions and Pension Management
- Public and Nonprofit Management
- Social Issues in Business and Management
- Strategic Management
- Supply Chain Management
- Browse content in Criminology and Criminal Justice
- Criminal Justice
- Criminology
- Forms of Crime
- International and Comparative Criminology
- Youth Violence and Juvenile Justice
- Development Studies
- Browse content in Economics
- Agricultural, Environmental, and Natural Resource Economics
- Asian Economics
- Behavioural Finance
- Behavioural Economics and Neuroeconomics
- Econometrics and Mathematical Economics
- Economic Systems
- Economic History
- Economic Methodology
- Economic Development and Growth
- Financial Markets
- Financial Institutions and Services
- General Economics and Teaching
- Health, Education, and Welfare
- History of Economic Thought
- International Economics
- Labour and Demographic Economics
- Law and Economics
- Macroeconomics and Monetary Economics
- Microeconomics
- Public Economics
- Urban, Rural, and Regional Economics
- Welfare Economics
- Browse content in Education
- Adult Education and Continuous Learning
- Care and Counselling of Students
- Early Childhood and Elementary Education
- Educational Equipment and Technology
- Educational Strategies and Policy
- Higher and Further Education
- Organization and Management of Education
- Philosophy and Theory of Education
- Schools Studies
- Secondary Education
- Teaching of a Specific Subject
- Teaching of Specific Groups and Special Educational Needs
- Teaching Skills and Techniques
- Browse content in Environment
- Applied Ecology (Social Science)
- Climate Change
- Conservation of the Environment (Social Science)
- Environmentalist Thought and Ideology (Social Science)
- Management of Land and Natural Resources (Social Science)
- Natural Disasters (Environment)
- Pollution and Threats to the Environment (Social Science)
- Social Impact of Environmental Issues (Social Science)
- Sustainability
- Browse content in Human Geography
- Cultural Geography
- Economic Geography
- Political Geography
- Browse content in Interdisciplinary Studies
- Communication Studies
- Museums, Libraries, and Information Sciences
- Browse content in Politics
- African Politics
- Asian Politics
- Chinese Politics
- Comparative Politics
- Conflict Politics
- Elections and Electoral Studies
- Environmental Politics
- Ethnic Politics
- European Union
- Foreign Policy
- Gender and Politics
- Human Rights and Politics
- Indian Politics
- International Relations
- International Organization (Politics)
- Irish Politics
- Latin American Politics
- Middle Eastern Politics
- Political Methodology
- Political Communication
- Political Philosophy
- Political Sociology
- Political Behaviour
- Political Economy
- Political Institutions
- Political Theory
- Politics and Law
- Politics of Development
- Public Administration
- Public Policy
- Qualitative Political Methodology
- Quantitative Political Methodology
- Regional Political Studies
- Russian Politics
- Security Studies
- State and Local Government
- UK Politics
- US Politics
- Browse content in Regional and Area Studies
- African Studies
- Asian Studies
- East Asian Studies
- Japanese Studies
- Latin American Studies
- Middle Eastern Studies
- Native American Studies
- Scottish Studies
- Browse content in Research and Information
- Research Methods
- Browse content in Social Work
- Addictions and Substance Misuse
- Adoption and Fostering
- Care of the Elderly
- Child and Adolescent Social Work
- Couple and Family Social Work
- Direct Practice and Clinical Social Work
- Emergency Services
- Human Behaviour and the Social Environment
- International and Global Issues in Social Work
- Mental and Behavioural Health
- Social Justice and Human Rights
- Social Policy and Advocacy
- Social Work and Crime and Justice
- Social Work Macro Practice
- Social Work Practice Settings
- Social Work Research and Evidence-based Practice
- Welfare and Benefit Systems
- Browse content in Sociology
- Childhood Studies
- Community Development
- Comparative and Historical Sociology
- Disability Studies
- Economic Sociology
- Gender and Sexuality
- Gerontology and Ageing
- Health, Illness, and Medicine
- Marriage and the Family
- Migration Studies
- Occupations, Professions, and Work
- Organizations
- Population and Demography
- Race and Ethnicity
- Social Theory
- Social Movements and Social Change
- Social Research and Statistics
- Social Stratification, Inequality, and Mobility
- Sociology of Religion
- Sociology of Education
- Sport and Leisure
- Urban and Rural Studies
- Browse content in Warfare and Defence
- Defence Strategy, Planning, and Research
- Land Forces and Warfare
- Military Administration
- Military Life and Institutions
- Naval Forces and Warfare
- Other Warfare and Defence Issues
- Peace Studies and Conflict Resolution
- Weapons and Equipment

- < Previous chapter
- Next chapter >

3 Descriptive Research Design
- Published: March 2018
- Cite Icon Cite
- Permissions Icon Permissions
This chapter presents two of the most prominent approaches to the design of descriptive research in music education. Simply creating depictions of music teaching and learning experiences that are organized and illustrative of the variation that can exist in any given setting is a worthwhile scientific endeavor in and of itself. Descriptive research is most typically an exploration of what is, what exists, and/or the status of any given topic of interest. The first section deals with basic steps in observational research designs, and the second section outlines critical features of survey designs. These fundamental research design options are excellent entry points for emerging scholars and when employed imaginatively can yield many benefits for the profession.
Personal account
- Sign in with email/username & password
- Get email alerts
- Save searches
- Purchase content
- Activate your purchase/trial code
- Add your ORCID iD
Institutional access
Sign in with a library card.
- Sign in with username/password
- Recommend to your librarian
- Institutional account management
- Get help with access
Access to content on Oxford Academic is often provided through institutional subscriptions and purchases. If you are a member of an institution with an active account, you may be able to access content in one of the following ways:
IP based access
Typically, access is provided across an institutional network to a range of IP addresses. This authentication occurs automatically, and it is not possible to sign out of an IP authenticated account.
Choose this option to get remote access when outside your institution. Shibboleth/Open Athens technology is used to provide single sign-on between your institution’s website and Oxford Academic.
- Click Sign in through your institution.
- Select your institution from the list provided, which will take you to your institution's website to sign in.
- When on the institution site, please use the credentials provided by your institution. Do not use an Oxford Academic personal account.
- Following successful sign in, you will be returned to Oxford Academic.
If your institution is not listed or you cannot sign in to your institution’s website, please contact your librarian or administrator.
Enter your library card number to sign in. If you cannot sign in, please contact your librarian.
Society Members
Society member access to a journal is achieved in one of the following ways:
Sign in through society site
Many societies offer single sign-on between the society website and Oxford Academic. If you see ‘Sign in through society site’ in the sign in pane within a journal:
- Click Sign in through society site.
- When on the society site, please use the credentials provided by that society. Do not use an Oxford Academic personal account.
If you do not have a society account or have forgotten your username or password, please contact your society.
Sign in using a personal account
Some societies use Oxford Academic personal accounts to provide access to their members. See below.
A personal account can be used to get email alerts, save searches, purchase content, and activate subscriptions.
Some societies use Oxford Academic personal accounts to provide access to their members.
Viewing your signed in accounts
Click the account icon in the top right to:
- View your signed in personal account and access account management features.
- View the institutional accounts that are providing access.
Signed in but can't access content
Oxford Academic is home to a wide variety of products. The institutional subscription may not cover the content that you are trying to access. If you believe you should have access to that content, please contact your librarian.
For librarians and administrators, your personal account also provides access to institutional account management. Here you will find options to view and activate subscriptions, manage institutional settings and access options, access usage statistics, and more.
Our books are available by subscription or purchase to libraries and institutions.
| Month: | Total Views: |
|---|---|
| October 2022 | 19 |
| November 2022 | 16 |
| December 2022 | 1 |
| January 2023 | 23 |
| February 2023 | 14 |
| March 2023 | 3 |
| April 2023 | 4 |
| May 2023 | 4 |
| June 2023 | 1 |
| July 2023 | 3 |
| August 2023 | 15 |
| September 2023 | 13 |
| October 2023 | 3 |
| November 2023 | 8 |
| December 2023 | 8 |
| January 2024 | 6 |
| February 2024 | 1 |
| March 2024 | 10 |
| April 2024 | 9 |
| May 2024 | 7 |
| June 2024 | 2 |
| July 2024 | 13 |
| August 2024 | 5 |
- About Oxford Academic
- Publish journals with us
- University press partners
- What we publish
- New features
- Open access
- Rights and permissions
- Accessibility
- Advertising
- Media enquiries
- Oxford University Press
- Oxford Languages
- University of Oxford
Oxford University Press is a department of the University of Oxford. It furthers the University's objective of excellence in research, scholarship, and education by publishing worldwide
- Copyright © 2024 Oxford University Press
- Cookie settings
- Cookie policy
- Privacy policy
- Legal notice
This Feature Is Available To Subscribers Only
Sign In or Create an Account
This PDF is available to Subscribers Only
For full access to this pdf, sign in to an existing account, or purchase an annual subscription.
- Research Process
- Manuscript Preparation
- Manuscript Review
- Publication Process
- Publication Recognition
- Language Editing Services
- Translation Services

Descriptive Research Design and Its Myriad Uses
- 3 minute read
- 13.9K views
Table of Contents
The design of a research study can be of two broad types—observational or interventional. In interventional studies, at least one variable can be controlled by the researcher. For example, drug trials that examine the efficacy of novel medicines are interventional studies. Observational studies, on the other hand, simply examine and describe uncontrollable variables¹ .
What is descriptive research design?¹
Descriptive design is one of the simplest forms of observational study design. It can either quantify the distribution of certain variables (quantitative descriptive research) or simply report the qualities of these variables without quantifying them (qualitative descriptive research).
When can descriptive research design be used?¹
It is useful when you wish to examine the occurrence of a phenomenon, delineate trends or patterns within the phenomenon, or describe the relationship between variables. As such, descriptive design is great for¹ :
- A survey conducted to measure the changes in the levels of customer satisfaction among shoppers in the US is the perfect example of quantitative descriptive research.
- Conversely, a case report detailing the experiences and perspectives of individuals living with a particular rare disease is a good example of qualitative descriptive research.
- Cross-sectional studies : Descriptive research is ideal for cross-sectional studies that capture a snapshot of a population at a specific point in time. This approach can be used to observe the variations in risk factors and diseases in a population. Take the following examples:
- In quantitative descriptive research: A study that measures the prevalence of heart disease among college students in the current academic year.
- In qualitative descriptive research: A cross-sectional study exploring the cultural perceptions of mental health across different communities.
- Ecological studies : Descriptive research design is also well-suited for studies that seek to understand relationships between variables and outcomes in specific populations. For example:
- A study that measures the relationship between the number of police personnel and homicides in India can use quantitative descriptive research design
- A study describing the impact of deforestation on indigenous communities’ cultural practices and beliefs can use qualitative descriptive research design.
- Focus group discussion reports : Descriptive research can help in capturing diverse perspectives and understanding the nuances of participants’ experiences.
- First, an example of quantitative descriptive research: A study that uses two focus groups to explore the perceptions of mental health among immigrants in London.
- Next, an example of qualitative descriptive research: A focus group report analyzing the themes and emotions associated with different advertising campaigns.
Benefits of descriptive research design¹
- Easy to conduct: Due to its simplicity, descriptive research design can be employed by researchers of all experience levels.
- Economical: Descriptive research design is not resource intensive. It is a budget-friendly approach to studying many phenomena without costly equipment.
- Provides comprehensive and useful information: Descriptive research is a more thorough approach that can capture many different aspects of a phenomena, facilitating a wholistic understanding.
- Aids planning of major projects or future research: As a tool for preliminary exploration, descriptive research guides can guide strategic decision-making and guide major projects.
The Bottom Line
Descriptive research plays a crucial role in improving our lives. Surveys help create better policies and cross-sectional studies help us understand problems affecting different populations including diseases. Used in the right context, descriptive research can advance knowledge and inform decision making¹ .
We, at Elsevier Language Services, understand the value of your descriptive research, as well as the importance of communicating it correctly. If you have a manuscript based on a descriptive study, our experienced editors can help improve its myriad aspects. By improving the logical flow, tone, and accuracy of your writing, we ensure that your descriptive research gets published in a top tier journal and makes maximum impact in academia and beyond. Contact us for a comprehensive list of services!
Type in wordcount for Plus Total: USD EUR JPY Follow this link if your manuscript is longer than 9,000 words. Upload
References
- Aggarwal, R., & Ranganathan, P. (2019). Study designs: Part 2 – Descriptive studies. Perspectives in Clinical Research , 10 (1), 34. https://doi.org/10.4103/picr.picr_154_18 .

Is The Use of AI in Manuscript Editing Feasible? Here’s Three Tips to Steer Clear of Potential Issues

Navigating “Chinglish” Errors in Academic English Writing
You may also like.

Five Common Mistakes to Avoid When Writing a Biomedical Research Paper

Making Technical Writing in Environmental Engineering Accessible

To Err is Not Human: The Dangers of AI-assisted Academic Writing

When Data Speak, Listen: Importance of Data Collection and Analysis Methods

Choosing the Right Research Methodology: A Guide for Researchers

Why is data validation important in research?

Writing a good review article

Scholarly Sources: What are They and Where can You Find Them?
Input your search keywords and press Enter.

Descriptive Research
Descriptive research can be explained as a statement of affairs as they are at present with the researcher having no control over variable. Moreover, “descriptive studies may be characterised as simply the attempt to determine, describe or identify what is, while analytical research attempts to establish why it is that way or how it came to be” [1] . Three main purposes of descriptive studies can be explained as describing, explaining and validating research findings. This type of research is popular with non-quantified topic.
Descriptive research is “aimed at casting light on current issues or problems through a process of data collection that enables them to describe the situation more completely than was possible without employing this method.” [2] To put it simply, descriptive studies are used to describe various aspects of the phenomenon. In its popular format, descriptive research is used to describe characteristics and/or behaviour of sample population. It is an effective method to get information that can be used to develop hypotheses and propose associations.
Importantly, these types of studies do not focus on reasons for the occurrence of the phenomenon. In other words, descriptive research focuses on the question “What?”, but it is not concerned with the question “Why?”
Descriptive studies have the following characteristics:
1. While descriptive research can employ a number of variables, only one variable is required to conduct a descriptive study.
2. Descriptive studies are closely associated with observational studies, but they are not limited with observation data collection method. Case studies and surveys can also be specified as popular data collection methods used with descriptive studies.
3. Findings of descriptive researches create a scope for further research. When a descriptive study answers to the question “What?”, a further research can be conducted to find an answer to “Why?” question.
Examples of Descriptive Research
Research questions in descriptive studies typically start with ‘What is…”. Examples of research questions in descriptive studies may include the following:
- What are the most effective intangible employee motivation tools in hospitality industry in the 21 st century?
- What is the impact of viral marketing on consumer behaviour in consumer amongst university students in Canada?
- Do corporate leaders of multinational companies in the 21 st century possess moral rights to receive multi-million bonuses?
- What are the main distinctive traits of organisational culture of McDonald’s USA?
- What is the impact of the global financial crisis of 2007 – 2009 on fitness industry in the UK?
Advantages of Descriptive Research
- Effective to analyse non-quantified topics and issues
- The possibility to observe the phenomenon in a completely natural and unchanged natural environment
- The opportunity to integrate the qualitative and quantitative methods of data collection. Accordingly, research findings can be comprehensive.
- Less time-consuming than quantitative experiments
- Practical use of research findings for decision-making
Disadvantages of Descriptive Research
- Descriptive studies cannot test or verify the research problem statistically
- Research results may reflect certain level of bias due to the absence of statistical tests
- The majority of descriptive studies are not ‘repeatable’ due to their observational nature
- Descriptive studies are not helpful in identifying cause behind described phenomenon
My e-book, The Ultimate Guide to Writing a Dissertation in Business Studies: a step by step assistance contains discussions of theory and application of research designs. The e-book also explains all stages of the research process starting from the selection of the research area to writing personal reflection. Important elements of dissertations such as research philosophy , research approach , methods of data collection , data analysis and sampling are explained in this e-book in simple words.
John Dudovskiy

[1] Ethridge, D.E. (2004) “Research Methodology in Applied Economics” John Wiley & Sons, p.24
[2] Fox, W. & Bayat, M.S. (2007) “A Guide to Managing Research” Juta Publications, p.45
IMAGES
COMMENTS
Descriptive research aims to accurately and systematically describe a population, situation or phenomenon. It can answer what, where, when and how questions, but not why questions. A descriptive research design can use a wide variety of research methods to investigate one or more variables. Unlike in experimental research, the researcher does ...
Descriptive research design is a type of research methodology that aims to describe or document the characteristics, behaviors, attitudes, opinions, or perceptions of a group or population being studied.
Descriptive research design is employed across diverse fields, and its primary objective is to systematically observe and document all variables and conditions influencing the phenomenon. Read this comprehensive article to know what descriptive research is and the different methods, types and examples.
A descriptive study design is a research method that observes and describes the behaviour of subjects from a scientific viewpoint with regard to variables of a situation (Sharma, 2019). Here, the ...
A descriptive research design can use a wide variety of research methods to investigate one or more variables. Unlike in experimental research, the researcher does not control or manipulate any of the variables, but only observes and measures them.
Qualitative descriptive designs are common in nursing and healthcare research due to their inherent simplicity, flexibility and utility in diverse healthcare contexts. However, the application of descriptive research is sometimes critiqued in terms of scientific rigor. Inconsistency in decision making within the research process coupled with a ...
The inclusion criterion for this review was data-based, nursing-related, research articles in which authors used the terms QD, qualitative descriptive study, or qualitative descriptive design in their titles or abstracts as well as in the main texts of the publication.
A descriptive design is a flexible, exploratory approach to qualitative research. Descriptive design is referred to in the literature by other labels including generic, general, basic, traditional, interpretive, and pragmatic. Descriptive design as an acceptable research design for dissertation and other robust scholarly research has received ...
Descriptive research design is a powerful tool used by researchers to gather information about a particular group or phenomenon.
New York, NY, Lippincott, 1991. Dempsey PA, Dempsey AD: Nursing Research with Basic Statistical Applications (ed 3). Boston, MA, Jones and Bartlett, 1992. Beck S.: Designing a study, in Mateo MA, Kirchhoff KT (eds): Conducting and Using Nursing Research in the Clinical Setting.
A research design is a strategy for answering your research question using empirical data. Creating a research design means making decisions about: Your overall research objectives and approach. Whether you'll rely on primary research or secondary research. Your sampling methods or criteria for selecting subjects. Your data collection methods.
A descriptive research design was used to observe and describe the characteristics of the sample without manipulating any of the variables (Siedlecki, 2020), which allowed for data collection ...
Abstract This chapter presents research designs for descriptive and correlational quantitative research. Descriptive research designs are used to address the question "What is x?" Correlational research designs are used to address the question "How are things related?" In contrast to some experimental research designs, in these design types the primary area of interest under ...
Comparing the Five Approaches All five approaches have in common the general process of research that begins with a research problem and proceeds to the questions, the data, the data analysis and interpretations, and the research report. Qualitative researchers have found it helpful to see at this point an overall sketch for each of the five approaches. From these sketches of the five ...
Descriptive research is most typically an exploration of what is, what exists, and/or the status of any given topic of interest. The first section deals with basic steps in observational research designs, and the second section outlines critical features of survey designs.
As such, descriptive design is great for¹: Case reports and surveys: Descriptive research is a valuable tool for in-depth examination of uncommon diseases and other unique occurrences. In the context of surveys, it can help researchers meticulously analyse extensive datasets. A survey conducted to measure the changes in the levels of customer ...
Descriptive research is "aimed at casting light on current issues or problems through a process of data collection that enables them to describe the situation more completely than was possible without employing this method." [2] To put it simply, descriptive studies are used to describe various aspects of the phenomenon. In its popular format, descriptive research is used to describe ...
Descriptive science is a category of science that involves descriptive research; that is, observing, recording, describing, and classifying phenomena. Descriptive research is sometimes contrasted with hypothesis-driven research, which is focused on testing a particular hypothesis by means of experimentation.
Abstract Qualitative description (QD) offers an accessible entry point for master's-level students and research trainees embarking on a qualitative research learning journey, emphasizing direct, rich descriptions of experiences and events without extensive theorization or abstraction. This method, rooted in naturalistic inquiry, allows for flexibility in theoretical approaches, sampling ...
Background Qualitative descriptive designs are common in nursing and healthcare research due to their inherent simplicity, flexibility and utility in diverse healthcare contexts. However, the application of descriptive research is sometimes critiqued in terms of scientific rigor. Inconsistency in decision making within the research process coupled with a lack of transparency has created issues ...
Descriptive method is a research method that tries to describe phenomenon, occurrence, event, that happens in the present. Creswell (1994) said the descriptive method of research is to gather information about present existing condition. Creswell (2012, p. 274) explained the purpose of descriptive method is to find a detailed explanation and description about the object of the research ...
The design of a study defines the study type (descriptive, correlational, semi-experimental, experimental, review, meta-analytic) and sub-type (e.g., descriptive-longitudinal case study), research ...
The essence of research design is to translate a research problem into data for analysis so as to provide relevant answers to research questions at a minimum cost.