- Privacy Policy
Home » Research Methodology – Types, Examples and writing Guide

Research Methodology – Types, Examples and writing Guide
Table of Contents

Research Methodology
Definition:
Research Methodology refers to the systematic and scientific approach used to conduct research, investigate problems, and gather data and information for a specific purpose. It involves the techniques and procedures used to identify, collect , analyze , and interpret data to answer research questions or solve research problems . Moreover, They are philosophical and theoretical frameworks that guide the research process.
Structure of Research Methodology
Research methodology formats can vary depending on the specific requirements of the research project, but the following is a basic example of a structure for a research methodology section:
I. Introduction
- Provide an overview of the research problem and the need for a research methodology section
- Outline the main research questions and objectives
II. Research Design
- Explain the research design chosen and why it is appropriate for the research question(s) and objectives
- Discuss any alternative research designs considered and why they were not chosen
- Describe the research setting and participants (if applicable)
III. Data Collection Methods
- Describe the methods used to collect data (e.g., surveys, interviews, observations)
- Explain how the data collection methods were chosen and why they are appropriate for the research question(s) and objectives
- Detail any procedures or instruments used for data collection
IV. Data Analysis Methods
- Describe the methods used to analyze the data (e.g., statistical analysis, content analysis )
- Explain how the data analysis methods were chosen and why they are appropriate for the research question(s) and objectives
- Detail any procedures or software used for data analysis
V. Ethical Considerations
- Discuss any ethical issues that may arise from the research and how they were addressed
- Explain how informed consent was obtained (if applicable)
- Detail any measures taken to ensure confidentiality and anonymity
VI. Limitations
- Identify any potential limitations of the research methodology and how they may impact the results and conclusions
VII. Conclusion
- Summarize the key aspects of the research methodology section
- Explain how the research methodology addresses the research question(s) and objectives
Research Methodology Types
Types of Research Methodology are as follows:
Quantitative Research Methodology
This is a research methodology that involves the collection and analysis of numerical data using statistical methods. This type of research is often used to study cause-and-effect relationships and to make predictions.
Qualitative Research Methodology
This is a research methodology that involves the collection and analysis of non-numerical data such as words, images, and observations. This type of research is often used to explore complex phenomena, to gain an in-depth understanding of a particular topic, and to generate hypotheses.
Mixed-Methods Research Methodology
This is a research methodology that combines elements of both quantitative and qualitative research. This approach can be particularly useful for studies that aim to explore complex phenomena and to provide a more comprehensive understanding of a particular topic.
Case Study Research Methodology
This is a research methodology that involves in-depth examination of a single case or a small number of cases. Case studies are often used in psychology, sociology, and anthropology to gain a detailed understanding of a particular individual or group.
Action Research Methodology
This is a research methodology that involves a collaborative process between researchers and practitioners to identify and solve real-world problems. Action research is often used in education, healthcare, and social work.
Experimental Research Methodology
This is a research methodology that involves the manipulation of one or more independent variables to observe their effects on a dependent variable. Experimental research is often used to study cause-and-effect relationships and to make predictions.
Survey Research Methodology
This is a research methodology that involves the collection of data from a sample of individuals using questionnaires or interviews. Survey research is often used to study attitudes, opinions, and behaviors.
Grounded Theory Research Methodology
This is a research methodology that involves the development of theories based on the data collected during the research process. Grounded theory is often used in sociology and anthropology to generate theories about social phenomena.
Research Methodology Example
An Example of Research Methodology could be the following:
Research Methodology for Investigating the Effectiveness of Cognitive Behavioral Therapy in Reducing Symptoms of Depression in Adults
Introduction:
The aim of this research is to investigate the effectiveness of cognitive-behavioral therapy (CBT) in reducing symptoms of depression in adults. To achieve this objective, a randomized controlled trial (RCT) will be conducted using a mixed-methods approach.
Research Design:
The study will follow a pre-test and post-test design with two groups: an experimental group receiving CBT and a control group receiving no intervention. The study will also include a qualitative component, in which semi-structured interviews will be conducted with a subset of participants to explore their experiences of receiving CBT.
Participants:
Participants will be recruited from community mental health clinics in the local area. The sample will consist of 100 adults aged 18-65 years old who meet the diagnostic criteria for major depressive disorder. Participants will be randomly assigned to either the experimental group or the control group.
Intervention :
The experimental group will receive 12 weekly sessions of CBT, each lasting 60 minutes. The intervention will be delivered by licensed mental health professionals who have been trained in CBT. The control group will receive no intervention during the study period.
Data Collection:
Quantitative data will be collected through the use of standardized measures such as the Beck Depression Inventory-II (BDI-II) and the Generalized Anxiety Disorder-7 (GAD-7). Data will be collected at baseline, immediately after the intervention, and at a 3-month follow-up. Qualitative data will be collected through semi-structured interviews with a subset of participants from the experimental group. The interviews will be conducted at the end of the intervention period, and will explore participants’ experiences of receiving CBT.
Data Analysis:
Quantitative data will be analyzed using descriptive statistics, t-tests, and mixed-model analyses of variance (ANOVA) to assess the effectiveness of the intervention. Qualitative data will be analyzed using thematic analysis to identify common themes and patterns in participants’ experiences of receiving CBT.
Ethical Considerations:
This study will comply with ethical guidelines for research involving human subjects. Participants will provide informed consent before participating in the study, and their privacy and confidentiality will be protected throughout the study. Any adverse events or reactions will be reported and managed appropriately.
Data Management:
All data collected will be kept confidential and stored securely using password-protected databases. Identifying information will be removed from qualitative data transcripts to ensure participants’ anonymity.
Limitations:
One potential limitation of this study is that it only focuses on one type of psychotherapy, CBT, and may not generalize to other types of therapy or interventions. Another limitation is that the study will only include participants from community mental health clinics, which may not be representative of the general population.
Conclusion:
This research aims to investigate the effectiveness of CBT in reducing symptoms of depression in adults. By using a randomized controlled trial and a mixed-methods approach, the study will provide valuable insights into the mechanisms underlying the relationship between CBT and depression. The results of this study will have important implications for the development of effective treatments for depression in clinical settings.
How to Write Research Methodology
Writing a research methodology involves explaining the methods and techniques you used to conduct research, collect data, and analyze results. It’s an essential section of any research paper or thesis, as it helps readers understand the validity and reliability of your findings. Here are the steps to write a research methodology:
- Start by explaining your research question: Begin the methodology section by restating your research question and explaining why it’s important. This helps readers understand the purpose of your research and the rationale behind your methods.
- Describe your research design: Explain the overall approach you used to conduct research. This could be a qualitative or quantitative research design, experimental or non-experimental, case study or survey, etc. Discuss the advantages and limitations of the chosen design.
- Discuss your sample: Describe the participants or subjects you included in your study. Include details such as their demographics, sampling method, sample size, and any exclusion criteria used.
- Describe your data collection methods : Explain how you collected data from your participants. This could include surveys, interviews, observations, questionnaires, or experiments. Include details on how you obtained informed consent, how you administered the tools, and how you minimized the risk of bias.
- Explain your data analysis techniques: Describe the methods you used to analyze the data you collected. This could include statistical analysis, content analysis, thematic analysis, or discourse analysis. Explain how you dealt with missing data, outliers, and any other issues that arose during the analysis.
- Discuss the validity and reliability of your research : Explain how you ensured the validity and reliability of your study. This could include measures such as triangulation, member checking, peer review, or inter-coder reliability.
- Acknowledge any limitations of your research: Discuss any limitations of your study, including any potential threats to validity or generalizability. This helps readers understand the scope of your findings and how they might apply to other contexts.
- Provide a summary: End the methodology section by summarizing the methods and techniques you used to conduct your research. This provides a clear overview of your research methodology and helps readers understand the process you followed to arrive at your findings.
When to Write Research Methodology
Research methodology is typically written after the research proposal has been approved and before the actual research is conducted. It should be written prior to data collection and analysis, as it provides a clear roadmap for the research project.
The research methodology is an important section of any research paper or thesis, as it describes the methods and procedures that will be used to conduct the research. It should include details about the research design, data collection methods, data analysis techniques, and any ethical considerations.
The methodology should be written in a clear and concise manner, and it should be based on established research practices and standards. It is important to provide enough detail so that the reader can understand how the research was conducted and evaluate the validity of the results.
Applications of Research Methodology
Here are some of the applications of research methodology:
- To identify the research problem: Research methodology is used to identify the research problem, which is the first step in conducting any research.
- To design the research: Research methodology helps in designing the research by selecting the appropriate research method, research design, and sampling technique.
- To collect data: Research methodology provides a systematic approach to collect data from primary and secondary sources.
- To analyze data: Research methodology helps in analyzing the collected data using various statistical and non-statistical techniques.
- To test hypotheses: Research methodology provides a framework for testing hypotheses and drawing conclusions based on the analysis of data.
- To generalize findings: Research methodology helps in generalizing the findings of the research to the target population.
- To develop theories : Research methodology is used to develop new theories and modify existing theories based on the findings of the research.
- To evaluate programs and policies : Research methodology is used to evaluate the effectiveness of programs and policies by collecting data and analyzing it.
- To improve decision-making: Research methodology helps in making informed decisions by providing reliable and valid data.
Purpose of Research Methodology
Research methodology serves several important purposes, including:
- To guide the research process: Research methodology provides a systematic framework for conducting research. It helps researchers to plan their research, define their research questions, and select appropriate methods and techniques for collecting and analyzing data.
- To ensure research quality: Research methodology helps researchers to ensure that their research is rigorous, reliable, and valid. It provides guidelines for minimizing bias and error in data collection and analysis, and for ensuring that research findings are accurate and trustworthy.
- To replicate research: Research methodology provides a clear and detailed account of the research process, making it possible for other researchers to replicate the study and verify its findings.
- To advance knowledge: Research methodology enables researchers to generate new knowledge and to contribute to the body of knowledge in their field. It provides a means for testing hypotheses, exploring new ideas, and discovering new insights.
- To inform decision-making: Research methodology provides evidence-based information that can inform policy and decision-making in a variety of fields, including medicine, public health, education, and business.
Advantages of Research Methodology
Research methodology has several advantages that make it a valuable tool for conducting research in various fields. Here are some of the key advantages of research methodology:
- Systematic and structured approach : Research methodology provides a systematic and structured approach to conducting research, which ensures that the research is conducted in a rigorous and comprehensive manner.
- Objectivity : Research methodology aims to ensure objectivity in the research process, which means that the research findings are based on evidence and not influenced by personal bias or subjective opinions.
- Replicability : Research methodology ensures that research can be replicated by other researchers, which is essential for validating research findings and ensuring their accuracy.
- Reliability : Research methodology aims to ensure that the research findings are reliable, which means that they are consistent and can be depended upon.
- Validity : Research methodology ensures that the research findings are valid, which means that they accurately reflect the research question or hypothesis being tested.
- Efficiency : Research methodology provides a structured and efficient way of conducting research, which helps to save time and resources.
- Flexibility : Research methodology allows researchers to choose the most appropriate research methods and techniques based on the research question, data availability, and other relevant factors.
- Scope for innovation: Research methodology provides scope for innovation and creativity in designing research studies and developing new research techniques.
Research Methodology Vs Research Methods
| Research Methodology | Research Methods |
|---|---|
| Research methodology refers to the philosophical and theoretical frameworks that guide the research process. | refer to the techniques and procedures used to collect and analyze data. |
| It is concerned with the underlying principles and assumptions of research. | It is concerned with the practical aspects of research. |
| It provides a rationale for why certain research methods are used. | It determines the specific steps that will be taken to conduct research. |
| It is broader in scope and involves understanding the overall approach to research. | It is narrower in scope and focuses on specific techniques and tools used in research. |
| It is concerned with identifying research questions, defining the research problem, and formulating hypotheses. | It is concerned with collecting data, analyzing data, and interpreting results. |
| It is concerned with the validity and reliability of research. | It is concerned with the accuracy and precision of data. |
| It is concerned with the ethical considerations of research. | It is concerned with the practical considerations of research. |
About the author

Muhammad Hassan
Researcher, Academic Writer, Web developer
You may also like

Figures in Research Paper – Examples and Guide

Research Gap – Types, Examples and How to...

Research Approach – Types Methods and Examples

APA Research Paper Format – Example, Sample and...

Limitations in Research – Types, Examples and...

Informed Consent in Research – Types, Templates...
- USC Libraries
- Research Guides
Organizing Your Social Sciences Research Paper
- 6. The Methodology
- Purpose of Guide
- Design Flaws to Avoid
- Independent and Dependent Variables
- Glossary of Research Terms
- Reading Research Effectively
- Narrowing a Topic Idea
- Broadening a Topic Idea
- Extending the Timeliness of a Topic Idea
- Academic Writing Style
- Applying Critical Thinking
- Choosing a Title
- Making an Outline
- Paragraph Development
- Research Process Video Series
- Executive Summary
- The C.A.R.S. Model
- Background Information
- The Research Problem/Question
- Theoretical Framework
- Citation Tracking
- Content Alert Services
- Evaluating Sources
- Primary Sources
- Secondary Sources
- Tiertiary Sources
- Scholarly vs. Popular Publications
- Qualitative Methods
- Quantitative Methods
- Insiderness
- Using Non-Textual Elements
- Limitations of the Study
- Common Grammar Mistakes
- Writing Concisely
- Avoiding Plagiarism
- Footnotes or Endnotes?
- Further Readings
- Generative AI and Writing
- USC Libraries Tutorials and Other Guides
- Bibliography
The methods section describes actions taken to investigate a research problem and the rationale for the application of specific procedures or techniques used to identify, select, process, and analyze information applied to understanding the problem, thereby, allowing the reader to critically evaluate a study’s overall validity and reliability. The methodology section of a research paper answers two main questions: How was the data collected or generated? And, how was it analyzed? The writing should be direct and precise and always written in the past tense.
Kallet, Richard H. "How to Write the Methods Section of a Research Paper." Respiratory Care 49 (October 2004): 1229-1232.
Importance of a Good Methodology Section
You must explain how you obtained and analyzed your results for the following reasons:
- Readers need to know how the data was obtained because the method you chose affects the results and, by extension, how you interpreted their significance in the discussion section of your paper.
- Methodology is crucial for any branch of scholarship because an unreliable method produces unreliable results and, as a consequence, undermines the value of your analysis of the findings.
- In most cases, there are a variety of different methods you can choose to investigate a research problem. The methodology section of your paper should clearly articulate the reasons why you have chosen a particular procedure or technique.
- The reader wants to know that the data was collected or generated in a way that is consistent with accepted practice in the field of study. For example, if you are using a multiple choice questionnaire, readers need to know that it offered your respondents a reasonable range of answers to choose from.
- The method must be appropriate to fulfilling the overall aims of the study. For example, you need to ensure that you have a large enough sample size to be able to generalize and make recommendations based upon the findings.
- The methodology should discuss the problems that were anticipated and the steps you took to prevent them from occurring. For any problems that do arise, you must describe the ways in which they were minimized or why these problems do not impact in any meaningful way your interpretation of the findings.
- In the social and behavioral sciences, it is important to always provide sufficient information to allow other researchers to adopt or replicate your methodology. This information is particularly important when a new method has been developed or an innovative use of an existing method is utilized.
Bem, Daryl J. Writing the Empirical Journal Article. Psychology Writing Center. University of Washington; Denscombe, Martyn. The Good Research Guide: For Small-Scale Social Research Projects . 5th edition. Buckingham, UK: Open University Press, 2014; Lunenburg, Frederick C. Writing a Successful Thesis or Dissertation: Tips and Strategies for Students in the Social and Behavioral Sciences . Thousand Oaks, CA: Corwin Press, 2008.
Structure and Writing Style
I. Groups of Research Methods
There are two main groups of research methods in the social sciences:
- The e mpirical-analytical group approaches the study of social sciences in a similar manner that researchers study the natural sciences . This type of research focuses on objective knowledge, research questions that can be answered yes or no, and operational definitions of variables to be measured. The empirical-analytical group employs deductive reasoning that uses existing theory as a foundation for formulating hypotheses that need to be tested. This approach is focused on explanation.
- The i nterpretative group of methods is focused on understanding phenomenon in a comprehensive, holistic way . Interpretive methods focus on analytically disclosing the meaning-making practices of human subjects [the why, how, or by what means people do what they do], while showing how those practices arrange so that it can be used to generate observable outcomes. Interpretive methods allow you to recognize your connection to the phenomena under investigation. However, the interpretative group requires careful examination of variables because it focuses more on subjective knowledge.
II. Content
The introduction to your methodology section should begin by restating the research problem and underlying assumptions underpinning your study. This is followed by situating the methods you used to gather, analyze, and process information within the overall “tradition” of your field of study and within the particular research design you have chosen to study the problem. If the method you choose lies outside of the tradition of your field [i.e., your review of the literature demonstrates that the method is not commonly used], provide a justification for how your choice of methods specifically addresses the research problem in ways that have not been utilized in prior studies.
The remainder of your methodology section should describe the following:
- Decisions made in selecting the data you have analyzed or, in the case of qualitative research, the subjects and research setting you have examined,
- Tools and methods used to identify and collect information, and how you identified relevant variables,
- The ways in which you processed the data and the procedures you used to analyze that data, and
- The specific research tools or strategies that you utilized to study the underlying hypothesis and research questions.
In addition, an effectively written methodology section should:
- Introduce the overall methodological approach for investigating your research problem . Is your study qualitative or quantitative or a combination of both (mixed method)? Are you going to take a special approach, such as action research, or a more neutral stance?
- Indicate how the approach fits the overall research design . Your methods for gathering data should have a clear connection to your research problem. In other words, make sure that your methods will actually address the problem. One of the most common deficiencies found in research papers is that the proposed methodology is not suitable to achieving the stated objective of your paper.
- Describe the specific methods of data collection you are going to use , such as, surveys, interviews, questionnaires, observation, archival research. If you are analyzing existing data, such as a data set or archival documents, describe how it was originally created or gathered and by whom. Also be sure to explain how older data is still relevant to investigating the current research problem.
- Explain how you intend to analyze your results . Will you use statistical analysis? Will you use specific theoretical perspectives to help you analyze a text or explain observed behaviors? Describe how you plan to obtain an accurate assessment of relationships, patterns, trends, distributions, and possible contradictions found in the data.
- Provide background and a rationale for methodologies that are unfamiliar for your readers . Very often in the social sciences, research problems and the methods for investigating them require more explanation/rationale than widely accepted rules governing the natural and physical sciences. Be clear and concise in your explanation.
- Provide a justification for subject selection and sampling procedure . For instance, if you propose to conduct interviews, how do you intend to select the sample population? If you are analyzing texts, which texts have you chosen, and why? If you are using statistics, why is this set of data being used? If other data sources exist, explain why the data you chose is most appropriate to addressing the research problem.
- Provide a justification for case study selection . A common method of analyzing research problems in the social sciences is to analyze specific cases. These can be a person, place, event, phenomenon, or other type of subject of analysis that are either examined as a singular topic of in-depth investigation or multiple topics of investigation studied for the purpose of comparing or contrasting findings. In either method, you should explain why a case or cases were chosen and how they specifically relate to the research problem.
- Describe potential limitations . Are there any practical limitations that could affect your data collection? How will you attempt to control for potential confounding variables and errors? If your methodology may lead to problems you can anticipate, state this openly and show why pursuing this methodology outweighs the risk of these problems cropping up.
NOTE: Once you have written all of the elements of the methods section, subsequent revisions should focus on how to present those elements as clearly and as logically as possibly. The description of how you prepared to study the research problem, how you gathered the data, and the protocol for analyzing the data should be organized chronologically. For clarity, when a large amount of detail must be presented, information should be presented in sub-sections according to topic. If necessary, consider using appendices for raw data.
ANOTHER NOTE: If you are conducting a qualitative analysis of a research problem , the methodology section generally requires a more elaborate description of the methods used as well as an explanation of the processes applied to gathering and analyzing of data than is generally required for studies using quantitative methods. Because you are the primary instrument for generating the data [e.g., through interviews or observations], the process for collecting that data has a significantly greater impact on producing the findings. Therefore, qualitative research requires a more detailed description of the methods used.
YET ANOTHER NOTE: If your study involves interviews, observations, or other qualitative techniques involving human subjects , you may be required to obtain approval from the university's Office for the Protection of Research Subjects before beginning your research. This is not a common procedure for most undergraduate level student research assignments. However, i f your professor states you need approval, you must include a statement in your methods section that you received official endorsement and adequate informed consent from the office and that there was a clear assessment and minimization of risks to participants and to the university. This statement informs the reader that your study was conducted in an ethical and responsible manner. In some cases, the approval notice is included as an appendix to your paper.
III. Problems to Avoid
Irrelevant Detail The methodology section of your paper should be thorough but concise. Do not provide any background information that does not directly help the reader understand why a particular method was chosen, how the data was gathered or obtained, and how the data was analyzed in relation to the research problem [note: analyzed, not interpreted! Save how you interpreted the findings for the discussion section]. With this in mind, the page length of your methods section will generally be less than any other section of your paper except the conclusion.
Unnecessary Explanation of Basic Procedures Remember that you are not writing a how-to guide about a particular method. You should make the assumption that readers possess a basic understanding of how to investigate the research problem on their own and, therefore, you do not have to go into great detail about specific methodological procedures. The focus should be on how you applied a method , not on the mechanics of doing a method. An exception to this rule is if you select an unconventional methodological approach; if this is the case, be sure to explain why this approach was chosen and how it enhances the overall process of discovery.
Problem Blindness It is almost a given that you will encounter problems when collecting or generating your data, or, gaps will exist in existing data or archival materials. Do not ignore these problems or pretend they did not occur. Often, documenting how you overcame obstacles can form an interesting part of the methodology. It demonstrates to the reader that you can provide a cogent rationale for the decisions you made to minimize the impact of any problems that arose.
Literature Review Just as the literature review section of your paper provides an overview of sources you have examined while researching a particular topic, the methodology section should cite any sources that informed your choice and application of a particular method [i.e., the choice of a survey should include any citations to the works you used to help construct the survey].
It’s More than Sources of Information! A description of a research study's method should not be confused with a description of the sources of information. Such a list of sources is useful in and of itself, especially if it is accompanied by an explanation about the selection and use of the sources. The description of the project's methodology complements a list of sources in that it sets forth the organization and interpretation of information emanating from those sources.
Azevedo, L.F. et al. "How to Write a Scientific Paper: Writing the Methods Section." Revista Portuguesa de Pneumologia 17 (2011): 232-238; Blair Lorrie. “Choosing a Methodology.” In Writing a Graduate Thesis or Dissertation , Teaching Writing Series. (Rotterdam: Sense Publishers 2016), pp. 49-72; Butin, Dan W. The Education Dissertation A Guide for Practitioner Scholars . Thousand Oaks, CA: Corwin, 2010; Carter, Susan. Structuring Your Research Thesis . New York: Palgrave Macmillan, 2012; Kallet, Richard H. “How to Write the Methods Section of a Research Paper.” Respiratory Care 49 (October 2004):1229-1232; Lunenburg, Frederick C. Writing a Successful Thesis or Dissertation: Tips and Strategies for Students in the Social and Behavioral Sciences . Thousand Oaks, CA: Corwin Press, 2008. Methods Section. The Writer’s Handbook. Writing Center. University of Wisconsin, Madison; Rudestam, Kjell Erik and Rae R. Newton. “The Method Chapter: Describing Your Research Plan.” In Surviving Your Dissertation: A Comprehensive Guide to Content and Process . (Thousand Oaks, Sage Publications, 2015), pp. 87-115; What is Interpretive Research. Institute of Public and International Affairs, University of Utah; Writing the Experimental Report: Methods, Results, and Discussion. The Writing Lab and The OWL. Purdue University; Methods and Materials. The Structure, Format, Content, and Style of a Journal-Style Scientific Paper. Department of Biology. Bates College.
Writing Tip
Statistical Designs and Tests? Do Not Fear Them!
Don't avoid using a quantitative approach to analyzing your research problem just because you fear the idea of applying statistical designs and tests. A qualitative approach, such as conducting interviews or content analysis of archival texts, can yield exciting new insights about a research problem, but it should not be undertaken simply because you have a disdain for running a simple regression. A well designed quantitative research study can often be accomplished in very clear and direct ways, whereas, a similar study of a qualitative nature usually requires considerable time to analyze large volumes of data and a tremendous burden to create new paths for analysis where previously no path associated with your research problem had existed.
To locate data and statistics, GO HERE .
Another Writing Tip
Knowing the Relationship Between Theories and Methods
There can be multiple meaning associated with the term "theories" and the term "methods" in social sciences research. A helpful way to delineate between them is to understand "theories" as representing different ways of characterizing the social world when you research it and "methods" as representing different ways of generating and analyzing data about that social world. Framed in this way, all empirical social sciences research involves theories and methods, whether they are stated explicitly or not. However, while theories and methods are often related, it is important that, as a researcher, you deliberately separate them in order to avoid your theories playing a disproportionate role in shaping what outcomes your chosen methods produce.
Introspectively engage in an ongoing dialectic between the application of theories and methods to help enable you to use the outcomes from your methods to interrogate and develop new theories, or ways of framing conceptually the research problem. This is how scholarship grows and branches out into new intellectual territory.
Reynolds, R. Larry. Ways of Knowing. Alternative Microeconomics . Part 1, Chapter 3. Boise State University; The Theory-Method Relationship. S-Cool Revision. United Kingdom.
Yet Another Writing Tip
Methods and the Methodology
Do not confuse the terms "methods" and "methodology." As Schneider notes, a method refers to the technical steps taken to do research . Descriptions of methods usually include defining and stating why you have chosen specific techniques to investigate a research problem, followed by an outline of the procedures you used to systematically select, gather, and process the data [remember to always save the interpretation of data for the discussion section of your paper].
The methodology refers to a discussion of the underlying reasoning why particular methods were used . This discussion includes describing the theoretical concepts that inform the choice of methods to be applied, placing the choice of methods within the more general nature of academic work, and reviewing its relevance to examining the research problem. The methodology section also includes a thorough review of the methods other scholars have used to study the topic.
Bryman, Alan. "Of Methods and Methodology." Qualitative Research in Organizations and Management: An International Journal 3 (2008): 159-168; Schneider, Florian. “What's in a Methodology: The Difference between Method, Methodology, and Theory…and How to Get the Balance Right?” PoliticsEastAsia.com. Chinese Department, University of Leiden, Netherlands.
- << Previous: Scholarly vs. Popular Publications
- Next: Qualitative Methods >>
- Last Updated: Sep 4, 2024 9:40 AM
- URL: https://libguides.usc.edu/writingguide
Still have questions? Leave a comment
Add Comment
Checklist: Dissertation Proposal
Enter your email id to get the downloadable right in your inbox!
Examples: Edited Papers
Need editing and proofreading services, research methodology guide: writing tips, types, & examples.

- Tags: Academic Research , Research
No dissertation or research paper is complete without the research methodology section. Since this is the chapter where you explain how you carried out your research, this is where all the meat is! Here’s where you clearly lay out the steps you have taken to test your hypothesis or research problem.
Through this blog, we’ll unravel the complexities and meaning of research methodology in academic writing , from its fundamental principles and ethics to the diverse types of research methodology in use today. Alongside offering research methodology examples, we aim to guide you on how to write research methodology, ensuring your research endeavors are both impactful and impeccably grounded!
Ensure your research methodology is foolproof. Learn more
Let’s first take a closer look at a simple research methodology definition:
Defining what is research methodology
Research methodology is the set of procedures and techniques used to collect, analyze, and interpret data to understand and solve a research problem. Methodology in research not only includes the design and methods but also the basic principles that guide the choice of specific methods.
Grasping the concept of methodology in research is essential for students and scholars, as it demonstrates the thorough and structured method used to explore a hypothesis or research question. Understanding the definition of methodology in research aids in identifying the methods used to collect data. Be it through any type of research method approach, ensuring adherence to the proper research paper format is crucial.
Now let’s explore some research methodology types:
Types of research methodology
1. qualitative research methodology.
Qualitative research methodology is aimed at understanding concepts, thoughts, or experiences. This approach is descriptive and is often utilized to gather in-depth insights into people’s attitudes, behaviors, or cultures. Qualitative research methodology involves methods like interviews, focus groups, and observation. The strength of this methodology lies in its ability to provide contextual richness.
2. Quantitative research methodology
Quantitative research methodology, on the other hand, is focused on quantifying the problem by generating numerical data or data that can be transformed into usable statistics. It uses measurable data to formulate facts and uncover patterns in research. Quantitative research methodology typically involves surveys, experiments, or statistical analysis. This methodology is appreciated for its ability to produce objective results that are generalizable to a larger population.
3. Mixed-Methods research methodology
Mixed-methods research combines both qualitative and quantitative research methodologies to provide a more comprehensive understanding of the research problem. This approach leverages the strengths of both methodologies to provide a deeper insight into the research question of a research paper .
Research methodology vs. research methods
The research methodology or design is the overall strategy and rationale that you used to carry out the research. Whereas, research methods are the specific tools and processes you use to gather and understand the data you need to test your hypothesis.
Research methodology examples and application
To further understand research methodology, let’s explore some examples of research methodology:
a. Qualitative research methodology example: A study exploring the impact of author branding on author popularity might utilize in-depth interviews to gather personal experiences and perspectives.
b. Quantitative research methodology example: A research project investigating the effects of a book promotion technique on book sales could employ a statistical analysis of profit margins and sales before and after the implementation of the method.
c. Mixed-Methods research methodology example: A study examining the relationship between social media use and academic performance might combine both qualitative and quantitative approaches. It could include surveys to quantitatively assess the frequency of social media usage and its correlation with grades, alongside focus groups or interviews to qualitatively explore students’ perceptions and experiences regarding how social media affects their study habits and academic engagement.
These examples highlight the meaning of methodology in research and how it guides the research process, from data collection to analysis, ensuring the study’s objectives are met efficiently.
Importance of methodology in research papers
When it comes to writing your study, the methodology in research papers or a dissertation plays a pivotal role. A well-crafted methodology section of a research paper or thesis not only enhances the credibility of your research but also provides a roadmap for others to replicate or build upon your work.
How to structure the research methods chapter
Wondering how to write the research methodology section? Follow these steps to create a strong methods chapter:
Step 1: Explain your research methodology
At the start of a research paper , you would have provided the background of your research and stated your hypothesis or research problem. In this section, you will elaborate on your research strategy.
Begin by restating your research question and proceed to explain what type of research you opted for to test it. Depending on your research, here are some questions you can consider:
a. Did you use qualitative or quantitative data to test the hypothesis?
b. Did you perform an experiment where you collected data or are you writing a dissertation that is descriptive/theoretical without data collection?
c. Did you use primary data that you collected or analyze secondary research data or existing data as part of your study?
These questions will help you establish the rationale for your study on a broader level, which you will follow by elaborating on the specific methods you used to collect and understand your data.
Step 2: Explain the methods you used to test your hypothesis
Now that you have told your reader what type of research you’ve undertaken for the dissertation, it’s time to dig into specifics. State what specific methods you used and explain the conditions and variables involved. Explain what the theoretical framework behind the method was, what samples you used for testing it, and what tools and materials you used to collect the data.
Step 3: Explain how you analyzed the results
Once you have explained the data collection process, explain how you analyzed and studied the data. Here, your focus is simply to explain the methods of analysis rather than the results of the study.
Here are some questions you can answer at this stage:
a. What tools or software did you use to analyze your results?
b. What parameters or variables did you consider while understanding and studying the data you’ve collected?
c. Was your analysis based on a theoretical framework?
Your mode of analysis will change depending on whether you used a quantitative or qualitative research methodology in your study. If you’re working within the hard sciences or physical sciences, you are likely to use a quantitative research methodology (relying on numbers and hard data). If you’re doing a qualitative study, in the social sciences or humanities, your analysis may rely on understanding language and socio-political contexts around your topic. This is why it’s important to establish what kind of study you’re undertaking at the onset.
Step 4: Defend your choice of methodology
Now that you have gone through your research process in detail, you’ll also have to make a case for it. Justify your choice of methodology and methods, explaining why it is the best choice for your research question. This is especially important if you have chosen an unconventional approach or you’ve simply chosen to study an existing research problem from a different perspective. Compare it with other methodologies, especially ones attempted by previous researchers, and discuss what contributions using your methodology makes.
Step 5: Discuss the obstacles you encountered and how you overcame them
No matter how thorough a methodology is, it doesn’t come without its hurdles. This is a natural part of scientific research that is important to document so that your peers and future researchers are aware of it. Writing in a research paper about this aspect of your research process also tells your evaluator that you have actively worked to overcome the pitfalls that came your way and you have refined the research process.
Tips to write an effective methodology chapter
1. Remember who you are writing for. Keeping sight of the reader/evaluator will help you know what to elaborate on and what information they are already likely to have. You’re condensing months’ work of research in just a few pages, so you should omit basic definitions and information about general phenomena people already know.
2. Do not give an overly elaborate explanation of every single condition in your study.
3. Skip details and findings irrelevant to the results.
4. Cite references that back your claim and choice of methodology.
5. Consistently emphasize the relationship between your research question and the methodology you adopted to study it.
To sum it up, what is methodology in research? It’s the blueprint of your research, essential for ensuring that your study is systematic, rigorous, and credible. Whether your focus is on qualitative research methodology, quantitative research methodology, or a combination of both, understanding and clearly defining your methodology is key to the success of your research.
Once you write the research methodology and complete writing the entire research paper, the next step is to edit your paper. As experts in research paper editing and proofreading services , we’d love to help you perfect your paper!
Here are some other articles that you might find useful:
- Essential Research Tips for Essay Writing
- How to Write a Lab Report: Examples from Academic Editors
- The Essential Types of Editing Every Writer Needs to Know
- Editing and Proofreading Academic Papers: A Short Guide
- The Top 10 Editing and Proofreading Services of 2023
Frequently Asked Questions
What does research methodology mean, what types of research methodologies are there, what is qualitative research methodology, how to determine sample size in research methodology, what is action research methodology.
Found this article helpful?
One comment on “ Research Methodology Guide: Writing Tips, Types, & Examples ”
This is very simplified and direct. Very helpful to understand the research methodology section of a dissertation
Leave a Comment: Cancel reply
Your email address will not be published.
Your vs. You’re: When to Use Your and You’re
Your organization needs a technical editor: here’s why, your guide to the best ebook readers in 2024, writing for the web: 7 expert tips for web content writing.
Subscribe to our Newsletter
Get carefully curated resources about writing, editing, and publishing in the comfort of your inbox.
How to Copyright Your Book?
If you’ve thought about copyrighting your book, you’re on the right path.
© 2024 All rights reserved
- Terms of service
- Privacy policy
- Self Publishing Guide
- Pre-Publishing Steps
- Fiction Writing Tips
- Traditional Publishing
- Additional Resources
- Dissertation Writing Guide
- Essay Writing Guide
- Academic Writing and Publishing
- Citation and Referencing
- Partner with us
- Annual report
- Website content
- Marketing material
- Job Applicant
- Cover letter
- Resource Center
- Case studies
Educational resources and simple solutions for your research journey

How to Write the Methods Section of a Research Paper
Writing a research paper is both an art and a skill, and knowing how to write the methods section of a research paper is the first crucial step in mastering scientific writing. If, like the majority of early career researchers, you believe that the methods section is the simplest to write and needs little in the way of careful consideration or thought, this article will help you understand it is not 1 .
We have all probably asked our supervisors, coworkers, or search engines “ how to write a methods section of a research paper ” at some point in our scientific careers, so you are not alone if that’s how you ended up here. Even for seasoned researchers, selecting what to include in the methods section from a wealth of experimental information can occasionally be a source of distress and perplexity.
Additionally, journal specifications, in some cases, may make it more of a requirement rather than a choice to provide a selective yet descriptive account of the experimental procedure. Hence, knowing these nuances of how to write the methods section of a research paper is critical to its success. The methods section of the research paper is not supposed to be a detailed heavy, dull section that some researchers tend to write; rather, it should be the central component of the study that justifies the validity and reliability of the research.
Are you still unsure of how the methods section of a research paper forms the basis of every investigation? Consider the last article you read but ignore the methods section and concentrate on the other parts of the paper . Now think whether you could repeat the study and be sure of the credibility of the findings despite knowing the literature review and even having the data in front of you. You have the answer!

Having established the importance of the methods section , the next question is how to write the methods section of a research paper that unifies the overall study. The purpose of the methods section , which was earlier called as Materials and Methods , is to describe how the authors went about answering the “research question” at hand. Here, the objective is to tell a coherent story that gives a detailed account of how the study was conducted, the rationale behind specific experimental procedures, the experimental setup, objects (variables) involved, the research protocol employed, tools utilized to measure, calculations and measurements, and the analysis of the collected data 2 .
In this article, we will take a deep dive into this topic and provide a detailed overview of how to write the methods section of a research paper . For the sake of clarity, we have separated the subject into various sections with corresponding subheadings.
Table of Contents
What is the methods section of a research paper ?
The methods section is a fundamental section of any paper since it typically discusses the ‘ what ’, ‘ how ’, ‘ which ’, and ‘ why ’ of the study, which is necessary to arrive at the final conclusions. In a research article, the introduction, which serves to set the foundation for comprehending the background and results is usually followed by the methods section, which precedes the result and discussion sections. The methods section must explicitly state what was done, how it was done, which equipment, tools and techniques were utilized, how were the measurements/calculations taken, and why specific research protocols, software, and analytical methods were employed.
Why is the methods section important?
The primary goal of the methods section is to provide pertinent details about the experimental approach so that the reader may put the results in perspective and, if necessary, replicate the findings 3 . This section offers readers the chance to evaluate the reliability and validity of any study. In short, it also serves as the study’s blueprint, assisting researchers who might be unsure about any other portion in establishing the study’s context and validity. The methods plays a rather crucial role in determining the fate of the article; an incomplete and unreliable methods section can frequently result in early rejections and may lead to numerous rounds of modifications during the publication process. This means that the reviewers also often use methods section to assess the reliability and validity of the research protocol and the data analysis employed to address the research topic. In other words, the purpose of the methods section is to demonstrate the research acumen and subject-matter expertise of the author(s) in their field.
Structure of methods section of a research paper
Similar to the research paper, the methods section also follows a defined structure; this may be dictated by the guidelines of a specific journal or can be presented in a chronological or thematic manner based on the study type. When writing the methods section , authors should keep in mind that they are telling a story about how the research was conducted. They should only report relevant information to avoid confusing the reader and include details that would aid in connecting various aspects of the entire research activity together. It is generally advisable to present experiments in the order in which they were conducted. This facilitates the logical flow of the research and allows readers to follow the progression of the study design.

It is also essential to clearly state the rationale behind each experiment and how the findings of earlier experiments informed the design or interpretation of later experiments. This allows the readers to understand the overall purpose of the study design and the significance of each experiment within that context. However, depending on the particular research question and method, it may make sense to present information in a different order; therefore, authors must select the best structure and strategy for their individual studies.
In cases where there is a lot of information, divide the sections into subheadings to cover the pertinent details. If the journal guidelines pose restrictions on the word limit , additional important information can be supplied in the supplementary files. A simple rule of thumb for sectioning the method section is to begin by explaining the methodological approach ( what was done ), describing the data collection methods ( how it was done ), providing the analysis method ( how the data was analyzed ), and explaining the rationale for choosing the methodological strategy. This is described in detail in the upcoming sections.
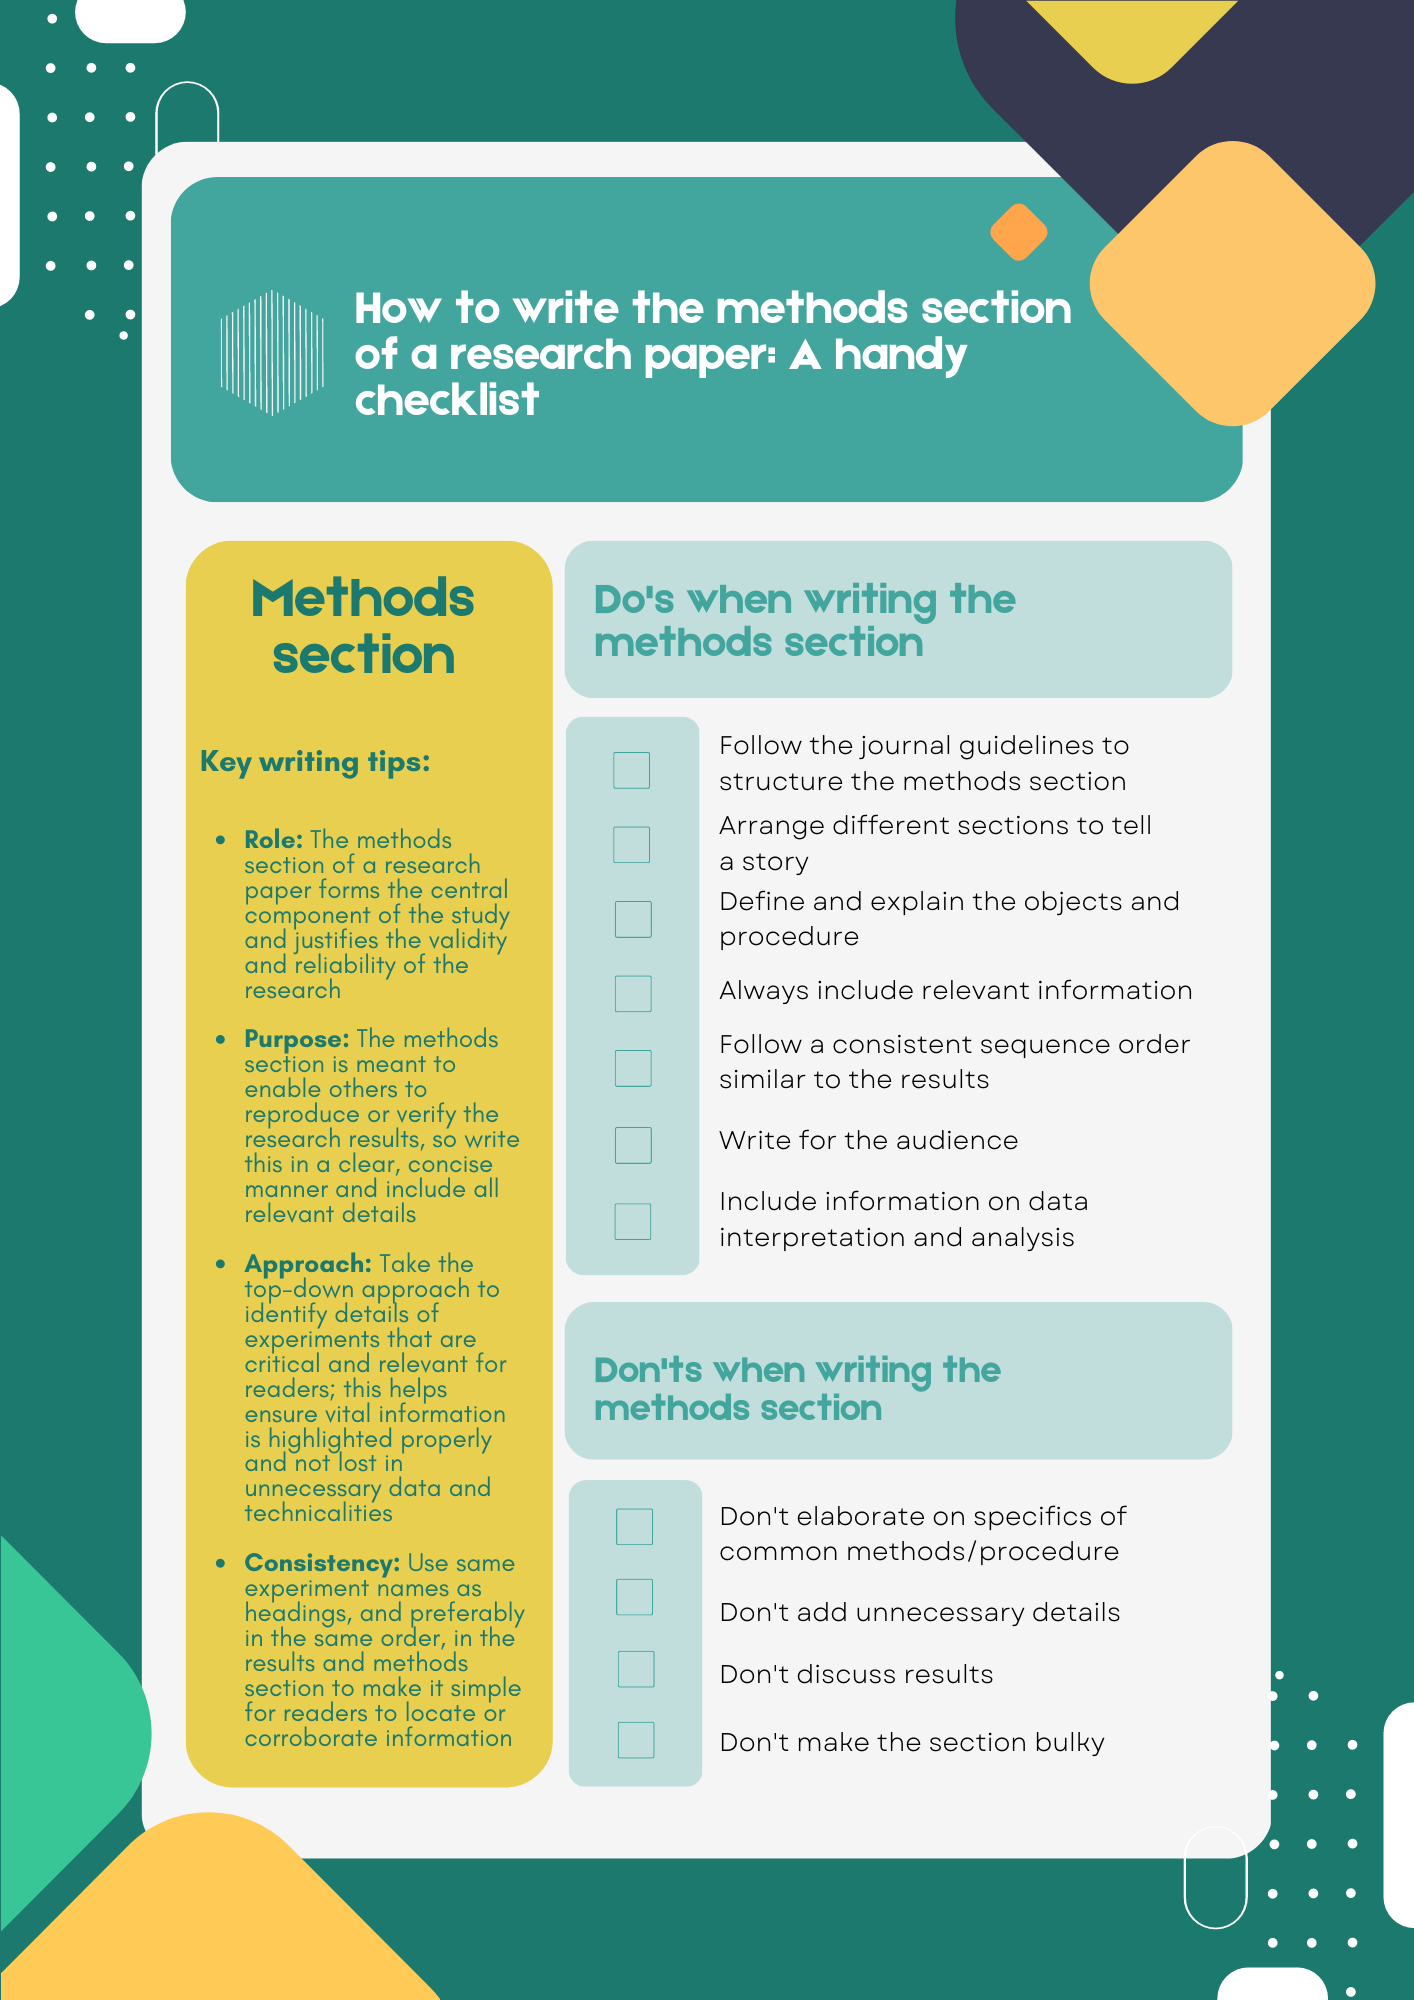
How to write the methods section of a research paper
Contrary to widespread assumption, the methods section of a research paper should be prepared once the study is complete to prevent missing any key parameter. Hence, please make sure that all relevant experiments are done before you start writing a methods section . The next step for authors is to look up any applicable academic style manuals or journal-specific standards to ensure that the methods section is formatted correctly. The methods section of a research paper typically constitutes materials and methods; while writing this section, authors usually arrange the information under each category.
The materials category describes the samples, materials, treatments, and instruments, while experimental design, sample preparation, data collection, and data analysis are a part of the method category. According to the nature of the study, authors should include additional subsections within the methods section, such as ethical considerations like the declaration of Helsinki (for studies involving human subjects), demographic information of the participants, and any other crucial information that can affect the output of the study. Simply put, the methods section has two major components: content and format. Here is an easy checklist for you to consider if you are struggling with how to write the methods section of a research paper .
- Explain the research design, subjects, and sample details
- Include information on inclusion and exclusion criteria
- Mention ethical or any other permission required for the study
- Include information about materials, experimental setup, tools, and software
- Add details of data collection and analysis methods
- Incorporate how research biases were avoided or confounding variables were controlled
- Evaluate and justify the experimental procedure selected to address the research question
- Provide precise and clear details of each experiment
- Flowcharts, infographics, or tables can be used to present complex information
- Use past tense to show that the experiments have been done
- Follow academic style guides (such as APA or MLA ) to structure the content
- Citations should be included as per standard protocols in the field
Now that you know how to write the methods section of a research paper , let’s address another challenge researchers face while writing the methods section —what to include in the methods section . How much information is too much is not always obvious when it comes to trying to include data in the methods section of a paper. In the next section, we examine this issue and explore potential solutions.

What to include in the methods section of a research paper
The technical nature of the methods section occasionally makes it harder to present the information clearly and concisely while staying within the study context. Many young researchers tend to veer off subject significantly, and they frequently commit the sin of becoming bogged down in itty bitty details, making the text harder to read and impairing its overall flow. However, the best way to write the methods section is to start with crucial components of the experiments. If you have trouble deciding which elements are essential, think about leaving out those that would make it more challenging to comprehend the context or replicate the results. The top-down approach helps to ensure all relevant information is incorporated and vital information is not lost in technicalities. Next, remember to add details that are significant to assess the validity and reliability of the study. Here is a simple checklist for you to follow ( bonus tip: you can also make a checklist for your own study to avoid missing any critical information while writing the methods section ).
- Structuring the methods section : Authors should diligently follow journal guidelines and adhere to the specific author instructions provided when writing the methods section . Journals typically have specific guidelines for formatting the methods section ; for example, Frontiers in Plant Sciences advises arranging the materials and methods section by subheading and citing relevant literature. There are several standardized checklists available for different study types in the biomedical field, including CONSORT (Consolidated Standards of Reporting Trials) for randomized clinical trials, PRISMA (Preferred Reporting Items for Systematic reviews and Meta-Analysis) for systematic reviews and meta-analysis, and STROBE (STrengthening the Reporting of OBservational studies in Epidemiology) for cohort, case-control, cross-sectional studies. Before starting the methods section , check the checklist available in your field that can function as a guide.
- Organizing different sections to tell a story : Once you are sure of the format required for structuring the methods section , the next is to present the sections in a logical manner; as mentioned earlier, the sections can be organized according to the chronology or themes. In the chronological arrangement, you should discuss the methods in accordance with how the experiments were carried out. An example of the method section of a research paper of an animal study should first ideally include information about the species, weight, sex, strain, and age. Next, the number of animals, their initial conditions, and their living and housing conditions should also be mentioned. Second, how the groups are assigned and the intervention (drug treatment, stress, or other) given to each group, and finally, the details of tools and techniques used to measure, collect, and analyze the data. Experiments involving animal or human subjects should additionally state an ethics approval statement. It is best to arrange the section using the thematic approach when discussing distinct experiments not following a sequential order.
- Define and explain the objects and procedure: Experimental procedure should clearly be stated in the methods section . Samples, necessary preparations (samples, treatment, and drug), and methods for manipulation need to be included. All variables (control, dependent, independent, and confounding) must be clearly defined, particularly if the confounding variables can affect the outcome of the study.
- Match the order of the methods section with the order of results: Though not mandatory, organizing the manuscript in a logical and coherent manner can improve the readability and clarity of the paper. This can be done by following a consistent structure throughout the manuscript; readers can easily navigate through the different sections and understand the methods and results in relation to each other. Using experiment names as headings for both the methods and results sections can also make it simpler for readers to locate specific information and corroborate it if needed.
- Relevant information must always be included: The methods section should have information on all experiments conducted and their details clearly mentioned. Ask the journal whether there is a way to offer more information in the supplemental files or external repositories if your target journal has strict word limitations. For example, Nature communications encourages authors to deposit their step-by-step protocols in an open-resource depository, Protocol Exchange which allows the protocols to be linked with the manuscript upon publication. Providing access to detailed protocols also helps to increase the transparency and reproducibility of the research.
- It’s all in the details: The methods section should meticulously list all the materials, tools, instruments, and software used for different experiments. Specify the testing equipment on which data was obtained, together with its manufacturer’s information, location, city, and state or any other stimuli used to manipulate the variables. Provide specifics on the research process you employed; if it was a standard protocol, cite previous studies that also used the protocol. Include any protocol modifications that were made, as well as any other factors that were taken into account when planning the study or gathering data. Any new or modified techniques should be explained by the authors. Typically, readers evaluate the reliability and validity of the procedures using the cited literature, and a widely accepted checklist helps to support the credibility of the methodology. Note: Authors should include a statement on sample size estimation (if applicable), which is often missed. It enables the reader to determine how many subjects will be required to detect the expected change in the outcome variables within a given confidence interval.
- Write for the audience: While explaining the details in the methods section , authors should be mindful of their target audience, as some of the rationale or assumptions on which specific procedures are based might not always be obvious to the audience, particularly for a general audience. Therefore, when in doubt, the objective of a procedure should be specified either in relation to the research question or to the entire protocol.
- Data interpretation and analysis : Information on data processing, statistical testing, levels of significance, and analysis tools and software should be added. Mention if the recommendations and expertise of an experienced statistician were followed. Also, evaluate and justify the preferred statistical method used in the study and its significance.
What NOT to include in the methods section of a research paper
To address “ how to write the methods section of a research paper ”, authors should not only pay careful attention to what to include but also what not to include in the methods section of a research paper . Here is a list of do not’s when writing the methods section :
- Do not elaborate on specifics of standard methods/procedures: You should refrain from adding unnecessary details of experiments and practices that are well established and cited previously. Instead, simply cite relevant literature or mention if the manufacturer’s protocol was followed.
- Do not add unnecessary details : Do not include minute details of the experimental procedure and materials/instruments used that are not significant for the outcome of the experiment. For example, there is no need to mention the brand name of the water bath used for incubation.
- Do not discuss the results: The methods section is not to discuss the results or refer to the tables and figures; save it for the results and discussion section. Also, focus on the methods selected to conduct the study and avoid diverting to other methods or commenting on their pros or cons.
- Do not make the section bulky : For extensive methods and protocols, provide the essential details and share the rest of the information in the supplemental files. The writing should be clear yet concise to maintain the flow of the section.
We hope that by this point, you understand how crucial it is to write a thoughtful and precise methods section and the ins and outs of how to write the methods section of a research paper . To restate, the entire purpose of the methods section is to enable others to reproduce the results or verify the research. We sincerely hope that this post has cleared up any confusion and given you a fresh perspective on the methods section .
As a parting gift, we’re leaving you with a handy checklist that will help you understand how to write the methods section of a research paper . Feel free to download this checklist and use or share this with those who you think may benefit from it.
References
- Bhattacharya, D. How to write the Methods section of a research paper. Editage Insights, 2018. https://www.editage.com/insights/how-to-write-the-methods-section-of-a-research-paper (2018).
- Kallet, R. H. How to Write the Methods Section of a Research Paper. Respiratory Care 49, 1229–1232 (2004). https://pubmed.ncbi.nlm.nih.gov/15447808/
- Grindstaff, T. L. & Saliba, S. A. AVOIDING MANUSCRIPT MISTAKES. Int J Sports Phys Ther 7, 518–524 (2012). https://www.ncbi.nlm.nih.gov/pmc/articles/PMC3474299/
Editage All Access is a subscription-based platform that unifies the best AI tools and services designed to speed up, simplify, and streamline every step of a researcher’s journey. The Editage All Access Pack is a one-of-a-kind subscription that unlocks full access to an AI writing assistant, literature recommender, journal finder, scientific illustration tool, and exclusive discounts on professional publication services from Editage.
Based on 22+ years of experience in academia, Editage All Access empowers researchers to put their best research forward and move closer to success. Explore our top AI Tools pack, AI Tools + Publication Services pack, or Build Your Own Plan. Find everything a researcher needs to succeed, all in one place – Get All Access now starting at just $14 a month !
Related Posts

How Editage All Access is Boosting Productivity for Academics in India

How to Write a Dissertation: A Beginner’s Guide
15 Research Methodology Examples

Tio Gabunia (B.Arch, M.Arch)
Tio Gabunia is an academic writer and architect based in Tbilisi. He has studied architecture, design, and urban planning at the Georgian Technical University and the University of Lisbon. He has worked in these fields in Georgia, Portugal, and France. Most of Tio’s writings concern philosophy. Other writings include architecture, sociology, urban planning, and economics.
Learn about our Editorial Process

Chris Drew (PhD)
Dr. Chris Drew is the founder of the Helpful Professor. He holds a PhD in education and has published over 20 articles in scholarly journals. He is the former editor of the Journal of Learning Development in Higher Education. [Image Descriptor: Photo of Chris]

Research methodologies can roughly be categorized into three group: quantitative, qualitative, and mixed-methods.
- Qualitative Research : This methodology is based on obtaining deep, contextualized, non-numerical data. It can occur, for example, through open-ended questioning of research particiapnts in order to understand human behavior. It’s all about describing and analyzing subjective phenomena such as emotions or experiences.
- Quantitative Research: This methodology is rationally-based and relies heavily on numerical analysis of empirical data . With quantitative research, you aim for objectivity by creating hypotheses and testing them through experiments or surveys, which allow for statistical analyses.
- Mixed-Methods Research: Mixed-methods research combines both previous types into one project. We have more flexibility when designing our research study with mixed methods since we can use multiple approaches depending on our needs at each time. Using mixed methods can help us validate our results and offer greater predictability than just either type of methodology alone could provide.
Below are research methodologies that fit into each category.

Qualitative Research Methodologies
1. case study.
Conducts an in-depth examination of a specific case, individual, or event to understand a phenomenon.
Instead of examining a whole population for numerical trend data, case study researchers seek in-depth explanations of one event.
The benefit of case study research is its ability to elucidate overlooked details of interesting cases of a phenomenon (Busetto, Wick & Gumbinger, 2020). It offers deep insights for empathetic, reflective, and thoughtful understandings of that phenomenon.
However, case study findings aren’t transferrable to new contexts or for population-wide predictions. Instead, they inform practitioner understandings for nuanced, deep approaches to future instances (Liamputtong, 2020).
2. Grounded Theory
Grounded theory involves generating hypotheses and theories through the collection and interpretation of data (Faggiolani, n.d.). Its distinguishing features is that it doesn’t test a hypothesis generated prior to analysis, but rather generates a hypothesis or ‘theory’ that emerges from the data.
It also involves the application of inductive reasoning and is often contrasted with the hypothetico-deductive model of scientific research. This research methodology was developed by Barney Glaser and Anselm Strauss in the 1960s (Glaser & Strauss, 2009).
The basic difference between traditional scientific approaches to research and grounded theory is that the latter begins with a question, then collects data, and the theoretical framework is said to emerge later from this data.
By contrast, scientists usually begin with an existing theoretical framework , develop hypotheses, and only then start collecting data to verify or falsify the hypotheses.
3. Ethnography
In ethnographic research , the researcher immerses themselves within the group they are studying, often for long periods of time.
This type of research aims to understand the shared beliefs, practices, and values of a particular community by immersing the researcher within the cultural group.
Although ethnographic research cannot predict or identify trends in an entire population, it can create detailed explanations of cultural practices and comparisons between social and cultural groups.
When a person conducts an ethnographic study of themselves or their own culture, it can be considered autoethnography .
Its strength lies in producing comprehensive accounts of groups of people and their interactions.
Common methods researchers use during an ethnographic study include participant observation , thick description, unstructured interviews, and field notes vignettes. These methods can provide detailed and contextualized descriptions of their subjects.
Example Study
Liquidated: An Ethnography of Wall Street by Karen Ho involves an anthropologist who embeds herself with Wall Street firms to study the culture of Wall Street bankers and how this culture affects the broader economy and world.
4. Phenomenology
Phenomenology to understand and describe individuals’ lived experiences concerning a specific phenomenon.
As a research methodology typically used in the social sciences , phenomenology involves the study of social reality as a product of intersubjectivity (the intersection of people’s cognitive perspectives) (Zahavi & Overgaard, n.d.).
This philosophical approach was first developed by Edmund Husserl.
5. Narrative Research
Narrative research explores personal stories and experiences to understand their meanings and interpretations.
It is also known as narrative inquiry and narrative analysis(Riessman, 1993).
This approach to research uses qualitative material like journals, field notes, letters, interviews, texts, photos, etc., as its data.
It is aimed at understanding the way people create meaning through narratives (Clandinin & Connelly, 2004).
6. Discourse Analysis
A discourse analysis examines the structure, patterns, and functions of language in context to understand how the text produces social constructs.
This methodology is common in critical theory , poststructuralism , and postmodernism. Its aim is to understand how language constructs discourses (roughly interpreted as “ways of thinking and constructing knowledge”).
As a qualitative methodology , its focus is on developing themes through close textual analysis rather than using numerical methods. Common methods for extracting data include semiotics and linguistic analysis.
7. Action Research
Action research involves researchers working collaboratively with stakeholders to address problems, develop interventions, and evaluate effectiveness.
Action research is a methodology and philosophy of research that is common in the social sciences.
The term was first coined in 1944 by Kurt Lewin, a German-American psychologist who also introduced applied research and group communication (Altrichter & Gstettner, 1993).
Lewin originally defined action research as involving two primary processes: taking action and doing research (Lewin, 1946).
Action research involves planning, action, and information-seeking about the result of the action.
Since Lewin’s original formulation, many different theoretical approaches to action research have been developed. These include action science, participatory action research, cooperative inquiry, and living educational theory among others.
Using Digital Sandbox Gaming to Improve Creativity Within Boys’ Writing (Ellison & Drew, 2019) is a study conducted by a school teacher who used video games to help teach his students English. It involved action research, where he interviewed his students to see if the use of games as stimuli for storytelling helped draw them into the learning experience, and iterated on his teaching style based on their feedback (disclaimer: I am the second author of this study).
See More: Examples of Qualitative Research
Quantitative Research Methodologies
8. experimental design.
As the name suggests, this type of research is based on testing hypotheses in experimental settings by manipulating variables and observing their effects on other variables.
The main benefit lies in its ability to manipulate specific variables to determine their effect on outcomes which is a great method for those looking for causational links in their research.
This is common, for example, in high-school science labs, where students are asked to introduce a variable into a setting in order to examine its effect.
9. Non-Experimental Design
Non-experimental design observes and measures associations between variables without manipulating them.
It can take, for example, the form of a ‘fly on the wall’ observation of a phenomenon, allowing researchers to examine authentic settings and changes that occur naturally in the environment.
10. Cross-Sectional Design
Cross-sectional design involves analyzing variables pertaining to a specific time period and at that exact moment.
This approach allows for an extensive examination and comparison of distinct and independent subjects, thereby offering advantages over qualitative methodologies such as case studies or surveys.
While cross-sectional design can be extremely useful in taking a ‘snapshot in time’, as a standalone method, it is not useful for examining changes in subjects after an intervention. The next methodology addresses this issue.
The prime example of this type of study is a census. A population census is mailed out to every house in the country, and each household must complete the census on the same evening. This allows the government to gather a snapshot of the nation’s demographics, beliefs, religion, and so on.
11. Longitudinal Design
Longitudinal research gathers data from the same subjects over an extended period to analyze changes and development.
In contrast to cross-sectional tactics, longitudinal designs examine variables more than once, over a pre-determined time span, allowing for multiple data points to be taken at different times.
A cross-sectional design is also useful for examining cohort effects , by comparing differences or changes in multiple different generations’ beliefs over time.
With multiple data points collected over extended periods ,it’s possible to examine continuous changes within things like population dynamics or consumer behavior. This makes detailed analysis of change possible.
12. Quasi-Experimental Design
Quasi-experimental design involves manipulating variables for analysis, but uses pre-existing groups of subjects rather than random groups.
Because the groups of research participants already exist, they cannot be randomly assigned to a cohort as with a true experimental design study. This makes inferring a causal relationship more difficult, but is nonetheless often more feasible in real-life settings.
Quasi-experimental designs are generally considered inferior to true experimental designs.
13. Correlational Research
Correlational research examines the relationships between two or more variables, determining the strength and direction of their association.
Similar to quasi-experimental methods, this type of research focuses on relationship differences between variables.
This approach provides a fast and easy way to make initial hypotheses based on either positive or negative correlation trends that can be observed within dataset.
Methods used for data analysis may include statistic correlations such as Pearson’s or Spearman’s.
Mixed-Methods Research Methodologies
14. sequential explanatory design (quan→qual).
This methodology involves conducting quantitative analysis first, then supplementing it with a qualitative study.
It begins by collecting quantitative data that is then analyzed to determine any significant patterns or trends.
Secondly, qualitative methods are employed. Their intent is to help interpret and expand the quantitative results.
This offers greater depth into understanding both large and smaller aspects of research questions being addressed.
The rationale behind this approach is to ensure that your data collection generates richer context for gaining insight into the particular issue across different levels, integrating in one study, qualitative exploration as well as statistical procedures.
15. Sequential Exploratory Design (QUAL→QUAN)
This methodology goes in the other direction, starting with qualitative analysis and ending with quantitative analysis.
It starts with qualitative research that delves deeps into complex areas and gathers rich information through interviewing or observing participants.
After this stage of exploration comes to an end, quantitative techniques are used to analyze the collected data through inferential statistics.
The idea is that a qualitative study can arm the researchers with a strong hypothesis testing framework, which they can then apply to a larger sample size using qualitative methods.
When I first took research classes, I had a lot of trouble distinguishing between methodologies and methods.
The key is to remember that the methodology sets the direction, while the methods are the specific tools to be used. A good analogy is transport: first you need to choose a mode (public transport, private transport, motorized transit, non-motorized transit), then you can choose a tool (bus, car, bike, on foot).
While research methodologies can be split into three types, each type has many different nuanced methodologies that can be chosen, before you then choose the methods – or tools – to use in the study. Each has its own strengths and weaknesses, so choose wisely!
Altrichter, H., & Gstettner, P. (1993). Action Research: A closed chapter in the history of German social science? Educational Action Research , 1 (3), 329–360. https://doi.org/10.1080/0965079930010302
Audi, R. (1999). The Cambridge dictionary of philosophy . Cambridge ; New York : Cambridge University Press. http://archive.org/details/cambridgediction00audi
Clandinin, D. J., & Connelly, F. M. (2004). Narrative Inquiry: Experience and Story in Qualitative Research . John Wiley & Sons.
Creswell, J. W. (2008). Educational Research: Planning, Conducting, and Evaluating Quantitative and Qualitative Research . Pearson/Merrill Prentice Hall.
Faggiolani, C. (n.d.). Perceived Identity: Applying Grounded Theory in Libraries . https://doi.org/10.4403/jlis.it-4592
Gauch, H. G. (2002). Scientific Method in Practice . Cambridge University Press.
Glaser, B. G., & Strauss, A. L. (2009). The Discovery of Grounded Theory: Strategies for Qualitative Research . Transaction Publishers.
Kothari, C. R. (2004). Research Methodology: Methods and Techniques . New Age International.
Kuada, J. (2012). Research Methodology: A Project Guide for University Students . Samfundslitteratur.
Lewin, K. (1946). Action research and minority problems. Journal of Social Issues , 2, 4 , 34–46. https://doi.org/10.1111/j.1540-4560.1946.tb02295.x
Mills, J., Bonner, A., & Francis, K. (2006). The Development of Constructivist Grounded Theory. International Journal of Qualitative Methods , 5 (1), 25–35. https://doi.org/10.1177/160940690600500103
Mingers, J., & Willcocks, L. (2017). An integrative semiotic methodology for IS research. Information and Organization , 27 (1), 17–36. https://doi.org/10.1016/j.infoandorg.2016.12.001
OECD. (2015). Frascati Manual 2015: Guidelines for Collecting and Reporting Data on Research and Experimental Development . Organisation for Economic Co-operation and Development. https://www.oecd-ilibrary.org/science-and-technology/frascati-manual-2015_9789264239012-en
Peirce, C. S. (1992). The Essential Peirce, Volume 1: Selected Philosophical Writings (1867–1893) . Indiana University Press.
Reese, W. L. (1980). Dictionary of Philosophy and Religion: Eastern and Western Thought . Humanities Press.
Riessman, C. K. (1993). Narrative analysis . Sage Publications, Inc.
Saussure, F. de, & Riedlinger, A. (1959). Course in General Linguistics . Philosophical Library.
Thomas, C. G. (2021). Research Methodology and Scientific Writing . Springer Nature.
Zahavi, D., & Overgaard, S. (n.d.). Phenomenological Sociology—The Subjectivity of Everyday Life .

- Tio Gabunia (B.Arch, M.Arch) #molongui-disabled-link 6 Types of Societies (With 21 Examples)
- Tio Gabunia (B.Arch, M.Arch) #molongui-disabled-link 25 Public Health Policy Examples
- Tio Gabunia (B.Arch, M.Arch) #molongui-disabled-link 15 Cultural Differences Examples
- Tio Gabunia (B.Arch, M.Arch) #molongui-disabled-link Social Interaction Types & Examples (Sociology)

- Chris Drew (PhD) https://helpfulprofessor.com/author/chris-drew-phd-2/ 10 Reasons you’re Perpetually Single
- Chris Drew (PhD) https://helpfulprofessor.com/author/chris-drew-phd-2/ 20 Montessori Toddler Bedrooms (Design Inspiration)
- Chris Drew (PhD) https://helpfulprofessor.com/author/chris-drew-phd-2/ 21 Montessori Homeschool Setups
- Chris Drew (PhD) https://helpfulprofessor.com/author/chris-drew-phd-2/ 101 Hidden Talents Examples
Leave a Comment Cancel Reply
Your email address will not be published. Required fields are marked *
Have a language expert improve your writing
Run a free plagiarism check in 10 minutes, automatically generate references for free.
- Knowledge Base
- Dissertation
- What Is a Research Methodology? | Steps & Tips
What Is a Research Methodology? | Steps & Tips
Published on 25 February 2019 by Shona McCombes . Revised on 10 October 2022.
Your research methodology discusses and explains the data collection and analysis methods you used in your research. A key part of your thesis, dissertation, or research paper, the methodology chapter explains what you did and how you did it, allowing readers to evaluate the reliability and validity of your research.
It should include:
- The type of research you conducted
- How you collected and analysed your data
- Any tools or materials you used in the research
- Why you chose these methods
- Your methodology section should generally be written in the past tense .
- Academic style guides in your field may provide detailed guidelines on what to include for different types of studies.
- Your citation style might provide guidelines for your methodology section (e.g., an APA Style methods section ).
Instantly correct all language mistakes in your text
Be assured that you'll submit flawless writing. Upload your document to correct all your mistakes.

Table of contents
How to write a research methodology, why is a methods section important, step 1: explain your methodological approach, step 2: describe your data collection methods, step 3: describe your analysis method, step 4: evaluate and justify the methodological choices you made, tips for writing a strong methodology chapter, frequently asked questions about methodology.
Prevent plagiarism, run a free check.
Your methods section is your opportunity to share how you conducted your research and why you chose the methods you chose. It’s also the place to show that your research was rigorously conducted and can be replicated .
It gives your research legitimacy and situates it within your field, and also gives your readers a place to refer to if they have any questions or critiques in other sections.
You can start by introducing your overall approach to your research. You have two options here.
Option 1: Start with your “what”
What research problem or question did you investigate?
- Aim to describe the characteristics of something?
- Explore an under-researched topic?
- Establish a causal relationship?
And what type of data did you need to achieve this aim?
- Quantitative data , qualitative data , or a mix of both?
- Primary data collected yourself, or secondary data collected by someone else?
- Experimental data gathered by controlling and manipulating variables, or descriptive data gathered via observations?
Option 2: Start with your “why”
Depending on your discipline, you can also start with a discussion of the rationale and assumptions underpinning your methodology. In other words, why did you choose these methods for your study?
- Why is this the best way to answer your research question?
- Is this a standard methodology in your field, or does it require justification?
- Were there any ethical considerations involved in your choices?
- What are the criteria for validity and reliability in this type of research ?
Once you have introduced your reader to your methodological approach, you should share full details about your data collection methods .
Quantitative methods
In order to be considered generalisable, you should describe quantitative research methods in enough detail for another researcher to replicate your study.
Here, explain how you operationalised your concepts and measured your variables. Discuss your sampling method or inclusion/exclusion criteria, as well as any tools, procedures, and materials you used to gather your data.
Surveys Describe where, when, and how the survey was conducted.
- How did you design the questionnaire?
- What form did your questions take (e.g., multiple choice, Likert scale )?
- Were your surveys conducted in-person or virtually?
- What sampling method did you use to select participants?
- What was your sample size and response rate?
Experiments Share full details of the tools, techniques, and procedures you used to conduct your experiment.
- How did you design the experiment ?
- How did you recruit participants?
- How did you manipulate and measure the variables ?
- What tools did you use?
Existing data Explain how you gathered and selected the material (such as datasets or archival data) that you used in your analysis.
- Where did you source the material?
- How was the data originally produced?
- What criteria did you use to select material (e.g., date range)?
The survey consisted of 5 multiple-choice questions and 10 questions measured on a 7-point Likert scale.
The goal was to collect survey responses from 350 customers visiting the fitness apparel company’s brick-and-mortar location in Boston on 4–8 July 2022, between 11:00 and 15:00.
Here, a customer was defined as a person who had purchased a product from the company on the day they took the survey. Participants were given 5 minutes to fill in the survey anonymously. In total, 408 customers responded, but not all surveys were fully completed. Due to this, 371 survey results were included in the analysis.
Qualitative methods
In qualitative research , methods are often more flexible and subjective. For this reason, it’s crucial to robustly explain the methodology choices you made.
Be sure to discuss the criteria you used to select your data, the context in which your research was conducted, and the role you played in collecting your data (e.g., were you an active participant, or a passive observer?)
Interviews or focus groups Describe where, when, and how the interviews were conducted.
- How did you find and select participants?
- How many participants took part?
- What form did the interviews take ( structured , semi-structured , or unstructured )?
- How long were the interviews?
- How were they recorded?
Participant observation Describe where, when, and how you conducted the observation or ethnography .
- What group or community did you observe? How long did you spend there?
- How did you gain access to this group? What role did you play in the community?
- How long did you spend conducting the research? Where was it located?
- How did you record your data (e.g., audiovisual recordings, note-taking)?
Existing data Explain how you selected case study materials for your analysis.
- What type of materials did you analyse?
- How did you select them?
In order to gain better insight into possibilities for future improvement of the fitness shop’s product range, semi-structured interviews were conducted with 8 returning customers.
Here, a returning customer was defined as someone who usually bought products at least twice a week from the store.
Surveys were used to select participants. Interviews were conducted in a small office next to the cash register and lasted approximately 20 minutes each. Answers were recorded by note-taking, and seven interviews were also filmed with consent. One interviewee preferred not to be filmed.
Mixed methods
Mixed methods research combines quantitative and qualitative approaches. If a standalone quantitative or qualitative study is insufficient to answer your research question, mixed methods may be a good fit for you.
Mixed methods are less common than standalone analyses, largely because they require a great deal of effort to pull off successfully. If you choose to pursue mixed methods, it’s especially important to robustly justify your methods here.
Next, you should indicate how you processed and analysed your data. Avoid going into too much detail: you should not start introducing or discussing any of your results at this stage.
In quantitative research , your analysis will be based on numbers. In your methods section, you can include:
- How you prepared the data before analysing it (e.g., checking for missing data , removing outliers , transforming variables)
- Which software you used (e.g., SPSS, Stata or R)
- Which statistical tests you used (e.g., two-tailed t test , simple linear regression )
In qualitative research, your analysis will be based on language, images, and observations (often involving some form of textual analysis ).
Specific methods might include:
- Content analysis : Categorising and discussing the meaning of words, phrases and sentences
- Thematic analysis : Coding and closely examining the data to identify broad themes and patterns
- Discourse analysis : Studying communication and meaning in relation to their social context
Mixed methods combine the above two research methods, integrating both qualitative and quantitative approaches into one coherent analytical process.
Above all, your methodology section should clearly make the case for why you chose the methods you did. This is especially true if you did not take the most standard approach to your topic. In this case, discuss why other methods were not suitable for your objectives, and show how this approach contributes new knowledge or understanding.
In any case, it should be overwhelmingly clear to your reader that you set yourself up for success in terms of your methodology’s design. Show how your methods should lead to results that are valid and reliable, while leaving the analysis of the meaning, importance, and relevance of your results for your discussion section .
- Quantitative: Lab-based experiments cannot always accurately simulate real-life situations and behaviours, but they are effective for testing causal relationships between variables .
- Qualitative: Unstructured interviews usually produce results that cannot be generalised beyond the sample group , but they provide a more in-depth understanding of participants’ perceptions, motivations, and emotions.
- Mixed methods: Despite issues systematically comparing differing types of data, a solely quantitative study would not sufficiently incorporate the lived experience of each participant, while a solely qualitative study would be insufficiently generalisable.
Remember that your aim is not just to describe your methods, but to show how and why you applied them. Again, it’s critical to demonstrate that your research was rigorously conducted and can be replicated.
1. Focus on your objectives and research questions
The methodology section should clearly show why your methods suit your objectives and convince the reader that you chose the best possible approach to answering your problem statement and research questions .
2. Cite relevant sources
Your methodology can be strengthened by referencing existing research in your field. This can help you to:
- Show that you followed established practice for your type of research
- Discuss how you decided on your approach by evaluating existing research
- Present a novel methodological approach to address a gap in the literature
3. Write for your audience
Consider how much information you need to give, and avoid getting too lengthy. If you are using methods that are standard for your discipline, you probably don’t need to give a lot of background or justification.
Regardless, your methodology should be a clear, well-structured text that makes an argument for your approach, not just a list of technical details and procedures.
Methodology refers to the overarching strategy and rationale of your research. Developing your methodology involves studying the research methods used in your field and the theories or principles that underpin them, in order to choose the approach that best matches your objectives.
Methods are the specific tools and procedures you use to collect and analyse data (e.g. interviews, experiments , surveys , statistical tests ).
In a dissertation or scientific paper, the methodology chapter or methods section comes after the introduction and before the results , discussion and conclusion .
Depending on the length and type of document, you might also include a literature review or theoretical framework before the methodology.
Quantitative research deals with numbers and statistics, while qualitative research deals with words and meanings.
Quantitative methods allow you to test a hypothesis by systematically collecting and analysing data, while qualitative methods allow you to explore ideas and experiences in depth.
A sample is a subset of individuals from a larger population. Sampling means selecting the group that you will actually collect data from in your research.
For example, if you are researching the opinions of students in your university, you could survey a sample of 100 students.
Statistical sampling allows you to test a hypothesis about the characteristics of a population. There are various sampling methods you can use to ensure that your sample is representative of the population as a whole.
Cite this Scribbr article
If you want to cite this source, you can copy and paste the citation or click the ‘Cite this Scribbr article’ button to automatically add the citation to our free Reference Generator.
McCombes, S. (2022, October 10). What Is a Research Methodology? | Steps & Tips. Scribbr. Retrieved 9 September 2024, from https://www.scribbr.co.uk/thesis-dissertation/methodology/
Is this article helpful?

Shona McCombes
Other students also liked, how to write a dissertation proposal | a step-by-step guide, what is a literature review | guide, template, & examples, what is a theoretical framework | a step-by-step guide.
What Is Research Methodology?

I f you’re new to formal academic research, it’s quite likely that you’re feeling a little overwhelmed by all the technical lingo that gets thrown around. And who could blame you – “research methodology”, “research methods”, “sampling strategies”… it all seems never-ending!
In this post, we’ll demystify the landscape with plain-language explanations and loads of examples (including easy-to-follow videos), so that you can approach your dissertation, thesis or research project with confidence. Let’s get started.
Research Methodology 101
- What exactly research methodology means
- What qualitative , quantitative and mixed methods are
- What sampling strategy is
- What data collection methods are
- What data analysis methods are
- How to choose your research methodology
- Example of a research methodology

What is research methodology?
Research methodology simply refers to the practical “how” of a research study. More specifically, it’s about how a researcher systematically designs a study to ensure valid and reliable results that address the research aims, objectives and research questions . Specifically, how the researcher went about deciding:
- What type of data to collect (e.g., qualitative or quantitative data )
- Who to collect it from (i.e., the sampling strategy )
- How to collect it (i.e., the data collection method )
- How to analyse it (i.e., the data analysis methods )
Within any formal piece of academic research (be it a dissertation, thesis or journal article), you’ll find a research methodology chapter or section which covers the aspects mentioned above. Importantly, a good methodology chapter explains not just what methodological choices were made, but also explains why they were made. In other words, the methodology chapter should justify the design choices, by showing that the chosen methods and techniques are the best fit for the research aims, objectives and research questions.
So, it’s the same as research design?
Not quite. As we mentioned, research methodology refers to the collection of practical decisions regarding what data you’ll collect, from who, how you’ll collect it and how you’ll analyse it. Research design, on the other hand, is more about the overall strategy you’ll adopt in your study. For example, whether you’ll use an experimental design in which you manipulate one variable while controlling others. You can learn more about research design and the various design types here .
Need a helping hand?
What are qualitative, quantitative and mixed-methods?
Qualitative, quantitative and mixed-methods are different types of methodological approaches, distinguished by their focus on words , numbers or both . This is a bit of an oversimplification, but its a good starting point for understanding.
Let’s take a closer look.
Qualitative research refers to research which focuses on collecting and analysing words (written or spoken) and textual or visual data, whereas quantitative research focuses on measurement and testing using numerical data . Qualitative analysis can also focus on other “softer” data points, such as body language or visual elements.
It’s quite common for a qualitative methodology to be used when the research aims and research questions are exploratory in nature. For example, a qualitative methodology might be used to understand peoples’ perceptions about an event that took place, or a political candidate running for president.
Contrasted to this, a quantitative methodology is typically used when the research aims and research questions are confirmatory in nature. For example, a quantitative methodology might be used to measure the relationship between two variables (e.g. personality type and likelihood to commit a crime) or to test a set of hypotheses .
As you’ve probably guessed, the mixed-method methodology attempts to combine the best of both qualitative and quantitative methodologies to integrate perspectives and create a rich picture. If you’d like to learn more about these three methodological approaches, be sure to watch our explainer video below.
What is sampling strategy?
Simply put, sampling is about deciding who (or where) you’re going to collect your data from . Why does this matter? Well, generally it’s not possible to collect data from every single person in your group of interest (this is called the “population”), so you’ll need to engage a smaller portion of that group that’s accessible and manageable (this is called the “sample”).
How you go about selecting the sample (i.e., your sampling strategy) will have a major impact on your study. There are many different sampling methods you can choose from, but the two overarching categories are probability sampling and non-probability sampling .
Probability sampling involves using a completely random sample from the group of people you’re interested in. This is comparable to throwing the names all potential participants into a hat, shaking it up, and picking out the “winners”. By using a completely random sample, you’ll minimise the risk of selection bias and the results of your study will be more generalisable to the entire population.
Non-probability sampling , on the other hand, doesn’t use a random sample . For example, it might involve using a convenience sample, which means you’d only interview or survey people that you have access to (perhaps your friends, family or work colleagues), rather than a truly random sample. With non-probability sampling, the results are typically not generalisable .
To learn more about sampling methods, be sure to check out the video below.
What are data collection methods?
As the name suggests, data collection methods simply refers to the way in which you go about collecting the data for your study. Some of the most common data collection methods include:
- Interviews (which can be unstructured, semi-structured or structured)
- Focus groups and group interviews
- Surveys (online or physical surveys)
- Observations (watching and recording activities)
- Biophysical measurements (e.g., blood pressure, heart rate, etc.)
- Documents and records (e.g., financial reports, court records, etc.)
The choice of which data collection method to use depends on your overall research aims and research questions , as well as practicalities and resource constraints. For example, if your research is exploratory in nature, qualitative methods such as interviews and focus groups would likely be a good fit. Conversely, if your research aims to measure specific variables or test hypotheses, large-scale surveys that produce large volumes of numerical data would likely be a better fit.
What are data analysis methods?
Data analysis methods refer to the methods and techniques that you’ll use to make sense of your data. These can be grouped according to whether the research is qualitative (words-based) or quantitative (numbers-based).
Popular data analysis methods in qualitative research include:
- Qualitative content analysis
- Thematic analysis
- Discourse analysis
- Narrative analysis
- Interpretative phenomenological analysis (IPA)
- Visual analysis (of photographs, videos, art, etc.)
Qualitative data analysis all begins with data coding , after which an analysis method is applied. In some cases, more than one analysis method is used, depending on the research aims and research questions . In the video below, we explore some common qualitative analysis methods, along with practical examples.
- Descriptive statistics (e.g. means, medians, modes )
- Inferential statistics (e.g. correlation, regression, structural equation modelling)
How do I choose a research methodology?
As you’ve probably picked up by now, your research aims and objectives have a major influence on the research methodology . So, the starting point for developing your research methodology is to take a step back and look at the big picture of your research, before you make methodology decisions. The first question you need to ask yourself is whether your research is exploratory or confirmatory in nature.
If your research aims and objectives are primarily exploratory in nature, your research will likely be qualitative and therefore you might consider qualitative data collection methods (e.g. interviews) and analysis methods (e.g. qualitative content analysis).
Conversely, if your research aims and objective are looking to measure or test something (i.e. they’re confirmatory), then your research will quite likely be quantitative in nature, and you might consider quantitative data collection methods (e.g. surveys) and analyses (e.g. statistical analysis).
Designing your research and working out your methodology is a large topic, which we cover extensively on the blog . For now, however, the key takeaway is that you should always start with your research aims, objectives and research questions (the golden thread). Every methodological choice you make needs align with those three components.
Example of a research methodology chapter
In the video below, we provide a detailed walkthrough of a research methodology from an actual dissertation, as well as an overview of our free methodology template .

Learn More About Methodology

Triangulation: The Ultimate Credibility Enhancer
Triangulation is one of the best ways to enhance the credibility of your research. Learn about the different options here.

Research Limitations 101: What You Need To Know
Learn everything you need to know about research limitations (AKA limitations of the study). Includes practical examples from real studies.

In Vivo Coding 101: Full Explainer With Examples
Learn about in vivo coding, a popular qualitative coding technique ideal for studies where the nuances of language are central to the aims.

Process Coding 101: Full Explainer With Examples
Learn about process coding, a popular qualitative coding technique ideal for studies exploring processes, actions and changes over time.

Qualitative Coding 101: Inductive, Deductive & Hybrid Coding
Inductive, Deductive & Abductive Coding Qualitative Coding Approaches Explained...
📄 FREE TEMPLATES
Research Topic Ideation
Proposal Writing
Literature Review
Methodology & Analysis
Academic Writing
Referencing & Citing
Apps, Tools & Tricks
The Grad Coach Podcast
199 Comments

Thank you for this simple yet comprehensive and easy to digest presentation. God Bless!

You’re most welcome, Leo. Best of luck with your research!

I found it very useful. many thanks

This is really directional. A make-easy research knowledge.

Thank you for this, I think will help my research proposal

Thanks for good interpretation,well understood.

Good morning sorry I want to the search topic

Thank u more

Thank you, your explanation is simple and very helpful.

Very educative a.nd exciting platform. A bigger thank you and I’ll like to always be with you

That’s the best analysis

So simple yet so insightful. Thank you.

This really easy to read as it is self-explanatory. Very much appreciated…

Thanks for this. It’s so helpful and explicit. For those elements highlighted in orange, they were good sources of referrals for concepts I didn’t understand. A million thanks for this.

Good morning, I have been reading your research lessons through out a period of times. They are important, impressive and clear. Want to subscribe and be and be active with you.

Thankyou So much Sir Derek…
Good morning thanks so much for the on line lectures am a student of university of Makeni.select a research topic and deliberate on it so that we’ll continue to understand more.sorry that’s a suggestion.

Beautiful presentation. I love it.

please provide a research mehodology example for zoology

It’s very educative and well explained

Thanks for the concise and informative data.

This is really good for students to be safe and well understand that research is all about

Thank you so much Derek sir🖤🙏🤗

Very simple and reliable

This is really helpful. Thanks alot. God bless you.

very useful, Thank you very much..

thanks a lot its really useful

in a nutshell..thank you!

Thanks for updating my understanding on this aspect of my Thesis writing.

thank you so much my through this video am competently going to do a good job my thesis

Thanks a lot. Very simple to understand. I appreciate 🙏

Very simple but yet insightful Thank you

This has been an eye opening experience. Thank you grad coach team.

Very useful message for research scholars

Really very helpful thank you

yes you are right and i’m left

Research methodology with a simplest way i have never seen before this article.

wow thank u so much
Good morning thanks so much for the on line lectures am a student of university of Makeni.select a research topic and deliberate on is so that we will continue to understand more.sorry that’s a suggestion.

Very precise and informative.

Thanks for simplifying these terms for us, really appreciate it.

Thanks this has really helped me. It is very easy to understand.

I found the notes and the presentation assisting and opening my understanding on research methodology

Good presentation

Im so glad you clarified my misconceptions. Im now ready to fry my onions. Thank you so much. God bless

Thank you a lot.

thanks for the easy way of learning and desirable presentation.

Thanks a lot. I am inspired

Well written

I am writing a APA Format paper . I using questionnaire with 120 STDs teacher for my participant. Can you write me mthology for this research. Send it through email sent. Just need a sample as an example please. My topic is ” impacts of overcrowding on students learning
Thanks for your comment.
We can’t write your methodology for you. If you’re looking for samples, you should be able to find some sample methodologies on Google. Alternatively, you can download some previous dissertations from a dissertation directory and have a look at the methodology chapters therein.
All the best with your research.

Thank you so much for this!! God Bless

Thank you. Explicit explanation

Thank you, Derek and Kerryn, for making this simple to understand. I’m currently at the inception stage of my research.

Thnks a lot , this was very usefull on my assignment

excellent explanation

I’m currently working on my master’s thesis, thanks for this! I’m certain that I will use Qualitative methodology.

Thanks a lot for this concise piece, it was quite relieving and helpful. God bless you BIG…

I am currently doing my dissertation proposal and I am sure that I will do quantitative research. Thank you very much it was extremely helpful.

Very interesting and informative yet I would like to know about examples of Research Questions as well, if possible.

I’m about to submit a research presentation, I have come to understand from your simplification on understanding research methodology. My research will be mixed methodology, qualitative as well as quantitative. So aim and objective of mixed method would be both exploratory and confirmatory. Thanks you very much for your guidance.

OMG thanks for that, you’re a life saver. You covered all the points I needed. Thank you so much ❤️ ❤️ ❤️

Thank you immensely for this simple, easy to comprehend explanation of data collection methods. I have been stuck here for months 😩. Glad I found your piece. Super insightful.

I’m going to write synopsis which will be quantitative research method and I don’t know how to frame my topic, can I kindly get some ideas..

Thanks for this, I was really struggling.
This was really informative I was struggling but this helped me.

Thanks a lot for this information, simple and straightforward. I’m a last year student from the University of South Africa UNISA South Africa.

its very much informative and understandable. I have enlightened.

An interesting nice exploration of a topic.

Thank you. Accurate and simple🥰

This article was really helpful, it helped me understanding the basic concepts of the topic Research Methodology. The examples were very clear, and easy to understand. I would like to visit this website again. Thank you so much for such a great explanation of the subject.

Thanks dude

Thank you Doctor Derek for this wonderful piece, please help to provide your details for reference purpose. God bless.

Many compliments to you

Great work , thank you very much for the simple explanation

Thank you. I had to give a presentation on this topic. I have looked everywhere on the internet but this is the best and simple explanation.

thank you, its very informative.

Well explained. Now I know my research methodology will be qualitative and exploratory. Thank you so much, keep up the good work

Well explained, thank you very much.

This is good explanation, I have understood the different methods of research. Thanks a lot.

Great work…very well explanation

Thanks Derek. Kerryn was just fantastic!
Great to hear that, Hyacinth. Best of luck with your research!

Its a good templates very attractive and important to PhD students and lectuter
Thanks for the feedback, Matobela. Good luck with your research methodology.

Thank you. This is really helpful.
You’re very welcome, Elie. Good luck with your research methodology.

Well explained thanks

This is a very helpful site especially for young researchers at college. It provides sufficient information to guide students and equip them with the necessary foundation to ask any other questions aimed at deepening their understanding.
Thanks for the kind words, Edward. Good luck with your research!

Thank you. I have learned a lot.
Great to hear that, Ngwisa. Good luck with your research methodology!

Thank you for keeping your presentation simples and short and covering key information for research methodology. My key takeaway: Start with defining your research objective the other will depend on the aims of your research question.

My name is Zanele I would like to be assisted with my research , and the topic is shortage of nursing staff globally want are the causes , effects on health, patients and community and also globally

Thanks for making it simple and clear. It greatly helped in understanding research methodology. Regards.

This is well simplified and straight to the point

Thank you Dr

I was given an assignment to research 2 publications and describe their research methodology? I don’t know how to start this task can someone help me?
Sure. You’re welcome to book an initial consultation with one of our Research Coaches to discuss how we can assist – https://gradcoach.com/book/new/ .

Thanks a lot I am relieved of a heavy burden.keep up with the good work

I’m very much grateful Dr Derek. I’m planning to pursue one of the careers that really needs one to be very much eager to know. There’s a lot of research to do and everything, but since I’ve gotten this information I will use it to the best of my potential.

Thank you so much, words are not enough to explain how helpful this session has been for me!

Thanks this has thought me alot.

Very concise and helpful. Thanks a lot

Thank Derek. This is very helpful. Your step by step explanation has made it easier for me to understand different concepts. Now i can get on with my research.

I wish i had come across this sooner. So simple but yet insightful

really nice explanation thank you so much

I’m so grateful finding this site, it’s really helpful…….every term well explained and provide accurate understanding especially to student going into an in-depth research for the very first time, even though my lecturer already explained this topic to the class, I think I got the clear and efficient explanation here, much thanks to the author.

It is very helpful material

I would like to be assisted with my research topic : Literature Review and research methodologies. My topic is : what is the relationship between unemployment and economic growth?

Its really nice and good for us.

THANKS SO MUCH FOR EXPLANATION, ITS VERY CLEAR TO ME WHAT I WILL BE DOING FROM NOW .GREAT READS.

Short but sweet.Thank you

Informative article. Thanks for your detailed information.

I’m currently working on my Ph.D. thesis. Thanks a lot, Derek and Kerryn, Well-organized sequences, facilitate the readers’ following.

great article for someone who does not have any background can even understand

I am a bit confused about research design and methodology. Are they the same? If not, what are the differences and how are they related?
Thanks in advance.

concise and informative.

Thank you very much

How can we site this article is Harvard style?

Very well written piece that afforded better understanding of the concept. Thank you!

Am a new researcher trying to learn how best to write a research proposal. I find your article spot on and want to download the free template but finding difficulties. Can u kindly send it to my email, the free download entitled, “Free Download: Research Proposal Template (with Examples)”.

Thank too much

Thank you very much for your comprehensive explanation about research methodology so I like to thank you again for giving us such great things.

Good very well explained.Thanks for sharing it.

Thank u sir, it is really a good guideline.

so helpful thank you very much.

Thanks for the video it was very explanatory and detailed, easy to comprehend and follow up. please, keep it up the good work

It was very helpful, a well-written document with precise information.

how do i reference this?

MLA Jansen, Derek, and Kerryn Warren. “What (Exactly) Is Research Methodology?” Grad Coach, June 2021, gradcoach.com/what-is-research-methodology/.
APA Jansen, D., & Warren, K. (2021, June). What (Exactly) Is Research Methodology? Grad Coach. https://gradcoach.com/what-is-research-methodology/

Your explanation is easily understood. Thank you

Very help article. Now I can go my methodology chapter in my thesis with ease

I feel guided ,Thank you

This simplification is very helpful. It is simple but very educative, thanks ever so much

The write up is informative and educative. It is an academic intellectual representation that every good researcher can find useful. Thanks

Wow, this is wonderful long live.

Nice initiative

thank you the video was helpful to me.

Thank you very much for your simple and clear explanations I’m really satisfied by the way you did it By now, I think I can realize a very good article by following your fastidious indications May God bless you

Thanks very much, it was very concise and informational for a beginner like me to gain an insight into what i am about to undertake. I really appreciate.

very informative sir, it is amazing to understand the meaning of question hidden behind that, and simple language is used other than legislature to understand easily. stay happy.

This one is really amazing. All content in your youtube channel is a very helpful guide for doing research. Thanks, GradCoach.

research methodologies

Please send me more information concerning dissertation research.

Nice piece of knowledge shared….. #Thump_UP

This is amazing, it has said it all. Thanks to Gradcoach

This is wonderful,very elaborate and clear.I hope to reach out for your assistance in my research very soon.

This is the answer I am searching about…
realy thanks a lot

Thank you very much for this awesome, to the point and inclusive article.

Thank you very much I need validity and reliability explanation I have exams

Thank you for a well explained piece. This will help me going forward.

Very simple and well detailed Many thanks

This is so very simple yet so very effective and comprehensive. An Excellent piece of work.

I wish I saw this earlier on! Great insights for a beginner(researcher) like me. Thanks a mil!

Thank you very much, for such a simplified, clear and practical step by step both for academic students and general research work. Holistic, effective to use and easy to read step by step. One can easily apply the steps in practical terms and produce a quality document/up-to standard
Thanks for simplifying these terms for us, really appreciated.

Thanks for a great work. well understood .

This was very helpful. It was simple but profound and very easy to understand. Thank you so much!

Great and amazing research guidelines. Best site for learning research

hello sir/ma’am, i didn’t find yet that what type of research methodology i am using. because i am writing my report on CSR and collect all my data from websites and articles so which type of methodology i should write in dissertation report. please help me. i am from India.

how does this really work?

perfect content, thanks a lot

As a researcher, I commend you for the detailed and simplified information on the topic in question. I would like to remain in touch for the sharing of research ideas on other topics. Thank you

Impressive. Thank you, Grad Coach 😍
Thank you Grad Coach for this piece of information. I have at least learned about the different types of research methodologies.

Very useful content with easy way

Thank you very much for the presentation. I am an MPH student with the Adventist University of Africa. I have successfully completed my theory and starting on my research this July. My topic is “Factors associated with Dental Caries in (one District) in Botswana. I need help on how to go about this quantitative research

I am so grateful to run across something that was sooo helpful. I have been on my doctorate journey for quite some time. Your breakdown on methodology helped me to refresh my intent. Thank you.

thanks so much for this good lecture. student from university of science and technology, Wudil. Kano Nigeria.

It’s profound easy to understand I appreciate

Thanks a lot for sharing superb information in a detailed but concise manner. It was really helpful and helped a lot in getting into my own research methodology.

Comment * thanks very much

This was sooo helpful for me thank you so much i didn’t even know what i had to write thank you!
You’re most welcome 🙂

Simple and good. Very much helpful. Thank you so much.

This is very good work. I have benefited.

Thank you so much for sharing

This is powerful thank you so much guys
I am nkasa lizwi doing my research proposal on honors with the university of Walter Sisulu Komani I m on part 3 now can you assist me.my topic is: transitional challenges faced by educators in intermediate phase in the Alfred Nzo District.

Appreciate the presentation. Very useful step-by-step guidelines to follow.

I appreciate sir

wow! This is super insightful for me. Thank you!

Indeed this material is very helpful! Kudos writers/authors.

I want to say thank you very much, I got a lot of info and knowledge. Be blessed.

I want present a seminar paper on Optimisation of Deep learning-based models on vulnerability detection in digital transactions.
Need assistance

Dear Sir, I want to be assisted on my research on Sanitation and Water management in emergencies areas.

I am deeply grateful for the knowledge gained. I will be getting in touch shortly as I want to be assisted in my ongoing research.

The information shared is informative, crisp and clear. Kudos Team! And thanks a lot!

hello i want to study

Hello!! Grad coach teams. I am extremely happy in your tutorial or consultation. i am really benefited all material and briefing. Thank you very much for your generous helps. Please keep it up. If you add in your briefing, references for further reading, it will be very nice.

All I have to say is, thank u gyz.

Good, l thanks

thank you, it is very useful
Trackbacks/Pingbacks
- What Is A Literature Review (In A Dissertation Or Thesis) - Grad Coach - […] the literature review is to inform the choice of methodology for your own research. As we’ve discussed on the Grad Coach blog,…
- Free Download: Research Proposal Template (With Examples) - Grad Coach - […] Research design (methodology) […]
- Dissertation vs Thesis: What's the difference? - Grad Coach - […] and thesis writing on a daily basis – everything from how to find a good research topic to which…
Submit a Comment Cancel reply
Your email address will not be published. Required fields are marked *
Save my name, email, and website in this browser for the next time I comment.
Submit Comment
- Print Friendly
What is Research Methodology? Definition, Types, and Examples

Research methodology 1,2 is a structured and scientific approach used to collect, analyze, and interpret quantitative or qualitative data to answer research questions or test hypotheses. A research methodology is like a plan for carrying out research and helps keep researchers on track by limiting the scope of the research. Several aspects must be considered before selecting an appropriate research methodology, such as research limitations and ethical concerns that may affect your research.
The research methodology section in a scientific paper describes the different methodological choices made, such as the data collection and analysis methods, and why these choices were selected. The reasons should explain why the methods chosen are the most appropriate to answer the research question. A good research methodology also helps ensure the reliability and validity of the research findings. There are three types of research methodology—quantitative, qualitative, and mixed-method, which can be chosen based on the research objectives.
What is research methodology ?
A research methodology describes the techniques and procedures used to identify and analyze information regarding a specific research topic. It is a process by which researchers design their study so that they can achieve their objectives using the selected research instruments. It includes all the important aspects of research, including research design, data collection methods, data analysis methods, and the overall framework within which the research is conducted. While these points can help you understand what is research methodology, you also need to know why it is important to pick the right methodology.

Having a good research methodology in place has the following advantages: 3
- Helps other researchers who may want to replicate your research; the explanations will be of benefit to them.
- You can easily answer any questions about your research if they arise at a later stage.
- A research methodology provides a framework and guidelines for researchers to clearly define research questions, hypotheses, and objectives.
- It helps researchers identify the most appropriate research design, sampling technique, and data collection and analysis methods.
- A sound research methodology helps researchers ensure that their findings are valid and reliable and free from biases and errors.
- It also helps ensure that ethical guidelines are followed while conducting research.
- A good research methodology helps researchers in planning their research efficiently, by ensuring optimum usage of their time and resources.
Writing the methods section of a research paper? Let Paperpal help you achieve perfection
Types of research methodology.
There are three types of research methodology based on the type of research and the data required. 1
- Quantitative research methodology focuses on measuring and testing numerical data. This approach is good for reaching a large number of people in a short amount of time. This type of research helps in testing the causal relationships between variables, making predictions, and generalizing results to wider populations.
- Qualitative research methodology examines the opinions, behaviors, and experiences of people. It collects and analyzes words and textual data. This research methodology requires fewer participants but is still more time consuming because the time spent per participant is quite large. This method is used in exploratory research where the research problem being investigated is not clearly defined.
- Mixed-method research methodology uses the characteristics of both quantitative and qualitative research methodologies in the same study. This method allows researchers to validate their findings, verify if the results observed using both methods are complementary, and explain any unexpected results obtained from one method by using the other method.
What are the types of sampling designs in research methodology?
Sampling 4 is an important part of a research methodology and involves selecting a representative sample of the population to conduct the study, making statistical inferences about them, and estimating the characteristics of the whole population based on these inferences. There are two types of sampling designs in research methodology—probability and nonprobability.
- Probability sampling
In this type of sampling design, a sample is chosen from a larger population using some form of random selection, that is, every member of the population has an equal chance of being selected. The different types of probability sampling are:
- Systematic —sample members are chosen at regular intervals. It requires selecting a starting point for the sample and sample size determination that can be repeated at regular intervals. This type of sampling method has a predefined range; hence, it is the least time consuming.
- Stratified —researchers divide the population into smaller groups that don’t overlap but represent the entire population. While sampling, these groups can be organized, and then a sample can be drawn from each group separately.
- Cluster —the population is divided into clusters based on demographic parameters like age, sex, location, etc.
- Convenience —selects participants who are most easily accessible to researchers due to geographical proximity, availability at a particular time, etc.
- Purposive —participants are selected at the researcher’s discretion. Researchers consider the purpose of the study and the understanding of the target audience.
- Snowball —already selected participants use their social networks to refer the researcher to other potential participants.
- Quota —while designing the study, the researchers decide how many people with which characteristics to include as participants. The characteristics help in choosing people most likely to provide insights into the subject.
What are data collection methods?
During research, data are collected using various methods depending on the research methodology being followed and the research methods being undertaken. Both qualitative and quantitative research have different data collection methods, as listed below.
Qualitative research 5
- One-on-one interviews: Helps the interviewers understand a respondent’s subjective opinion and experience pertaining to a specific topic or event
- Document study/literature review/record keeping: Researchers’ review of already existing written materials such as archives, annual reports, research articles, guidelines, policy documents, etc.
- Focus groups: Constructive discussions that usually include a small sample of about 6-10 people and a moderator, to understand the participants’ opinion on a given topic.
- Qualitative observation : Researchers collect data using their five senses (sight, smell, touch, taste, and hearing).
Quantitative research 6
- Sampling: The most common type is probability sampling.
- Interviews: Commonly telephonic or done in-person.
- Observations: Structured observations are most commonly used in quantitative research. In this method, researchers make observations about specific behaviors of individuals in a structured setting.
- Document review: Reviewing existing research or documents to collect evidence for supporting the research.
- Surveys and questionnaires. Surveys can be administered both online and offline depending on the requirement and sample size.
Let Paperpal help you write the perfect research methods section. Start now!
What are data analysis methods.
The data collected using the various methods for qualitative and quantitative research need to be analyzed to generate meaningful conclusions. These data analysis methods 7 also differ between quantitative and qualitative research.
Quantitative research involves a deductive method for data analysis where hypotheses are developed at the beginning of the research and precise measurement is required. The methods include statistical analysis applications to analyze numerical data and are grouped into two categories—descriptive and inferential.
Descriptive analysis is used to describe the basic features of different types of data to present it in a way that ensures the patterns become meaningful. The different types of descriptive analysis methods are:
- Measures of frequency (count, percent, frequency)
- Measures of central tendency (mean, median, mode)
- Measures of dispersion or variation (range, variance, standard deviation)
- Measure of position (percentile ranks, quartile ranks)
Inferential analysis is used to make predictions about a larger population based on the analysis of the data collected from a smaller population. This analysis is used to study the relationships between different variables. Some commonly used inferential data analysis methods are:
- Correlation: To understand the relationship between two or more variables.
- Cross-tabulation: Analyze the relationship between multiple variables.
- Regression analysis: Study the impact of independent variables on the dependent variable.
- Frequency tables: To understand the frequency of data.
- Analysis of variance: To test the degree to which two or more variables differ in an experiment.
Qualitative research involves an inductive method for data analysis where hypotheses are developed after data collection. The methods include:
- Content analysis: For analyzing documented information from text and images by determining the presence of certain words or concepts in texts.
- Narrative analysis: For analyzing content obtained from sources such as interviews, field observations, and surveys. The stories and opinions shared by people are used to answer research questions.
- Discourse analysis: For analyzing interactions with people considering the social context, that is, the lifestyle and environment, under which the interaction occurs.
- Grounded theory: Involves hypothesis creation by data collection and analysis to explain why a phenomenon occurred.
- Thematic analysis: To identify important themes or patterns in data and use these to address an issue.
How to choose a research methodology?
Here are some important factors to consider when choosing a research methodology: 8
- Research objectives, aims, and questions —these would help structure the research design.
- Review existing literature to identify any gaps in knowledge.
- Check the statistical requirements —if data-driven or statistical results are needed then quantitative research is the best. If the research questions can be answered based on people’s opinions and perceptions, then qualitative research is most suitable.
- Sample size —sample size can often determine the feasibility of a research methodology. For a large sample, less effort- and time-intensive methods are appropriate.
- Constraints —constraints of time, geography, and resources can help define the appropriate methodology.
Got writer’s block? Kickstart your research paper writing with Paperpal now!
How to write a research methodology .
A research methodology should include the following components: 3,9
- Research design —should be selected based on the research question and the data required. Common research designs include experimental, quasi-experimental, correlational, descriptive, and exploratory.
- Research method —this can be quantitative, qualitative, or mixed-method.
- Reason for selecting a specific methodology —explain why this methodology is the most suitable to answer your research problem.
- Research instruments —explain the research instruments you plan to use, mainly referring to the data collection methods such as interviews, surveys, etc. Here as well, a reason should be mentioned for selecting the particular instrument.
- Sampling —this involves selecting a representative subset of the population being studied.
- Data collection —involves gathering data using several data collection methods, such as surveys, interviews, etc.
- Data analysis —describe the data analysis methods you will use once you’ve collected the data.
- Research limitations —mention any limitations you foresee while conducting your research.
- Validity and reliability —validity helps identify the accuracy and truthfulness of the findings; reliability refers to the consistency and stability of the results over time and across different conditions.
- Ethical considerations —research should be conducted ethically. The considerations include obtaining consent from participants, maintaining confidentiality, and addressing conflicts of interest.
Streamline Your Research Paper Writing Process with Paperpal
The methods section is a critical part of the research papers, allowing researchers to use this to understand your findings and replicate your work when pursuing their own research. However, it is usually also the most difficult section to write. This is where Paperpal can help you overcome the writer’s block and create the first draft in minutes with Paperpal Copilot, its secure generative AI feature suite.
With Paperpal you can get research advice, write and refine your work, rephrase and verify the writing, and ensure submission readiness, all in one place. Here’s how you can use Paperpal to develop the first draft of your methods section.
- Generate an outline: Input some details about your research to instantly generate an outline for your methods section
- Develop the section: Use the outline and suggested sentence templates to expand your ideas and develop the first draft.
- P araph ras e and trim : Get clear, concise academic text with paraphrasing that conveys your work effectively and word reduction to fix redundancies.
- Choose the right words: Enhance text by choosing contextual synonyms based on how the words have been used in previously published work.
- Check and verify text : Make sure the generated text showcases your methods correctly, has all the right citations, and is original and authentic. .
You can repeat this process to develop each section of your research manuscript, including the title, abstract and keywords. Ready to write your research papers faster, better, and without the stress? Sign up for Paperpal and start writing today!
Frequently Asked Questions
Q1. What are the key components of research methodology?
A1. A good research methodology has the following key components:
- Research design
- Data collection procedures
- Data analysis methods
- Ethical considerations
Q2. Why is ethical consideration important in research methodology?
A2. Ethical consideration is important in research methodology to ensure the readers of the reliability and validity of the study. Researchers must clearly mention the ethical norms and standards followed during the conduct of the research and also mention if the research has been cleared by any institutional board. The following 10 points are the important principles related to ethical considerations: 10
- Participants should not be subjected to harm.
- Respect for the dignity of participants should be prioritized.
- Full consent should be obtained from participants before the study.
- Participants’ privacy should be ensured.
- Confidentiality of the research data should be ensured.
- Anonymity of individuals and organizations participating in the research should be maintained.
- The aims and objectives of the research should not be exaggerated.
- Affiliations, sources of funding, and any possible conflicts of interest should be declared.
- Communication in relation to the research should be honest and transparent.
- Misleading information and biased representation of primary data findings should be avoided.

Q3. What is the difference between methodology and method?
A3. Research methodology is different from a research method, although both terms are often confused. Research methods are the tools used to gather data, while the research methodology provides a framework for how research is planned, conducted, and analyzed. The latter guides researchers in making decisions about the most appropriate methods for their research. Research methods refer to the specific techniques, procedures, and tools used by researchers to collect, analyze, and interpret data, for instance surveys, questionnaires, interviews, etc.
Research methodology is, thus, an integral part of a research study. It helps ensure that you stay on track to meet your research objectives and answer your research questions using the most appropriate data collection and analysis tools based on your research design.
Accelerate your research paper writing with Paperpal. Try for free now!
- Research methodologies. Pfeiffer Library website. Accessed August 15, 2023. https://library.tiffin.edu/researchmethodologies/whatareresearchmethodologies
- Types of research methodology. Eduvoice website. Accessed August 16, 2023. https://eduvoice.in/types-research-methodology/
- The basics of research methodology: A key to quality research. Voxco. Accessed August 16, 2023. https://www.voxco.com/blog/what-is-research-methodology/
- Sampling methods: Types with examples. QuestionPro website. Accessed August 16, 2023. https://www.questionpro.com/blog/types-of-sampling-for-social-research/
- What is qualitative research? Methods, types, approaches, examples. Researcher.Life blog. Accessed August 15, 2023. https://researcher.life/blog/article/what-is-qualitative-research-methods-types-examples/
- What is quantitative research? Definition, methods, types, and examples. Researcher.Life blog. Accessed August 15, 2023. https://researcher.life/blog/article/what-is-quantitative-research-types-and-examples/
- Data analysis in research: Types & methods. QuestionPro website. Accessed August 16, 2023. https://www.questionpro.com/blog/data-analysis-in-research/#Data_analysis_in_qualitative_research
- Factors to consider while choosing the right research methodology. PhD Monster website. Accessed August 17, 2023. https://www.phdmonster.com/factors-to-consider-while-choosing-the-right-research-methodology/
- What is research methodology? Research and writing guides. Accessed August 14, 2023. https://paperpile.com/g/what-is-research-methodology/
- Ethical considerations. Business research methodology website. Accessed August 17, 2023. https://research-methodology.net/research-methodology/ethical-considerations/
Paperpal is a comprehensive AI writing toolkit that helps students and researchers achieve 2x the writing in half the time. It leverages 21+ years of STM experience and insights from millions of research articles to provide in-depth academic writing, language editing, and submission readiness support to help you write better, faster.
Get accurate academic translations, rewriting support, grammar checks, vocabulary suggestions, and generative AI assistance that delivers human precision at machine speed. Try for free or upgrade to Paperpal Prime starting at US$19 a month to access premium features, including consistency, plagiarism, and 30+ submission readiness checks to help you succeed.
Experience the future of academic writing – Sign up to Paperpal and start writing for free!
Related Reads:
- Dangling Modifiers and How to Avoid Them in Your Writing
- Research Outlines: How to Write An Introduction Section in Minutes with Paperpal Copilot
- How to Paraphrase Research Papers Effectively
- What is a Literature Review? How to Write It (with Examples)
Language and Grammar Rules for Academic Writing
Climatic vs. climactic: difference and examples, you may also like, dissertation printing and binding | types & comparison , what is a dissertation preface definition and examples , how to write a research proposal: (with examples..., how to write your research paper in apa..., how to choose a dissertation topic, how to write a phd research proposal, how to write an academic paragraph (step-by-step guide), maintaining academic integrity with paperpal’s generative ai writing..., research funding basics: what should a grant proposal..., how to write an abstract in research papers....
Review Paper Format: How To Write A Review Article Fast
This guide aims to demystify the review paper format, presenting practical tips to help you accelerate the writing process.
From understanding the structure to synthesising literature effectively, we’ll explore how to create a compelling review article swiftly, ensuring your work is both impactful and timely.
Whether you’re a seasoned researcher or a budding scholar, these info on review paper format and style will streamline your writing journey.
Research Paper, Review Paper Format
| Parts | Notes |
|---|---|
| Title & Abstract | Sets the stage with a concise title and a descriptive abstract summarising the review’s scope and findings. |
| Introduction | Lays the groundwork by presenting the research question, justifying the review’s importance, and highlighting knowledge gaps. |
| Methodology | Details the research methods used to select, assess, and synthesise studies, showcasing the review’s rigor and integrity. |
| Body | The core section where literature is summarised, analysed, and critiqued, synthesising evidence and presenting arguments with well-structured paragraphs. |
| Discussion & Conclusion | Weaves together main points, reflects on the findings’ implications for the field, and suggests future research directions. |
| Citation | Acknowledges the scholarly community’s contributions, linking to cited research and enriching the review’s academic discourse. |
What Is A Review Paper?
Diving into the realm of scholarly communication, you might have stumbled upon a research review article.
This unique genre serves to synthesise existing data, offering a panoramic view of the current state of knowledge on a particular topic.

Unlike a standard research article that presents original experiments, a review paper delves into published literature, aiming to:
- clarify, and
- evaluate previous findings.
Imagine you’re tasked to write a review article. The starting point is often a burning research question. Your mission? To scour various journals, piecing together a well-structured narrative that not only summarises key findings but also identifies gaps in existing literature.
This is where the magic of review writing shines – it’s about creating a roadmap for future research, highlighting areas ripe for exploration.
Review articles come in different flavours, with systematic reviews and meta-analyses being the gold standards. The methodology here is meticulous, with a clear protocol for selecting and evaluating studies.
This rigorous approach ensures that your review is more than just an overview; it’s a critical analysis that adds depth to the understanding of the subject.
Crafting a good review requires mastering the art of citation. Every claim or observation you make needs to be backed by relevant literature. This not only lends credibility to your work but also provides a treasure trove of information for readers eager to delve deeper.
Types Of Review Paper
Not all review articles are created equal. Each type has its methodology, purpose, and format, catering to different research needs and questions. Here’s a couple of types of review paper for you to look at:
Systematic Review Paper
First up is the systematic review, the crème de la crème of review types. It’s known for its rigorous methodology, involving a detailed plan for:
- identifying,
- selecting, and
- critically appraising relevant research.
The aim? To answer a specific research question. Systematic reviews often include meta-analyses , where data from multiple studies are statistically combined to provide more robust conclusions.
This review type is a cornerstone in evidence-based fields like healthcare.
Literature Review Paper
Then there’s the literature review, a broader type you might encounter.
Here, the goal is to give an overview of the main points and debates on a topic, without the stringent methodological framework of a systematic review.
Literature reviews are great for getting a grasp of the field and identifying where future research might head. Often reading literature review papers can help you to learn about a topic rather quickly.

Narrative Reviews
Narrative reviews allow for a more flexible approach. Authors of narrative reviews draw on existing literature to provide insights or critique a certain area of research.
This is generally done with a less formal structure than systematic reviews. This type is particularly useful for areas where it’s difficult to quantify findings across studies.
Scoping Reviews
Scoping reviews are gaining traction for their ability to map out the existing literature on a broad topic, identifying:
- key concepts,
- theories, and
Unlike systematic reviews, scoping reviews have a more exploratory approach, which can be particularly useful in emerging fields or for topics that haven’t been comprehensively reviewed before.
Each type of review serves a unique purpose and requires a specific skill set. Whether you’re looking to summarise existing findings, synthesise data for evidence-based practice, or explore new research territories, there’s a review type that fits the bill.
Knowing how to write, read, and interpret these reviews can significantly enhance your understanding of any research area.
What Are The Parts In A Review Paper
A review paper format has a pretty set structure, with minor changes here and there to suit the topic covered. The review paper format not only organises your thoughts but also guides your readers through the complexities of your topic.
Title & Abstract
Starting with the title and abstract, you set the stage. The title should be a concise indicator of the content, making it easier for others to quickly tell what your article content is about.
As for the abstract, it should act as a descriptive summary, offering a snapshot of your review’s scope and findings.
Introduction
The introduction lays the groundwork, presenting the research question that drives your review. It’s here you:
- justify the importance of your review,
- delineating the current state of knowledge and
- highlighting gaps.
This section aims to articulate the significance of the topic and your objective in exploring it.
Methodology
The methodology section is the backbone of systematic reviews and meta-analyses, detailing the research methods employed to select, assess, and synthesise studies.

This transparency allows readers to gauge the rigour and reproducibility of your review. It’s a testament to the integrity of your work, showing how you’ve minimised bias.
The heart of your review lies in the body, where you:
- analyse, and
- critique existing literature .
This is where you synthesise evidence, draw connections, and present both sides of any argument. Well-structured paragraphs and clear subheadings guide readers through your analysis, offering insights and fostering a deeper understanding of the subject.
Discussion & Conclusion
The discussion or conclusion section is where you weave together the main points, reflecting on what your findings mean for the field.
It’s about connecting the dots, offering a synthesis of evidence that answers your initial research question. This part often hints at future research directions, suggesting areas that need further exploration due to gaps in existing knowledge.
Review paper format usually includes the citation list – it is your nod to the scholarly community, acknowledging the contributions of others.
Each citation is a thread in the larger tapestry of academic discourse, enabling readers to delve deeper into the research that has shaped your review.
Tips To Write An Review Article Fast
Writing a review article quickly without sacrificing quality might seem like a tall order, but with the right approach, it’s entirely achievable.
Clearly Define Your Research Question
Clearly define your research question. A focused question not only narrows down the scope of your literature search but also keeps your review concise and on track.
By honing in on a specific aspect of a broader topic, you can avoid the common pitfall of becoming overwhelmed by the vast expanse of available literature. This specificity allows you to zero in on the most relevant studies, making your review more impactful.
Efficient Literature Searching
Utilise databases specific to your field and employ advanced search techniques like Boolean operators. This can drastically reduce the time you spend sifting through irrelevant articles.
Additionally, leveraging citation chains—looking at who has cited a pivotal paper in your area and who it cites—can uncover valuable sources you might otherwise miss.
Organise Your Findings Systematically
Developing a robust organisation strategy is key. As you gather sources, categorize them based on themes or methodologies.
This not only aids in structuring your review but also in identifying areas where research is lacking or abundant. Organize your findings based on the review paper format.
Tools like citation management software can be invaluable here, helping you keep track of your sources and their key points. We list out some of the best AI tools for academic research here.

Build An Outline Before Writing
Don’t underestimate the power of a well-structured outline. A clear blueprint of your article can guide your writing process, ensuring that each section flows logically into the next.
This roadmap not only speeds up the writing process by providing a clear direction but also helps maintain coherence, ensuring your review article delivers a compelling narrative that advances understanding in your field.
Start Writing With The Easiest Sections
When it’s time to write, start with sections you find easiest. This might be the methodology or a particular thematic section where you feel most confident.
Getting words on the page can build momentum, making it easier to tackle more challenging sections later.
Remember, your first draft doesn’t have to be perfect; the goal is to start articulating your synthesis of the literature.
Learn How To Write An Article Review
Mastering the review paper format is a crucial step towards efficient academic writing. By adhering to the structured components outlined, you can streamline the creation of a compelling review article.
Embracing these guidelines not only speeds up the writing process but also enhances the clarity and impact of your work, ensuring your contributions to scholarly discourse are both valuable and timely.
A review paper serves to synthesise existing data, offering a panoramic view of the current state of knowledge on a particular topic
A Review Paper Format Usually Contains What Sections?
You usually will see sections like introduction, literature review, methodology, analysis and findings, discussions, citation and conclusion.
How To Write A Review Paper Fast?
The key is to organize, pre-plan things out before writing it.

Dr Andrew Stapleton has a Masters and PhD in Chemistry from the UK and Australia. He has many years of research experience and has worked as a Postdoctoral Fellow and Associate at a number of Universities. Although having secured funding for his own research, he left academia to help others with his YouTube channel all about the inner workings of academia and how to make it work for you.
Thank you for visiting Academia Insider.
We are here to help you navigate Academia as painlessly as possible. We are supported by our readers and by visiting you are helping us earn a small amount through ads and affiliate revenue - Thank you!
2024 © Academia Insider

- - Google Chrome
Intended for healthcare professionals
- My email alerts
- BMA member login
- Username * Password * Forgot your log in details? Need to activate BMA Member Log In Log in via OpenAthens Log in via your institution
Search form
- Advanced search
- Search responses
- Search blogs
- Developing clinical...
Developing clinical prediction models: a step-by-step guide
- Related content
- Peer review
- 1 Institute of Primary Health Care (BIHAM), University of Bern, Bern, Switzerland
- 2 Institute of Social and Preventive Medicine (ISPM), University of Bern, Bern, Switzerland
- 3 Department of Clinical Research, University of Bern, Bern, Switzerland
- 4 Smart Data Analysis and Statistics B V, Utrecht, The Netherlands
- 5 Population Health Sciences, Bristol Medical School, University of Bristol, Bristol, UK
- Correspondence to: O Efthimiou orestis.efthimiou{at}unibe.ch (or @oremiou on X)
- Accepted 12 June 2024
Predicting future outcomes of patients is essential to clinical practice, with many prediction models published each year. Empirical evidence suggests that published studies often have severe methodological limitations, which undermine their usefulness. This article presents a step-by-step guide to help researchers develop and evaluate a clinical prediction model. The guide covers best practices in defining the aim and users, selecting data sources, addressing missing data, exploring alternative modelling options, and assessing model performance. The steps are illustrated using an example from relapsing-remitting multiple sclerosis. Comprehensive R code is also provided.
Clinical prediction models aim to forecast future health outcomes given a set of baseline predictors to facilitate medical decision making and improve people’s health outcomes. 1 Prediction models are becoming increasingly popular, with many new ones published each year. For example, a review of prediction models identified 263 prediction models in obstetrics alone 2 ; another review found 606 models related to covid-19. 3 Interest in predicting health outcomes has been heightened by the increasing availability of big data, 4 which has also led to the uptake of machine learning methods for prognostic research in medicine. 5 6
Several resources are available to support prognostic research. The PROGRESS (prognosis research strategy) framework provides detailed guidance on different types of prognostic research. 7 8 9 The TRIPOD (transparent reporting of a multivariable prediction model for individual prognosis or diagnosis) statement gives recommendations for reporting and has recently been extended to address prediction model research in clustered datasets. 10 11 12 13 14 PROBAST (prediction model risk-of-bias assessment tool) provides a structured way to assess the risk of bias in a prediction modelling study. 15 Several papers further outline good practices and provide software code. 16 17 18
Despite these resources, published prediction modelling studies often have severe methodological limitations. For instance, a review of prediction models for cardiovascular disease identified 363 models 19 ; the authors concluded that “the usefulness of most of the models remains unclear owing to methodological shortcomings, incomplete presentation, and lack of external validation and model impact studies.” Another review of 308 prediction models in psychiatry found that most were at high risk of bias. 20 Many biases well known in clinical and epidemiological research also apply to prediction model studies, including inconsistent definitions and measurements of predictors and outcomes or lack of blinding. Some biases are particularly pertinent to prediction modelling; for example, overfitting—estimating many model parameters from few data points—can lead to overestimating the model's performance. 15
This article provides a step-by-step guide for researchers interested in clinical prediction modelling. Based on a scoping review of the literature and discussions in our group, we identified 13 steps. We aim to provide an overview to help numerically minded clinicians, clinical epidemiologists, and statisticians navigate the field. We introduce key concepts and provide references to further reading for each step. We discuss issues related to model inception, provide practical recommendations about selecting predictors, outline sample size considerations, cover aspects of model development, such as handling missing data and assessing performance, and discuss methods for evaluating the model’s clinical usefulness. The concepts we describe and the steps we propose largely apply to statistical and machine learning models. An appendix with code in R accompanies the paper. Although several issues discussed here are also relevant to diagnostic research 21 (which is related but has subtle differences with prediction modelling) and models on predicting treatment effects, 22 23 our focus is primarily on methods for predicting a future health outcome. We illustrate the proposed procedure using an example of a prediction model for relapse in relapsing-remitting multiple sclerosis. The glossary in table 1 summarises the essential concepts and terms used.
Glossary of key terms and concepts used in prediction modelling
- View inline
Summary points
Many prediction models are published each year, but they often have methodological shortcomings that limit their internal validity and applicability. A 13 step guide has been developed to help healthcare professionals and researchers develop and validate prediction models, avoiding common pitfalls
In the first step, the objective of the prediction model should be defined, including the target population, the outcome to be predicted, the healthcare setting where the model will be used, the intended users, and the decisions the model will inform
Prediction modelling requires a collaborative and interdisciplinary effort within a team that ideally includes clinicians with content expertise, methodologists, users, and people with lived experiences
Common pitfalls include inappropriate categorising of continuous outcomes or predictors, data driven cut-off points, univariable selection methods, overfitting, and lack of attention to missing data and a sound assessment of performance and clinical benefit
Step 1: Define aims, create a team, review literature, start writing a protocol
Defining aims.
We should start by clearly defining the purpose of the envisaged prediction model. In particular, it is important to clearly determine the following:
The target population—for whom should the model predict? For example, people with HIV in South Africa; people with a history of diabetes; postmenopausal women in western Europe.
The health outcome of interest—what is the endpoint that needs to be predicted? For example, AIDS, overall survival, progression free survival, a particular adverse event.
The healthcare setting—how will the model be used? For example, the model might be used in primary care or be implemented in a clinical decision support system in tertiary care.
The user—who is going to use the model? For example, primary care physicians, secondary care physicians, patients, researchers.
The clinical decisions that the model will inform—how will model predictions be used in the clinical decision making process? For example, a model might be used to identify patients for further diagnostic investigation, to decide on treatment strategies, or to inform a range of personal decisions. 24
Answers to these questions should guide the subsequent steps; they will inform various issues, such as what predictors to include in the model, what data to use for developing and validating the model, and how to assess its clinical usefulness.
Creating a team
When developing a prediction model for clinical use, assembling a group with expertise in the specific medical field, the statistical methodology, and the source data are highly advisable. Including users—that is, clinicians who might use the model and people with lived experiences—is also beneficial. Depending on the model's complexity, it might be necessary to involve software developers at later stages of the project; that is, developing a web application for users to make predictions.
Reviewing the literature
Identifying relevant published prediction models and studies on important risk factors is crucial and can be achieved through a scoping review. Discussing the review's findings with clinicians will help us to understand established predictors and the limitations of existing models. The literature review might also provide information on interactions between predictors, nonlinear associations between predictors and outcomes, reasons for missing data, and the expected distribution of predictors in the target population. In some situations, performing a systematic review might be helpful. Specific guidance on systematic reviews of prediction models has been published. 25 26 27
A study protocol should guide subsequent steps. The protocol can be made publicly available in an open access journal or as a preprint in an online repository (eg, www.medrxiv.org or https://osf.io/ ). In addition to the steps discussed here, the TRIPOD statement 10 14 and the PROBAST tool 15 might be helpful resources when writing the protocol.
Step 2: Choose between developing a new model or updating an existing one
Depending on the specific field, the literature review might show that relevant prediction models already exist. Suppose an existing model has a low risk of bias (according to PROBAST 15 ) and applies to the research question. In that case, assessing its validity for the intended setting might be more appropriate than developing a new model. This approach is known as external validation ( table 1 ). Depending on the validation results, we might decide to update and adapt the model to the population and setting of intended use. Common strategies for updating a prediction model include recalibration (eg, adjustment of the intercept term in a regression model), revision (ie, re-estimation of some model parameters), and extension (ie, addition of new predictors). 28 29 Although updating strategies have mainly been described for regression models, they can also be applied to machine learning. For example, a random forest model was used to predict whether patients with stroke would experience full recovery within 90 days of the event. When tested on an external dataset, the model needed recalibration, which was performed by fitting logistic regression models to the predictions from the random forest. 30 Prediction models for imaging data are often developed by fine tuning previously trained neural networks using a process known as transfer learning. 31
Further guidance on external validation and model updating is available elsewhere, 32 33 34 35 36 including sample size considerations for external validation. 37 In the following steps, we focus on developing a new model; we briefly revisit external validation in step 9.
Step 3: Define the outcome measure
An outcome can be defined and measured in many ways. For example, postoperative mortality can be measured as a binary outcome at 30 days, at 60 days, or using survival time. Using time-to-event instead of binary variables is good practice; a prediction model for time-to-event can better handle people who were followed up for a limited time and did not experience the outcome of interest. Moreover, time-to-event data provide richer information (eg, the survival probability at any time point) than a binary outcome at one time point only. Similarly, we can analyse a continuous health outcome using a continuous scale or after dichotomising or categorising. For example, a continuous depression score at week 8 after starting drug treatment could be dichotomised as remission or non-remission. Categorising a continuous outcome leads to loss of information. 38 39 40 Moreover, the selection of thresholds for categorisation is often arbitrary, lacking biological justification. In some cases, thresholds are chosen after exploring various cut-off points and opting for those that fit the data best or yield statistically significant results. This data driven approach could lead to reduced performance in new data. 38
Step 4: Identify candidate predictors and specify measurement methods
Candidate predictors.
We should identify potential predictors based on the literature review and expert knowledge (step 1). Like the outcomes of interest, they should ideally be objectively defined and measured using an established, reliable method. Understanding the biological pathways that might underpin associations between predictors and the outcome is key. Predictors with proven or suspected causal relationships with the outcome should be prioritised for inclusion; this approach might increase the model's generalisability. On the other hand, the absence of a causal relationship should not a priori exclude potential predictors. Predictors not causally related to the outcome but strongly associated with it might still contribute to model performance, although they might generalise less well to different settings than causal factors. Further, we must include only baseline predictors; that is, information available when making a prognosis. Dichotomising or categorising continuous predictors reduces information and diminishes statistical power and should be avoided. 41 42 Similarly to categorising outcomes, we advise against making data driven, post hoc decisions after testing several categorisation thresholds for predictors. In other words, we should not choose the categories of a continuous outcome based solely on the associated model performance.
Thinking about the user of the prediction model
It is crucial to consider the model's intended use (defined in step 1) and the availability of data. What variables are routinely measured in clinical practice and are available in the database? What are the costs and practical issues related to their measurement, including the degree of invasiveness? 43 For example, the veterans ageing cohort study index (VACS index 2.0) predicts all cause mortality in people with HIV. 44 However, some of its predictors, such as the liver fibrosis index (FIB-4), will not be available in routine practice in many settings with a high prevalence of HIV infection. Similarly, a systematic review of prognostic models for multiple sclerosis found that 44 of 75 models (59%) included predictors unlikely to be measured in primary care or standard hospital settings. 45
Step 5: Collect and examine data
Data collection.
Ideally, prediction models are developed using individual participant data from prospective cohort studies designed for this purpose. 1 In practice, developing prediction models using existing data from cohort studies or other data not collected explicitly for this purpose is much more common. Data from randomised clinical trials can also be used. The quality of trial data will generally be high, but models could have limited generalisability because trial participants might not represent the patients seen in clinical practice. For example, a study found only about 20% of people who have schizophrenia spectrum disorders would be eligible for inclusion in a typical randomised clinical trial. Patients who are ineligible had a higher risk of hospital admission with psychosis than those who are eligible. 46 Therefore, a prediction model based on trial data might underestimate the real world risk of hospital admissions. Registry data offer a simple, low cost alternative; their main advantage is the relatively large sample size and representativeness. However, drawbacks relate to data limitations such as inadequate data on relevant predictors or outcomes, and variability in the timing of measurements. 47
Data errors
Before fitting the model, addressing potential misclassification or measurement errors in predictors and outcomes is crucial. This involves considering the nature of the variables collected and the methods used for measurement or classification. For example, predictors such as physical activity or dietary intake are prone to various sources of measurement error. 48 The extent of these errors can vary across settings, for example, because of differences in the measurement method used. This means that the model's predictive performance and potential usefulness could be reduced. 49 If the risk of measurement error is considered high, we might consider alternative outcome measures or exclude less important, imprecisely measured predictors from the list created in step 4. In particular, if systematic errors in the dataset do not mirror those encountered in clinical practice, the model’s calibration might be poor. While methods for correcting measurement errors have been proposed, they typically require additional data and assumptions. 49
Variable distributions and missing data
After examining their distribution in the dataset, excluding predictors with limited variation is advisable because they will contribute little. For example, if the ages range from 25 to 45 years and the outcomes are not expected to change much within this range, we should remove age from the list of predictors. Similarly, a binary predictor might be present in only a few people. In such cases, we might consider removing it from the model unless there is previous evidence that this is a strong predictor. 47 More complications arise when a variable with low prevalence is known to have meaningful predictive value. For example, a rare genetic mutation could be strongly associated with the outcome. The mutation could be omitted from the model because its effect is difficult to estimate accurately. Alternatively, the few people with the mutation could be excluded, making the model applicable only to people without it. 47 Another issue is incomplete data on predictors and outcomes for some participants. Depending on the prevalence of missing data, we might want to modify the outcome or exclude certain candidate predictors. For example, we might omit a predictor with many missing values, especially if there is little evidence of its predictive power and imputing the missing data is challenging (step 7); that is, when the missing values cannot be reliably predicted using the observed data. Conversely, if the missing information can be imputed, we might decide to retain the variable, particularly when there is existing evidence that the predictor is important.
Step 6: Consider sample size
General considerations about sample size.
A very simple model or a model based on covariates that are not associated with the outcome will perform poorly in the data used to develop it and in new data; this scenario is called underfitting. Conversely, a model with too many predictors developed in a small dataset (overfitting) could perform well in this particular dataset but fail to predict accurately in new data. In practice, overfitting is more common than underfitting because datasets are often small and have few events, and there is the temptation to create models with the best (apparent) performance. Therefore, we must ensure the data are sufficient to develop a robust model that includes the relevant predictors.
Calculating sample size requirements for a specific model
Riley and colleagues 50 provide helpful guidance and code 51 52 on sample size calculations. Users need to specify the overall risk (for binary outcomes) or mean outcome value (for continuous outcomes) in the target population, the number of model parameters, and a measure of expected model performance (eg, the coefficient of determination, R 2 ). Note that the number of parameters can be larger than the number of predictors. For example, we need two parameters when using a restricted cubic spline with three knots to model a nonlinear association of age with the outcome. The sample size calculated this way is the minimum for a standard statistical model. The sample size must be several times larger if we want to use machine learning models. 53 Sample size calculations for such models are considerably more complex and might require simulations. 54
Calculating number of model parameters for fixed sample size
Suppose the sample size is fixed or based on an existing study, as is often the case. Then, we should perform sample size calculations to identify the maximum number of parameters we can include in the model. A structured way to guide model development can be summarised as follows:
Calculate the maximum number of parameters that can be included in the model given the available sample size.
Use the available parameters sequentially by including predictors from the list, starting from the ones that are perceived to be more important. 55
Note that additional parameters will be needed for including nonlinear terms or interactions among the predictors in the list.
Step 7: Deal with missing data
General considerations on missing data.
After removing predictors or outcomes with many missing values, as outlined in step 5, we might still need to address missing values in the retained data. Relying only on complete cases for model development—that is, participants with data for all variables—can dramatically reduce the sample size. To mitigate the loss of valuable information during model development and evaluation, researchers should consider imputing missing data.
Imputation of missing data
Multiple imputation is the approach usually recommended to handle missing data during model development, and appropriately accounts for missing data uncertainty. 56 Several versions of the original dataset are created, each with missing values imputed using an imputation model. The imputation model should be the same (in terms of predictors included, their transformations and interactions) as the final model we will use to make predictions. Additionally, the imputation model might involve auxiliary variables associated with missing data, which can enhance the effectiveness of the imputations. Once we have created the imputed datasets, we must decide whether to include participants with imputed outcomes in the model development. If no auxiliary variables were used in the imputations, people with imputed outcomes can be removed, and the model can be developed based only on people with observed outcomes. 57 However, if imputation incorporates auxiliary variables, including those with imputed outcomes in the model development is advisable. 58 A simpler alternative to multiple imputation is single imputation when each missing value is imputed only once using a regression model. Sisk and colleagues showed that single imputation can perform well, although multiple imputation tends to be more consistent and stable. 59
In step 4, we made the point that a model should include predictors that will be available in practice. However, we might want to make the model available even when some predictors are missing, for example, when using the model in a lower level of care. For example, the QRisk3 tool for predicting cardiovascular disease can be used even if the general practitioner does not enter information on blood pressure variability (the standard deviation of repeated readings). 60 When anticipating missing data during use in clinical practice, we can impute data during the development and implementation phases. In this case, single imputation can be used during model development and model use. 59
Ιmputation methods are not a panacea and might fail, typically when the tendency of the outcome to be missing correlates with the outcome itself. For example, patients receiving a new treatment might be more likely to miss follow-up visits if the treatment was successful, leading to missing data. Developing a prediction model in such cases requires additional modelling efforts 61 that are beyond the scope of this tutorial.
Step 8: Fit the prediction models
Modelling strategies.
The strategies for model development should be specified in the protocol (step 5). Linear regression for continuous outcomes, logistic regression for binary outcomes, and Cox or simple parametric models for survival outcomes are the usual starting points in modelling. If the sample size is large enough (see step 6), models can include nonlinear terms for continuous predictors or interactions between predictors. More advanced modelling strategies, such as machine learning models (eg, random forests, support vector machines, boosting methods, neural networks, etc), can also be used. 62 63 These strategies might add value if there are strong nonlinearities and interactions between predictors, although they are not immune to biases. 64 As discussed under step 10, a final strategy needs to be selected if several modelling strategies are explored.
Dealing with competing events
When predicting binary or time-to-event outcomes, we should consider whether there are relevant competing events. This situation occurs when several possible outcomes exist, but a person can only experience one event. For example, when predicting death from breast cancer, death from another cause is a competing event. In this case, and especially whenever competing events are common, we should use a competing risks model for the analysis, such as a cause specific Cox regression model. 65 A simpler approach would be to analyse a composite outcome.
Data driven variable selection methods
We advise against univariable selection methods—that is, methods that test each predictor separately and retain only statistically significant predictors. These methods do not consider the association between predictors and could lead to loss of valuable information. 55 66 Stepwise methods for variable selection (eg, forward, backwards, or bidirectional variable selection) are commonly used. Again, they are not recommended because they might lead to bias in estimation and worse predictive performance. 55 67 68 If variable selection is desirable—for instance, to simplify the implementation of the model by further reducing the number of predetermined predictors—more suitable methods can be used as described below.
Model estimation
Adding penalty terms to the model (a procedure called penalisation, regularisation, or shrinkage; see table 1 ) is recommended to control the complexity of the model and prevent overfitting. 69 70 71 Penalisation methods such as ridge, LASSO (least absolute shrinkage and selection operator), and elastic net generally lead to smaller absolute values of the coefficients—that is, they shrink coefficients towards zero—compared with maximum likelihood estimation. 72 LASSO and elastic net can be used for variable selection (similar to the methods described above). These models might exclude some predictors by setting their coefficients to zero, leading to a more interpretable and simpler model. Machine learning methods typically also have penalisation embedded. Penalisation is closely related to the bias-variance trade-off depicted in figure 1 , and is a method aiming to bring the model closer to the sweet spot of the bias-variance trade-off curve, where model performance in new data is maximised (note that the figure does not include a description of the double descent phenomenon). 73 Although penalisation methods have advantages, they do not solve all the problems associated with small sample sizes. While these methods typically are superior to standard estimation techniques, they can be unstable in small datasets. Moreover, their application does not ensure improved predictive performance. 74 75

Upper panel: graphical illustration of bias-variance trade-off. The training set is used to develop a model; the testing set is used to test it. A simple, underfitting model leads to high prediction error in training and testing sets. By increasing model complexity, the training set error can be lowered to zero. However, the testing set error (which needs to be minimised) only reduces to a point and then increases as complexity increases. The ideal model complexity is one that minimises the testing set error. An overfitting model might appear to perform well in the training set but might still be worthless—ie, overfitting leads to optimism. Lower three panels: fictional example of three prediction models (lines) developed using a dataset (points). x, y: single continuous predictor and outcome, respectively. The underfitting model has large training error and will also have large testing error; the overfitting model performs perfectly in the development set (ie, zero training error) but will perform poorly in new data (large testing error). The ideal model complexity will perform better than the other two in new data
- Download figure
- Open in new tab
- Download powerpoint
Treating multiply imputed data in model development
If multiple imputation was used, we must apply each modelling strategy to every imputed dataset. Consequently, if there are m imputed datasets, m different models will be developed for each modelling strategy. When predicting outcomes, these m models need to be combined. There are two methods to achieve this. The first method uses Rubin’s rule, 76 which is suitable for simple regression models. The estimated parameters from the m models are averaged, resulting in a final set of parameters, which can then be used to predict the outcome for a new person. However, this method is not straightforward for model selection strategies (eg, LASSO) because the m fitted models might have selected different sets of parameters. As a result, combining them becomes more complex. 77 78 Rubin’s rule might not apply to machine learning methods because the m models could have different architectures. Another method for combining the m models is to use them to make predictions for the new person and then average these m predictions, 79 a procedure conceptually similar to stacking in machine learning.
Step 9: Assess the performance of prediction models
General concepts in assessing model performance.
We assess the predictive performance of the modelling strategies explored in step 8. Specifically, we contrast predictions with observed outcomes for people in a dataset to calculate performance measures. For continuous outcomes like blood pressure this is straightforward: observed outcomes can be directly compared with predictions because they are on the same scale. When dealing with binary or survival outcomes, the situation becomes more complex. In these cases, prediction models might give the probability of an event occurring for each individual while observed outcomes are binary (event or no event) or involve time-to-event data with censoring. Consequently, more advanced methods are required.
Dimensions of prediction performance
Prediction performance has two dimensions, and it is essential to assess them both, particularly for binary and survival outcomes (see glossary in table 1 ).
Discrimination—for continuous outcomes, discrimination refers to the model’s ability to distinguish between patients with different outcomes: good discrimination means that patients with higher predicted values also had higher observed outcome values. For binary outcomes, good discrimination means that the model separates people at high risk from those at low risk. For time-to-event outcomes, discrimination refers to the ability of the model to rank patients according to their survival; that is, patients predicted to survive longer survived longer.
Calibration relates to the agreement between observed and predicted outcome values. 80 81 For continuous outcomes, good calibration means that predicted values do not systematically overestimate or underestimate observed values. For binary and survival outcomes, good calibration means the model does not overestimate or underestimate risks.
Discrimination and calibration are essential when evaluating prediction models. A model can have good discrimination by accurately distinguishing between risk levels, but still have poor calibration owing to a mismatch between predicted and observed probabilities. Moreover, a well calibrated model might have poor discrimination. Thus, a robust prediction model should have good discrimination and calibration. Box 1 outlines measures for assessing model performance.
Measures of performance of prediction models for different types of outcomes
Continuous outcomes.
Predicted and observed outcomes can be compared through mean bias, mean squared error, and the coefficient of determination, R 2 , to measure overall performance—ie, combining calibration and discrimination. For discrimination alone, rank correlation statistics between predictions and observations can be used, although this seldom occurs in practice. For calibration, results can be visualised in a scatterplot and an observed versus predicted line fitted. For a perfectly calibrated model, this line is on the diagonal; for an overfit (underfit) model, the calibration line is above (below) the diagonal. A smooth calibration line can assess calibration locally—ie, it can indicate areas where the model underestimates or overestimates the outcome. Smooth calibration lines can be obtained by fitting, for example, restricted cubic splines or a locally estimated scatterplot smoothing line (LOESS) of the predicted versus the observed outcomes.
Binary outcomes
Discrimination can be assessed using the area under the receiver operating characteristic curve (AUC). Mean calibration (calibration in the large, see table 1 ) can be determined by comparing mean observed versus mean predicted event rates. A logistic regression model can be fit to the observed outcome using the log odds of the event from the prediction model as the sole independent variable and then the intercept and slope can be evaluated. Additionally, a calibration curve can be created; for this, participants are grouped according to their predicted probabilities. Calculate the mean predicted probability and the proportion of events for each group; then compare the two in a scatterplot and draw a smooth calibration curve (eg, using splines) to assess calibration locally. The Brier score measures overall performance—it is simply calculated as the mean squared difference between predicted probabilities and actual outcomes. Many additional measures can be used to measure performance, for example, F score, sensitivity-specificity, etc.
Survival outcomes
If focus is on a specific time point, discrimination can be assessed as for binary outcomes (fixed time point discrimination). 18 However, censoring of follow-up times complicates this assessment. Uno and colleagues' inverse probability of censoring weights method can account for censoring. 82 Also, discrimination can be assessed across all time points using Harrell's c statistic. 83 Uno's c statistic can be expanded to a global measure, across all time points. 84 Calibration can be assessed for a fixed time point by comparing the average predicted survival from the model with the observed survival—ie, estimated while accounting for censorship; this can be obtained from a Kaplan-Meier curve by looking at the specific time point (calibration in the large at a fixed time). The Kaplan-Meier curve can be compared with the mean predicted survival across all times. More details can be found elsewhere. 18 Smooth calibration curves can also be used to assess performance of the model across the full range of predicted risks, while additional calibration metrics have also been proposed. 85 86 Similar measures can be used for competing events, with some adjustments. 16
Model validation
What data should we use to assess the performance of a prediction model? The simplest approach is to use the same dataset as for model development; this approach will return the so-called apparent model performance (apparent validation). However, this strategy might overestimate the model’s performance ( fig 1 ); that is, it might lead to erroneous (optimistic) assessments. Optimism is an important issue in prediction modelling and is particularly relevant when sample sizes are small and models complex. Therefore, assessing model performance using a more adequate validation procedure is crucial. Proper validation is essential in determining a prediction model’s generalisability—that is, its reproducibility and transportability. 33 47 Reproducibility refers to the model’s ability to produce accurate predictions in new patients from the same population. Transportability is the ability to produce accurate predictions in new patients drawn from a different but related population. Below, we describe different approaches to model validation.
Internal validation
Internal validation focuses on reproducibility and specifically aims to ensure that assessments of model performance using the development dataset are honest, meaning optimism does not influence them. In an internal validation procedure, we use data on the same patient population as the one used to develop the model and try to assess model performance while avoiding optimism. Validation must follow all steps of model development, including variable selection.
The simplest method is the split sample approach where the dataset is randomly split into two parts (eg, 70% training and 30% testing). However, this method is problematic because it wastes data and decreases statistical power. 55 87 When applied to a small dataset, it might create two datasets that are inadequate for both model development and evaluation. Conversely, for large datasets it offers little benefit because the risk of overfitting is low. Further, it might encourage researchers to repeat the procedure until they obtain satisfactory results. 88 Another approach is to split the data according to the calendar time of patient enrolment. For example, we might develop the model using data from an earlier period and test it in patients enrolled later. This procedure (temporal validation) 35 89 might inform us about possible time trends in model performance. However, the time point used for splitting the data will generally be arbitrary and older data might not reflect current patient characteristics or health care. Therefore, this approach is not recommended for the development phase. 88
A better method is k-fold cross validation. In this approach, we divide the data randomly in k (usually 10) subsets (folds). The model is built using k−1 of these folds and evaluated on the remaining one fold. This process is repeated, cycling through all the folds so that each can be the testing set. The model's performance is measured in each cycle, and the k estimates are then combined and summarised to get a final performance measure. Bootstrapping is another method, 90 which can be used to calculate optimism and optimism corrected performance measures for any model. Box 2 outlines the procedure. 47 Bootstrapping generally leads to more stable and less biased results, 93 and is therefore recommended for internal validation. 47 However, implementation of k-fold cross validation and bootstrapping can be computationally demanding when multiple imputation of missing data is needed. 88
Calculating optimism corrected measures of performance through bootstrapping
Use bootstrapping to correct apparent performance and obtain optimism corrected measures for any model M and any performance measure as follows.
Select a measure X (eg, R 2 , mean squared error, AUC (area under the receiver operating characteristic curve)) and calculate apparent performance (X 0 ) of model M in the original sample.
Create many (at least N B =100) bootstrap samples with the same size as the original dataset by drawing patients from the study population with replacement. Replacement means that some individuals might be included several times in a bootstrap sample, while others might not appear at all.
In each bootstrap sample i (i=1, 2 … N B ) construct model M i by exactly reiterating all steps of developing M, ie, including variable selection methods (if any were used). Determine the apparent performance X i of model M i in sample i.
Apply M i to the original sample and calculate performance, X i *. This performance will generally be worse than X i owing to optimism. Calculate optimism for measure X, sample i, as O i X =X i −X i *.
Average the N B different values of O i X to estimate optimism, O X .
Calculate the optimism corrected value of X as X corrected =X 0 −O i X .
More advanced versions of bootstrapping (eg, the 0.632+ bootstrap 91 ) require slightly different procedures. 92 In practice, we often need to combine bootstrapping with multiple imputation. Ideally, we should first bootstrap and then impute. 92 However, this strategy might be computationally difficult. Instead, we can first impute, then bootstrap, obtain optimism corrected performance measures from each imputed dataset, and finally pool these.
Another method of assessing whether a model’s predictions are likely to be reliable or not is by checking the model’s stability. Model instability means that small changes in the development dataset lead to large changes in the resulting model structure (important differences in estimates of model parameters, included predictors, etc), leading to important changes in predictions and model performance. Riley and Collins described how to assess the stability of clinical prediction models during the model development phase using a bootstrap approach. 94 The model building procedure is repeated in several bootstrap samples to create numerous models. Predictions from these models are then compared with the original model predictions to investigate possible instability.
Internal-external validation
An alternative approach is the internal-external or leave-one-out cross validation. This method involves partitioning the data into clusters based on a specific variable (eg, different studies, hospitals, general practices, countries) and then iteratively using one cluster as the test set while training the model on the remaining clusters. 95 96 Like in k-fold cross validation, this process is repeated for each cluster, and the performance results are summarised at the end. In contrast to k-fold cross validation, internal-external validation can provide valuable insights into how well the model generalises to new settings and populations because it accounts for heterogeneity across different clusters. For example, prediction models for patients with HIV were developed based on data from treatment programmes in Côte d’Ivoire, South Africa, and Malawi and validated using leave-one-country-out cross validation. 97
Note here that although all internal and internal-external validation methods include some form of data splitting, the final model should be developed using data from all patients. This strategy contrasts with the external validation method outlined below.
Εxternal validation
External validation requires testing the model on a new set of patients—that is, those not used for model development. 36 Assuming that the model has shown good internal validity, external validation studies are the next step in determining a model’s transportability before considering its implementation in clinical practice. The more numerous and diverse the settings in which the model is externally validated, the more likely it will generalise to a new setting. An external validation study could indicate that a model requires updating before being used in a new setting. A common scenario is when a model’s discrimination is adequate in new settings and fairly stable over time, but calibration is suboptimal across settings or deteriorates over time (calibration drift). 98 For example, EuroSCORE is a model developed in 1999 for predicting mortality in hospital for patients undergoing cardiac surgery. 99 Using data from 2001 to 2011, EuroSCORE was shown to consistently overestimate mortality and its calibration deteriorated over time. 100 In such situations, model updating (step 2) might be required.
The inclusion of external validation in model development is a topic of debate, with certain journals mandating it for publication. 88 100 One successful external validation, however, does not establish transportability to many other settings, while such a requirement might lead to the selective reporting of validation data. 100 Therefore, our view (echoing recent recommendations 88 ) is that external validation studies should be separated from model development at the moment of model development. External validation studies are ideally performed by independent investigators who were not involved in the original model development. 101 For guidance on methods for external validation, see references cited in step 2.
Step 10: Decide on the final model
Now it is time to choose the final model based on the internal and internal-external validation performance metrics (and possibly on stability assessments). If different modelling strategies perform similarly, we might want to select the simpler model (related to Occam’s razor principle 102 ). For example, logistic regression performed similarly to optimised machine learning models for discriminating between type 1 and type 2 diabetes in young adults. 103 In this case, we would prefer the regression model because it is simpler and easier to communicate and use.
Step 11: Perform a decision curve analysis
A prediction model might strongly discriminate and be well calibrated, but its value depends on how we intend to use it in clinical practice. While an accurate prediction model can be valuable in counselling patients on likely outcomes, determining its utility in guiding decisions is less straightforward. Decision analysis methods can be used to assess whether a prediction model should be used in practice by incorporating and quantifying its clinical impact, considering the anticipated benefits, risks, and costs. 104 For example, the National Institute for Health and Care Excellence (NICE) in the UK recommends cholesterol lowering treatment if the predicted 10 year risk of myocardial infarction or stroke is 10% or higher (the cut-off threshold probability) based on the QRISK3 risk calculator. 60 105 The assumption is that the benefit of treating one patient who would experience a cardiovascular event over 10 years outweighs the harms and costs incurred by treating another nine people who will not benefit. In other words, the harm associated with not treating the one patient who would develop the event is assumed to be nine times greater than the consequences of treating a patient who does not need it.
Net benefit brings the benefits and harms of a decision strategy (eg, to decide for or against treatment based on a prediction model) on the same scale so they can be compared. 104 We can compute the net benefit of using the model at a particular cut-off threshold (eg, 10% risk for the case of QRISK3 risk calculator). The net benefit is calculated as the expected percentage of true positives minus the expected percentage of true negatives, multiplied by a weight determined by the chosen cut-off threshold. We obtain the decision curve by plotting the model's net benefit across a range of cut-off thresholds deemed clinically relevant. 106 107 We can compare the benefit of making decisions based on the model with alternative strategies, such as treating everyone or no one. We can also compare different models. The choice of decision threshold can be subjective, and the range of sensible thresholds will depend on the settings, conditions, available diagnostic tests or treatments, and patient preferences. The lower the threshold, the more unnecessary tests or interventions we are willing to accept. Of note, a decision curve analysis might indicate that a model is not useful in practice despite its excellent predictive ability.
There are several pitfalls in the interpretation of decision curves. 24 Most importantly, the decision curve cannot determine at what threshold probability the model should be used. Moreover, because the model’s predictive performance influences the decision curve, the decision curve can be affected by optimism. Therefore, a model’s good predictive performance (in internal validation and after correction for optimism) should be established before evaluating its clinical usefulness through a decision curve. Additionally, the curve can be obtained using a cross validation approach. 108 Vickers and colleagues provide a helpful step-by-step guide to interpreting decision curve analysis, and a website with a software tutorial and other resources. 107 The multiple sclerosis example below includes a decision curve analysis.
Step 12: Assess the predictive ability of individual predictors (optional step)
In prediction modelling, the primary focus is typically not on evaluating the importance of individual predictors; rather, the goal is to optimise the model’s overall predictive performance. Nevertheless, identifying influential predictors might be of interest, for example, when evaluating the potential inclusion of a new biomarker as a routine measurement. Also, some predictors might be modifiable, raising the possibility that they could play a part in prevention if their association with the outcome is causal. Therefore, as an additional, optional step, researchers might want to assess the predictive capacity of the included predictors.
Looking at estimated coefficients in (generalised) linear regression models is a simple way to assess the importance of different predictors. However, when the assumptions of linear regression are not met, for example, when there is collinearity, these estimates might be unreliable. However, note that multicollinearity does not threaten a model's predictive performance, just at the interpretation of the coefficients. Another method to assess the importance of a predictor, also applicable to machine learning models, is to fit the model with and without this predictor and note the reduction in model performance; omitting more important predictors will lead to a larger reduction in performance. More advanced methods include the permutation importance algorithm 109 and SHAP (Shapley additive explanations) 110 ; we do not discuss these here.
Regardless of the method we choose to assess predictor importance, we should be careful in our interpretations; associations seen in data might not reflect causal relationships (eg, see the “Table 2 fallacy” 111 ). A thorough causal inference analysis is needed to establish causal associations between predictors and outcomes. 112
Step 13: Write up and publish
Congratulations to us! We have developed a clinical prediction model! Now, it is time to write the paper and describe the process and results in detail. The TRIPOD reporting guideline and checklist 10 14 (or, for clustered datasets, TRIPOD cluster 13 ) should be used to ensure all important aspects are covered in the paper. If possible, the article should report the full model equation to allow reproducibility and independent external validation studies. Software code and, ideally, data should be made freely available. Further, we must ensure the model is accessible to the users we defined in step 1. Although this should be self-evident, in practice, there is often no way to use published models to make an actual prediction; for example, Reeve and colleagues found that 52% of published models for multiple sclerosis could not be used in practice because no model coefficients, tools, or instructions were provided. 45
The advantages and disadvantages of different approaches for making the model available to users, including score systems, graphical score charts, nomograms, and websites and smartphone applications have been reviewed elsewhere. 113 Simpler approaches are easier to use, for example, on ward rounds, but might require model simplification by removing some predictors or categorising continuous variables. Online calculators where users input predictor values (eg, a web application using Shiny in R) 114 can be based on the whole model without information loss. However, if publicly accessible, calculators might be misused by people for whom they are not intended, or if the model fails to show any clinical value (eg, in a subsequent external validation). Generally, the presentation and implementation should always be discussed with the users to match their needs (defined in step 1).
Example: relapsing-remitting multiple sclerosis
Multiple sclerosis is a chronic inflammatory disorder of the central nervous system with a highly variable clinical course. 115 Relapsing-remitting multiple sclerosis (RRMS), the most common form, is characterised by attacks of worsening neurological function (relapses) followed by periods of partial or complete recovery (remissions). 116 117 118 These fluctuations pose a major challenge in managing the disease. A predictive tool could inform treatment decisions. Below, we describe the development of a prediction model for RMMS. 119 We briefly outline the procedures followed in the context of our step-by-step guide. Details of the original analysis and results are provided elsewhere. 119
Step-by-step model development
The aim was to predict relapse within two years in patients with RRMS. Such a prediction can help treatment decisions; if the risk of relapsing is high, patients might consider intensifying treatment, for example, by taking more active disease modifying drugs, which might however have a higher risk of serious adverse events, or considering stem cell transplantation. A multidisciplinary team comprising clinicians, patients, epidemiologists, and statisticians was formed. A literature review identified several potential predictors for relapse in RRMS. Additionally, the review showed limitations of existing prediction models, including lack of internal validation, inadequate handling of missing data, and lack of assessment of clinical utility (step 1). These deficiencies compromised the reliability and applicability of existing models in clinical settings. Based on the review, it was decided to pursue the development of a new model, instead of updating an existing one (step 2). The authors chose the (binary) occurrence of at least one relapse within a two year period for people with RRMS (step 3) as the outcome measure.
The following predictors were used based on the literature review and expert opinion: age, expanded disability status scale score, previous treatment for multiple sclerosis, months since last relapse, sex, disease duration, number of previous relapses, and number of gadolinium enhanced lesions. The selection aimed to include relevant predictors while excluding those that are difficult to measure in clinical practice (step 4). The model was developed using data from the Swiss Multiple Sclerosis Cohort, 120 a prospective cohort study that closely monitors patients with RRMS. Data included a total of 1752 observations from 935 patients followed up every two years, with 302 events observed (step 5). Sample size calculations 50 indicated a minimum sample of 2082 patients, which is larger than the available sample, raising concerns about possible overfitting issues (step 6). Multiple imputations were used to impute missing covariate data. The authors expected no missing data when using the model in practice (step 7).
A Bayesian logistic mixed effects prediction model was developed, which accounted for several observations within patients. Regression coefficients were penalised through a Laplace prior distribution to address possible overfitting (step 8). Model calibration was examined in a calibration plot ( fig 2 , upper panel), and discrimination was assessed using the AUC (area under the receiver operating characteristic curve). Both assessments were corrected for optimism through a bootstrap validation procedure (described in box 2 ), with 500 bootstrap samples created for each imputed dataset. The optimism corrected calibration slope was 0.91, and the optimism corrected AUC was 0.65—this value corresponds to low to moderate discriminatory ability, comparable to or exceeding previous RRMS models (steps 9 and 10). A decision curve analysis was performed to assess the clinical utility of the model ( fig 2 , lower panel). The analysis indicated that deciding to intensify or not intensify the treatment using information from the model is preferable to simpler strategies—do not intensify treatment, and intensify treatment for all—for thresholds between 15% and 30%. Therefore, the model is useful to guide decisions in practice only if we value the avoidance of relapse 3.3–6.6 times more than the risks and inconveniences of more intensive treatments (step 11). Among the included predictors, younger age, higher expanded disability status scale scores, and shorter durations since the last relapse were associated with higher odds of experiencing a relapse in the next two years according to the estimated regression coefficients. However, none of the predictors were modifiable factors (step 13). The model was implemented in a freely available R-shiny 114 web application, where patients, doctors, and decision makers can estimate the probability of experiencing at least one relapse within the next two years ( https://cinema.ispm.unibe.ch/shinies/rrms/ ) . To enable reproducibility, all code was made publicly available at https://github.com/htx-r/Reproduce-results-from-papers/tree/master/PrognosticModelRRMS (step 13).

Results from a model predicting the probability of a patient with relapsing-remitting multiple sclerosis experiencing a relapse in the next two years. Figures adapted from Chalkou et al. 119 Upper panel: calibration plot. Solid blue line shows calibration using a LOESS (locally estimated scatterplot smoothing line), and shaded area shows 95% confidence intervals. Dotted blue line corresponds to perfect calibration. Maximum predicted probability was around 60% for this example. The model is well calibrated for predicted probabilities lower than 35%. Lower panel: decision curve analysis comparing net benefit of three strategies deciding on whether to intensify treatment in patients with relapsing-remitting multiple sclerosis (from no treatment to first line treatment, or from first line to second line treatment, etc). The strategies are to continue current treatment (do not intensify), to intensify treatment for all, or to intensify treatment according to predictions from model considering probability of experiencing a relapse in next two years—ie, if predicted probability is higher than a threshold (shown on x axis), then the treatment can be intensified
Our appendix is available online at https://github.com/esm-ispm-unibe-ch/R-guide-to-prediction-modelling , where we provide R code covering many aspects of the development of prediction models. The code uses simulated datasets and describes the case of continuous, binary, time-to-event, and competing risk outcomes. The code covers the following aspects: sample size calculations, multiple imputation, modelling nonlinear associations, assessing apparent model performance, performing internal validation using bootstrap, internal-external validation, and decision curve analysis. Readers should note that the appendix does not cover all possible modelling methods, models, and performance measures that can be used. Moreover, parts of the code are based on previous publications. 16 18 Additional code is provided elsewhere, for example, by Zhou and colleagues. 17
Conclusions
This tutorial provides a step-by-step guide to developing and validating clinical prediction models. We stress that this is not a complete and exhaustive guide, and it does not aim to replace existing resources. Our intention is to introduce essential aspects of clinical prediction modelling. Figure 3 provides an overview of the proposed steps.

Graphical overview of 13 proposed steps for developing a clinical prediction model. TRIPOD=transparent reporting of a multivariable prediction model for individual prognosis or diagnosis
In principle, most steps we have described apply to traditional statistical and machine learning approaches, 14 with some exceptions. For example, the structure of a machine learning model is often defined during model development and so will not be known a priori. Consequently, using the final model for multiple imputations, as we discussed in step 7, might not be possible. Further, bootstrapping, which we recommended as the method of choice for internal validation, might not be computationally feasible for some machine learning approaches. Moreover, some machine learning approaches might require additional development steps to ensure calibration. 94 121 122
We trust that our presentation of the key concepts and discussion of topics relevant to the development of clinical prediction models will help researchers to choose the most sensible approach for the problem at hand. Moreover, the paper will hopefully increase awareness among researchers of the need to work in diverse teams, including clinical experts, methodologists, and future model users. Similar to guidance on transparent reporting of research, adopting methodological guidance to improve the quality and relevance of clinical research is a responsibility shared by investigators, reviewers, journals, and funders. 123
Contributors: OE conceived the idea of the project and wrote the first draft of the manuscript. KC performed the analysis of the real example in relapsing-remitting multiple sclerosis. MS and OE prepared the online supplement. ME and GS contributed concepts and revised the manuscript. All authors contributed to the final manuscript. OE is the guarantor of the article. ME and GS contributed equally to the manuscript as last authors. The corresponding author attests that all listed authors meet authorship criteria and that no others meeting the criteria have been omitted.
Funding: OE and MS were supported by the Swiss National Science Foundation (SNSF Ambizione grant 180083). ME was supported by special project funding from the SNSF (grant 32FP30-189498) and funding from the National Institutes of Health (5U01-AI069924-05, R01 AI152772-01). KC and GS were supported by the HTx project, funded by the European Union's Horizon 2020 research and innovation programme, 825162. The funders had no role in considering the study design or in the collection, analysis, interpretation of data, writing of the report, or decision to submit the article for publication.
Competing interests: All authors have completed the ICMJE uniform disclosure form at www.icmje.org/disclosure-of-interest/ and declare support from the Swiss National Science Foundation, National Institutes of Health, and European Union's Horizon 2020 research and innovation programme for the submitted work; no financial relationships with any organisations that might have an interest in the submitted work in the previous three years; no other relationships or activities that could appear to have influenced the submitted work.
Provenance and peer review: Not commissioned; externally peer reviewed.
This is an Open Access article distributed in accordance with the terms of the Creative Commons Attribution (CC BY 4.0) license, which permits others to distribute, remix, adapt and build upon this work, for commercial use, provided the original work is properly cited. See: http://creativecommons.org/licenses/by/4.0/ .
- Moons KGM ,
- Royston P ,
- Vergouwe Y ,
- Grobbee DE ,
- Kleinrouweler CE ,
- Cheong-See FM ,
- Collins GS ,
- Wynants L ,
- Van Calster B ,
- Snell KIE ,
- Hemingway H ,
- PROGRESS Group
- Steyerberg EW ,
- van der Windt DA ,
- Hingorani AD ,
- Reitsma JB ,
- Altman DG ,
- Debray TPA ,
- PROBAST Group†
- van Geloven N ,
- Giardiello D ,
- Bonneville EF ,
- STRATOS initiative
- McLernon DJ ,
- topic groups 6 and 8 of the STRATOS Initiative
- Damen JAAG ,
- Meehan AJ ,
- van Smeden M ,
- Paulus JK ,
- van Klaveren D ,
- ↵ Vickers A. Statistical thinking—seven common errors in decision curve analysis, https://www.fharrell.com/post/edca/index.html (2023, accessed 24 August 2023).
- Damen JAA ,
- Binuya MAE ,
- Engelhardt EG ,
- Schmidt MK ,
- Steyerberg EW
- Hickey GL ,
- Dankowski T ,
- Kengne AP ,
- Ramspek CL ,
- Dekker FW ,
- Zoccali C ,
- van Diepen M
- Borsboom GJJM ,
- van Houwelingen HC ,
- Eijkemans MJ ,
- de Groot JA ,
- Fedorov V ,
- Mannino F ,
- Purgato M ,
- Teyhen DS ,
- Ogundimu EO ,
- Manach YL ,
- Leisman DE ,
- Harhay MO ,
- Lederer DJ ,
- Hernández-Favela CG ,
- Hernández-Ruiz VA ,
- Bello-Chavolla OY ,
- Taipale H ,
- Schneider-Thoma J ,
- Pinzón-Espinosa J ,
- Bennett DA ,
- Groenwold RHH
- ↵ Ensor J, Martin EC, Riley RD. pmsampsize: calculates the minimum sample size required for developing a multivariable prediction model, https://cran.r-project.org/package=pmsampsize 2021 (accessed 1 Feb 2022).
- van der Ploeg T ,
- Austin PC ,
- Infante G ,
- Sterne JAC ,
- Carlin JB ,
- Kontopantelis E ,
- Sperrin M ,
- Sullivan TR ,
- Salter AB ,
- Hippisley-Cox J ,
- Coupland C ,
- Hufstedler H ,
- Gustafson P ,
- Bärnighausen T ,
- De Jong VMT ,
- Lo Vercio L ,
- Bannister JJ ,
- Andaur Navarro CL ,
- Sauerbrei W ,
- Perperoglou A ,
- for TG2 of the STRATOS initiative
- Eijkemans MJC ,
- Habbema JDF
- Harrell FE Jr . ,
- Van Houwelingen JC
- Seaman SR ,
- Lipkovich I ,
- Dmitrienko A ,
- Nakkiran P ,
- De Cock B ,
- Martin GP ,
- Buxton OM ,
- Vickers AJ ,
- Topic Group ‘Evaluating diagnostic tests and prediction models’ of the STRATOS initiative
- Califf RM ,
- Pencina MJ ,
- D’Agostino RB ,
- Crowson CS ,
- Atkinson EJ ,
- Therneau TM
- van Klaveren D
- Koffijberg H ,
- Nieboer D ,
- ↵ Efron B, Tibshirani R. An Introduction to the Bootstrap . Chapman and Hall/CRC. Epub ahead of print 15 May 1994. doi: 10.1201/9780429246593 . OpenUrl CrossRef
- Tibshirani R
- Boulesteix A-L ,
- Thorand B ,
- van de Wiel MA
- Borsboom GJ ,
- Harrell FE Jr .
- Denaxas S ,
- IeDEA Southern Africa and West Africa
- Jenkins DA ,
- Nashef SA ,
- Gauducheau E ,
- Lemeshow S ,
- van Smeden M
- Siontis GCM ,
- Tzoulaki I ,
- Castaldi PJ ,
- Ioannidis JP
- Dennis JM ,
- ↵ Cardiovascular disease: risk assessment and reduction, including lipid modification . London: National Institute for Health and Care Excellence (NICE), https://www.ncbi.nlm.nih.gov/books/NBK554923/ 2023 (accessed 1 September 2023).
- van Calster B ,
- Cronin AM ,
- ↵ Lundberg S, Lee S-I. A unified approach to interpreting model predictions. Epub ahead of print 24 November 2017. doi: 10.48550/arXiv.1705.07874 . OpenUrl CrossRef
- Westreich D ,
- Greenland S
- Bonnett LJ ,
- ↵ Chang W, Cheng J, Allaire JJ, et al. shiny: Web Application Framework for R. R package version 1.8.0. https://cran.r-project.org/package=shiny 2021 (accessed 9 December 2021).
- McGinley MP ,
- Goldschmidt CH ,
- Rae-Grant AD
- Ghasemi N ,
- Goldenberg MM
- Crayton HJ ,
- Chalkou K ,
- Steyerberg E ,
- Bossuyt P ,
- Disanto G ,
- Benkert P ,
- Lorscheider J ,
- SMSC Scientific Board
- ↵ Park Y, Ho JC. CaliForest: Calibrated Random Forest for Health Data. Proc ACM Conf Health Inference Learn ( 2020 ) 2020: 40-50.
- Bartlett P ,
- Schölkopf B ,
- Schuurmans D
Have a language expert improve your writing
Run a free plagiarism check in 10 minutes, generate accurate citations for free.
- Knowledge Base
Methodology
- How to Write a Literature Review | Guide, Examples, & Templates
How to Write a Literature Review | Guide, Examples, & Templates
Published on January 2, 2023 by Shona McCombes . Revised on September 11, 2023.
What is a literature review? A literature review is a survey of scholarly sources on a specific topic. It provides an overview of current knowledge, allowing you to identify relevant theories, methods, and gaps in the existing research that you can later apply to your paper, thesis, or dissertation topic .
There are five key steps to writing a literature review:
- Search for relevant literature
- Evaluate sources
- Identify themes, debates, and gaps
- Outline the structure
- Write your literature review
A good literature review doesn’t just summarize sources—it analyzes, synthesizes , and critically evaluates to give a clear picture of the state of knowledge on the subject.
Instantly correct all language mistakes in your text
Upload your document to correct all your mistakes in minutes
Table of contents
What is the purpose of a literature review, examples of literature reviews, step 1 – search for relevant literature, step 2 – evaluate and select sources, step 3 – identify themes, debates, and gaps, step 4 – outline your literature review’s structure, step 5 – write your literature review, free lecture slides, other interesting articles, frequently asked questions, introduction.
- Quick Run-through
- Step 1 & 2
When you write a thesis , dissertation , or research paper , you will likely have to conduct a literature review to situate your research within existing knowledge. The literature review gives you a chance to:
- Demonstrate your familiarity with the topic and its scholarly context
- Develop a theoretical framework and methodology for your research
- Position your work in relation to other researchers and theorists
- Show how your research addresses a gap or contributes to a debate
- Evaluate the current state of research and demonstrate your knowledge of the scholarly debates around your topic.
Writing literature reviews is a particularly important skill if you want to apply for graduate school or pursue a career in research. We’ve written a step-by-step guide that you can follow below.

Don't submit your assignments before you do this
The academic proofreading tool has been trained on 1000s of academic texts. Making it the most accurate and reliable proofreading tool for students. Free citation check included.

Try for free
Writing literature reviews can be quite challenging! A good starting point could be to look at some examples, depending on what kind of literature review you’d like to write.
- Example literature review #1: “Why Do People Migrate? A Review of the Theoretical Literature” ( Theoretical literature review about the development of economic migration theory from the 1950s to today.)
- Example literature review #2: “Literature review as a research methodology: An overview and guidelines” ( Methodological literature review about interdisciplinary knowledge acquisition and production.)
- Example literature review #3: “The Use of Technology in English Language Learning: A Literature Review” ( Thematic literature review about the effects of technology on language acquisition.)
- Example literature review #4: “Learners’ Listening Comprehension Difficulties in English Language Learning: A Literature Review” ( Chronological literature review about how the concept of listening skills has changed over time.)
You can also check out our templates with literature review examples and sample outlines at the links below.
Download Word doc Download Google doc
Before you begin searching for literature, you need a clearly defined topic .
If you are writing the literature review section of a dissertation or research paper, you will search for literature related to your research problem and questions .
Make a list of keywords
Start by creating a list of keywords related to your research question. Include each of the key concepts or variables you’re interested in, and list any synonyms and related terms. You can add to this list as you discover new keywords in the process of your literature search.
- Social media, Facebook, Instagram, Twitter, Snapchat, TikTok
- Body image, self-perception, self-esteem, mental health
- Generation Z, teenagers, adolescents, youth
Search for relevant sources
Use your keywords to begin searching for sources. Some useful databases to search for journals and articles include:
- Your university’s library catalogue
- Google Scholar
- Project Muse (humanities and social sciences)
- Medline (life sciences and biomedicine)
- EconLit (economics)
- Inspec (physics, engineering and computer science)
You can also use boolean operators to help narrow down your search.
Make sure to read the abstract to find out whether an article is relevant to your question. When you find a useful book or article, you can check the bibliography to find other relevant sources.
You likely won’t be able to read absolutely everything that has been written on your topic, so it will be necessary to evaluate which sources are most relevant to your research question.
For each publication, ask yourself:
- What question or problem is the author addressing?
- What are the key concepts and how are they defined?
- What are the key theories, models, and methods?
- Does the research use established frameworks or take an innovative approach?
- What are the results and conclusions of the study?
- How does the publication relate to other literature in the field? Does it confirm, add to, or challenge established knowledge?
- What are the strengths and weaknesses of the research?
Make sure the sources you use are credible , and make sure you read any landmark studies and major theories in your field of research.
You can use our template to summarize and evaluate sources you’re thinking about using. Click on either button below to download.
Take notes and cite your sources
As you read, you should also begin the writing process. Take notes that you can later incorporate into the text of your literature review.
It is important to keep track of your sources with citations to avoid plagiarism . It can be helpful to make an annotated bibliography , where you compile full citation information and write a paragraph of summary and analysis for each source. This helps you remember what you read and saves time later in the process.
To begin organizing your literature review’s argument and structure, be sure you understand the connections and relationships between the sources you’ve read. Based on your reading and notes, you can look for:
- Trends and patterns (in theory, method or results): do certain approaches become more or less popular over time?
- Themes: what questions or concepts recur across the literature?
- Debates, conflicts and contradictions: where do sources disagree?
- Pivotal publications: are there any influential theories or studies that changed the direction of the field?
- Gaps: what is missing from the literature? Are there weaknesses that need to be addressed?
This step will help you work out the structure of your literature review and (if applicable) show how your own research will contribute to existing knowledge.
- Most research has focused on young women.
- There is an increasing interest in the visual aspects of social media.
- But there is still a lack of robust research on highly visual platforms like Instagram and Snapchat—this is a gap that you could address in your own research.
There are various approaches to organizing the body of a literature review. Depending on the length of your literature review, you can combine several of these strategies (for example, your overall structure might be thematic, but each theme is discussed chronologically).
Chronological
The simplest approach is to trace the development of the topic over time. However, if you choose this strategy, be careful to avoid simply listing and summarizing sources in order.
Try to analyze patterns, turning points and key debates that have shaped the direction of the field. Give your interpretation of how and why certain developments occurred.
If you have found some recurring central themes, you can organize your literature review into subsections that address different aspects of the topic.
For example, if you are reviewing literature about inequalities in migrant health outcomes, key themes might include healthcare policy, language barriers, cultural attitudes, legal status, and economic access.
Methodological
If you draw your sources from different disciplines or fields that use a variety of research methods , you might want to compare the results and conclusions that emerge from different approaches. For example:
- Look at what results have emerged in qualitative versus quantitative research
- Discuss how the topic has been approached by empirical versus theoretical scholarship
- Divide the literature into sociological, historical, and cultural sources
Theoretical
A literature review is often the foundation for a theoretical framework . You can use it to discuss various theories, models, and definitions of key concepts.
You might argue for the relevance of a specific theoretical approach, or combine various theoretical concepts to create a framework for your research.
Like any other academic text , your literature review should have an introduction , a main body, and a conclusion . What you include in each depends on the objective of your literature review.
The introduction should clearly establish the focus and purpose of the literature review.
Depending on the length of your literature review, you might want to divide the body into subsections. You can use a subheading for each theme, time period, or methodological approach.
As you write, you can follow these tips:
- Summarize and synthesize: give an overview of the main points of each source and combine them into a coherent whole
- Analyze and interpret: don’t just paraphrase other researchers — add your own interpretations where possible, discussing the significance of findings in relation to the literature as a whole
- Critically evaluate: mention the strengths and weaknesses of your sources
- Write in well-structured paragraphs: use transition words and topic sentences to draw connections, comparisons and contrasts
In the conclusion, you should summarize the key findings you have taken from the literature and emphasize their significance.
When you’ve finished writing and revising your literature review, don’t forget to proofread thoroughly before submitting. Not a language expert? Check out Scribbr’s professional proofreading services !
This article has been adapted into lecture slides that you can use to teach your students about writing a literature review.
Scribbr slides are free to use, customize, and distribute for educational purposes.
Open Google Slides Download PowerPoint
If you want to know more about the research process , methodology , research bias , or statistics , make sure to check out some of our other articles with explanations and examples.
- Sampling methods
- Simple random sampling
- Stratified sampling
- Cluster sampling
- Likert scales
- Reproducibility
Statistics
- Null hypothesis
- Statistical power
- Probability distribution
- Effect size
- Poisson distribution
Research bias
- Optimism bias
- Cognitive bias
- Implicit bias
- Hawthorne effect
- Anchoring bias
- Explicit bias
A literature review is a survey of scholarly sources (such as books, journal articles, and theses) related to a specific topic or research question .
It is often written as part of a thesis, dissertation , or research paper , in order to situate your work in relation to existing knowledge.
There are several reasons to conduct a literature review at the beginning of a research project:
- To familiarize yourself with the current state of knowledge on your topic
- To ensure that you’re not just repeating what others have already done
- To identify gaps in knowledge and unresolved problems that your research can address
- To develop your theoretical framework and methodology
- To provide an overview of the key findings and debates on the topic
Writing the literature review shows your reader how your work relates to existing research and what new insights it will contribute.
The literature review usually comes near the beginning of your thesis or dissertation . After the introduction , it grounds your research in a scholarly field and leads directly to your theoretical framework or methodology .
A literature review is a survey of credible sources on a topic, often used in dissertations , theses, and research papers . Literature reviews give an overview of knowledge on a subject, helping you identify relevant theories and methods, as well as gaps in existing research. Literature reviews are set up similarly to other academic texts , with an introduction , a main body, and a conclusion .
An annotated bibliography is a list of source references that has a short description (called an annotation ) for each of the sources. It is often assigned as part of the research process for a paper .
Cite this Scribbr article
If you want to cite this source, you can copy and paste the citation or click the “Cite this Scribbr article” button to automatically add the citation to our free Citation Generator.
McCombes, S. (2023, September 11). How to Write a Literature Review | Guide, Examples, & Templates. Scribbr. Retrieved September 9, 2024, from https://www.scribbr.com/dissertation/literature-review/
Is this article helpful?
Shona McCombes
Other students also liked, what is a theoretical framework | guide to organizing, what is a research methodology | steps & tips, how to write a research proposal | examples & templates, "i thought ai proofreading was useless but..".
I've been using Scribbr for years now and I know it's a service that won't disappoint. It does a good job spotting mistakes”
How to write findings in a research paper
Skip to content Skip to navigation. Another technique you how to write findings in a research paper use to unlock your unconscious thought processes is freewriting. Step 5 : Review the finfings of your ifndings section and edit and revise until it reports your key findings exactly as you would apollo 13 movie review essay them presented to your readers. Data from multiple graphs can be placed into one figure to consolidate results. How to Write a Proper Report. Vieira, R. Examples Chemical Engineering PhD thesis: In this Chapter, all the experimental results from the phenomenological experiments outlined in Section 5. Now present the results that address this specific research question first. Freewriting on a topic means taking a fresh piece of paper or opening a new word-processor document and writing anything that comes into your head on that topic for a limited time. To start, organize your research data based on how important those are in relation to your research questions. There ar
- +44 (0) 207 391 9032
Recent Posts
Abstract vs. introduction: what’s the difference.
- How Do AI detectors Work? Breaking Down the Algorithm
What is a Literature Review? Definition, Types, and Examples
- Why Is Your CV Getting Rejected and How to Avoid It
- Where to Find Images for Presentations
- What Is an Internship? Everything You Should Know
- How Long Should a Thesis Statement Be?
- How to Write a Character Analysis Essay
- Best Colours for Your PowerPoint Presentation: Top Colour Combinations
- How to Write a Nursing Essay – With Examples
- Academic News
- Custom Essays
- Dissertation Writing
- Essay Marking
- Essay Writing
- Essay Writing Companies
- Model Essays
- Model Exam Answers
- Oxbridge Essays Updates
- PhD Writing
- Significant Academics
- Student News
- Study Skills
- University Applications
- University Essays
- University Life
- Writing Tips
Since 2006, Oxbridge Essays has been the UK’s leading paid essay-writing and dissertation service
We have helped 10,000s of undergraduate, Masters and PhD students to maximise their grades in essays, dissertations, model-exam answers, applications and other materials. If you would like a free chat about your project with one of our UK staff, then please just reach out on one of the methods below.
When writing a dissertation, there are two key sections that students often confuse: the abstract and the introduction. Both serve different purposes yet are essential components of the dissertation. This blog post aims to clarify the difference between the two, providing guidance on what an abstract is, the structure of a dissertation introduction, and tips on writing both effectively. Whether you’re looking at abstract examples in a dissertation or trying to formulate the perfect introduction, understanding these sections is crucial to delivering a well-rounded academic piece.
What is an Abstract?
An abstract is a concise summary of the entire dissertation. It provides an overview of the research, including the research question, methodology, key findings, and conclusions. An abstract is typically around 150-300 words, depending on your institution’s guidelines, and appears at the beginning of your dissertation before the introduction. Think of an abstract as a snapshot of your research, allowing readers to understand the scope and significance of your work without having to read the entire dissertation. In fact, most readers will first read the abstract to decide whether the rest of the dissertation is relevant to them.
The Purpose of an Abstract in a Dissertation
The purpose of the abstract is to summarise the key elements of your dissertation in a way that allows readers to quickly grasp its essence. In many cases, the abstract will be used in research databases and repositories, where scholars will search for relevant papers. Thus, your abstract needs to be clear, concise, and informative. an abstract serves several functions:
Provides a snapshot : The abstract gives a brief overview of your research, from your thesis statement to your findings and conclusions. Guides the reader : It helps readers decide whether to read the entire dissertation. If the abstract is well-written and concise , it will draw in your audience. Highlights relevance : A good abstract will highlight the significance of your research within your field of study.
Abstract Examples for a Dissertation
The structure of an abstract can vary depending on the type of dissertation, but typically, it includes the following components:
- Introduction :Briefly introduce the topic or problem that your research addresses.
- Research question or hypothesis : State the main question or hypothesis guiding your research.
- Methodology : Summarise the methods used to conduct your research.
- Key findings: : Highlight the main results or outcomes of your study.
- Conclusion Summarise the implications of your findings and their relevance to the field.
For instance, an abstract for a dissertation on climate change might look like this:
"This dissertation investigates the impact of climate change on agricultural productivity in sub-Saharan Africa. By analysing historical climate data and conducting interviews with local farmers, the study identifies a significant decline in crop yields over the past decade, particularly in maize and wheat production. The findings suggest that climate variability, coupled with inadequate irrigation systems, is the primary factor influencing the decline. This research contributes to the growing body of knowledge on climate resilience and offers policy recommendations for sustainable farming practices in the region."
Dissertation Introduction: Setting the Stage
The introduction of a dissertation serves a different purpose from the abstract. While the abstract provides a summary of the entire work, the introduction is more detailed and serves as a roadmap for the reader. It is where you set the stage for your research, offering context and a more in-depth explanation of your topic and objectives.
The Purpose of the Dissertation Introduction
The dissertation introduction is meant to engage the reader and provide a clear overview of your research. It typically includes:
Background information : This section offers context and background details about your research topic. It explains why your research is important and how it fits within the broader field of study. Research question or hypothesis : Clearly state your research question or hypothesis and explain its significance. Aims and objectives : Outline the goals of your research and what you aim to achieve through your study. Research approach : Provide a brief overview of your methodology and how you plan to address your research question. Significance of the research : Discuss the importance of your study and how it contributes to the field.
Writing a Dissertation Introduction: Key Elements
When writing a dissertation introduction, it’s important to be clear and focused. Here are some tips to keep in mind:
Start with a hook : Grab the reader’s attention with a compelling statement or an interesting fact related to your topic. Provide context : Offer background information that helps readers understand the significance of your research. Explain the problem or gap in the existing literature that your dissertation addresses. State your research question : Clearly articulate your research question or hypothesis and explain why it’s important to investigate. Define your objectives : List the main objectives of your research and what you aim to achieve. Outline your approach : Briefly describe your research methods and how they will help you answer your research question. Highlight the significance : Discuss the potential implications of your research and its contribution to the field.
The Difference Between an Abstract and an Introduction
To summarise, the key difference between an abstract and an introduction lies in their purpose and scope. The abstract is a brief summary of the entire dissertation, meant to give readers a quick overview of your research. In contrast, the introduction provides a more detailed explanation of the research topic, its context, and the objectives of your study.
Another key distinction is that while the abstract appears before the main body of the dissertation, the introduction is the first chapter of the dissertation itself. The abstract summarises everything, including the results and conclusions, while the introduction focuses on setting up the research and providing a rationale for why it’s important. In short, the abstract is about giving readers a snapshot, while the introduction is about engaging them in the research process.
Common Mistakes to Avoid
Here are some common mistakes to avoid when writing both the abstract and the introduction:
- Overloading the abstract with details: The abstract should be concise. Avoid including too much background information or too many specifics about your research.
- Being vague in the introduction: While the introduction should not be overly detailed, it should provide enough context to engage the reader and make them interested in your research.
- Repeating the same information: The introduction and abstract should complement each other, not repeat the same content. Ensure each section has its unique purpose and contributes to the dissertation as a whole.
Both the abstract and the introduction are vital components of your dissertation, each serving a unique purpose. Understanding the difference between abstract and introduction is crucial for crafting a dissertation that flows well and engages the reader.
Top 10 tips for writing a dissertation methodology
Advice for successfully writing a dissertation, writing services.
- Essay Plans
- Critical Reviews
- Literature Reviews
- Presentations
- Dissertation Title Creation
- Dissertation Proposals
- Dissertation Chapters
- PhD Proposals
- Journal Publication
- CV Writing Service
- Business Proofreading Services
Editing Services
- Proofreading Service
- Editing Service
- Academic Editing Service
Additional Services
- Marking Services
- Consultation Calls
- Personal Statements
- Tutoring Services
Our Company
- Frequently Asked Questions
- Become a Writer
Terms & Policies
- Fair Use Policy
- Policy for Students in England
- Privacy Policy
- Terms & Conditions
- Editing Service Examples
- [email protected]
- Contact Form
Payment Methods
Cryptocurrency payments.
A methodology providing new insights into the flow patterns of karst aquifers: an example from SW Türkiye
- Original Paper
- Published: 12 September 2024
- Volume 83 , article number 396 , ( 2024 )
Cite this article

- Athanasios Maramathas 1 ,
- Konstantina Katsanou ORCID: orcid.org/0000-0003-2880-6244 2 ,
- Çağdaş Sağır 3 ,
- Alper Baba 4 &
- Nikolaos Lambrakis 5
This paper presents a new and innovative methodology for the investigation of karst systems using spring discharge. The behaviour of springs in phase space is investigated by plotting the measurements of spring discharge versus the measurements of the water level at the spring’s outlet. Such a diagram reveals new features of the function of the karst system and the discharge pattern of the spring that are not captured by common research methods. The application of this method to the Azmak Spring in southwestern Türkiye revealed the existence of five distinct discharge subsystems that operate alternately and never simultaneously. They have a specific connection between them, while the transition from one to another is not random but follows a pattern. An attempt was made to interpret these features using concepts from percolation theory.
This is a preview of subscription content, log in via an institution to check access.
Access this article
Subscribe and save.
- Get 10 units per month
- Download Article/Chapter or eBook
- 1 Unit = 1 Article or 1 Chapter
- Cancel anytime
Price excludes VAT (USA) Tax calculation will be finalised during checkout.
Instant access to the full article PDF.
Rent this article via DeepDyve
Institutional subscriptions

Explore related subjects
- Geoengineering
Data availability
Available upon request.
Acikel S, Ekmekci M (2018) Assessment of groundwater quality using multivariate statistical techniques in the Azmak Spring Zone, Muğla, Turkey. Environ Earth Sci 77:753
Article Google Scholar
Acikel S, Ekmekci M (2021) Distinction of multiple groundwater systems in a coastal karst spring zone in SW Turkey by hydrochemical and isotopic characteristics. Bull Eng Geol Environ 80:5781–5795. https://doi.org/10.1007/s10064-021-02150-4
Bayari CS, Ozyurt NN, Oztan M et al (2011) Submarine and coastal karstic groundwater discharges along the southwestern Mediterranean coast of Turkey. Hydrogeol J 19, 399–414 (2011). https://doi.org/10.1007/s10040-010-0677-y
Berkovitz B (1993) Percolation theory and its application to groundwater hydrology. Water Resour Res 29:4
Google Scholar
Broadbent S, Hammersley J (1957) Percolation Processes I. Crystals and Mazes. Proceedings of the Cambridge Philosophical Society, 53, 629–641
Dewey JF, Sengör AC (1979) Aegean and surrounding regions: complex multiplate and continuum tectonics in a convergent zone. Geol Soc Am Bull 90(1):84–92
Doctor DH, Alexander EC Jr (2005) Interpretation of water chemistry and stable isotope data from a karst aquifer according to flow regimes identified through hydrograph recession analysis. US Geological Survey Karst Interest Group Proceedings, Rapid City, South Dakota, 82–92
Düztaş E, Kurtuluş B, Erdem G, Sağır C, Gürcan T, Avşar Ö, Regnier JL, Le Coz M, Razack M (2017) Electrical Resistivity Tomography (ERT) and Induced Polarization (IP) Applied to Karst Alluvium: Case Study from Azmak Spring, Mugla, Turkey. In Proceedings of the International Groundwater Conference
Ekmekci M (2003) Review of Turkish karst with emphasis on tectonic and paleogeographic controls. Acta Carstologica 32(2):205–218
Erdem G (2019) Assessment of Gökova karst aquifer system by hydrogeochemical and isotopic analysis. PhD Thesis, Muğla Sıtkı Koçman University, Muğla, Turkey
Fu T, Chen H, Wang K (2016) Structure and water storage capacity of a small karst aquifer based on stream discharge in southwest China. J Hydrol 534:50–62
Görür N, Sengör AMC, Sakinü M, Akkök R, Yiğitbaş E, Oktay FY, Barka A, Sarica N, Ecevitoğlu B, Demirbağ E, Ersoy Ş (1995) Rift formation in the Gökova region, southwest Anatolia: implications for the opening of the Aegean Sea. Geol Mag 132(6):637–650
Grimmett G (1999) Percolation Second edition. Springer-, New York
Günay G, Güner N, Törk K (2015) Turkish karst aquifers. Environ Earth Sci 74(1):217–226
Gürer ÖF, Sanğu E, Özburan M, Gürbüz A, Sarica-Filoreau N (2013) Complex basin evolution in the Gökova Gulf region: implications on the late cenozoic tectonics of southwest Turkey. Int J Earth Sci 102(8):2199–2221
Hendrick M, Renard P (2016a) Subnetworks of Percolation backbones to Model Karst systems around Tulum, Mexico. Front Phys 4:43. https://doi.org/10.3389/fphy.2016.00043
Hendrick M, Renard P (2016b) Fractal dimension, walk dimension and conductivity exponent of karst networks around Tulum. Front Phys 4(2):27. https://doi.org/10.3389/fphy.2016.00027
Hinrichsen H (2000) Non-equilibrium critical phenomena and phase transitions into absorbing states. Adv Phys. (2000) 49: 815–958. https://doi.org/10.1080/00018730050198152
Katsanou K, Maramathas A, Sağır Ç et al (2023) Determination of karst spring characteristics in complex geological setting using MODKARST model: Azmak Spring, SW Turkey. Arab J Geosci 16. https://doi.org/10.1007/s12517-022-11049-7
Kurttaş T, Günay G, Gemalmaz A (2022) Karst Hydrogeology of Muğla-Gökova Karst Springs. Caves and Karst of Turkey-volume 2. Springer, Cham, pp 93–96
Chapter Google Scholar
Kurtuluş B, Sağır Ç, Avşar Ö (2017) Assessment of Groundwater Metal-Metalloid Content using Geostatistical methods in Karabaglar Polje (Mugla, Turkey). Bull Mineral Res Explor 154(154):193–206
Malík P (2015) Evaluating discharge regimes of karst aquifer. Karst Aquifers—Characterization Eng, 205–249
Maramathas A, Boudouvis A (2005) Manifestation and measurement of the fractal characteristics of karst hydrogeological formations. Advances in Water Resources 2005.06.003
Maramathas A, Maroulis Z, Marinos-Kouris D (2003) A brackish karst springs model. Application Almiros Crete Greece Groundw 41(5):608–620. https://doi.org/10.1111/j.1745-6584.2003.tb02399.x
Article CAS Google Scholar
Moore PJ, Martin JB, Screaton EJ (2009) Geochemical and statistical evidence of recharge, mixing, and controls on spring discharge in an eogenetic karst aquifer. J Hydrol 376(3–4):443–455
Richeng Liu T, Zhu Y, Jiang B, Li L, Yu Y, Du Y, Wang (2019) A predictive model correlating permeability to two dimentional fracture networks parameters. Bull Eng Geol Environ 78:1589–1605
Sağır Ç, Kurtuluş B, Razack M (2019) Hydrodynamic characterization of Mugla Karst aquifer using correlation and spectral analyses on the rainfall and springs water-level time series. Water 12(1):85–105. https://doi.org/10.3390/w12010085
Sağır Ç, Kurtuluş B, Soupios P, Ayrancı K, Düztaş E, Aksoy ME, Avşar Ö, Erdem G, Pekkan E, Canoğlu MC, Kak SI, Razack M (2020) Investigating the structure of a Coastal Karstic Aquifer through the Hydrogeological characterization of Springs using Geophysical methods and Field Investigation, Gökova Bay, SW Turkey. Water 12(12):3343–3361. https://doi.org/10.3390/w12123343
Şener A, Yolcubal İ, Sangu E (2020) Determination of recharge, storage and flow characteristics of a karst aquifer using multi-method approaches (Kocaeli, Turkey). Hydrogeol J 28(6):2141–2157
Şengör AC (1984) The Cimmeride orogenic system and the tectonics of Eurasia
Şengör AC, Yilmaz Y (1981) Tethyan evolution of Turkey: a plate tectonic approach. Tectonophysics 75(3–4):181–241
Şengör AMC, Natal’In BA, Burtman VS (1993) Evolution of the Altaid tectonic collage and Palaeozoic crustal growth in Eurasia. Nature 364(6435):299–307
Worthington SRH, Foley AE (2021) Deriving celerity from monitoring data in carbonate aquifers. J Hydrol 598:126451. https://doi.org/10.1016/j.jhydrol.2021.126451
Yadav MP, Agarwal R, Purohit SD, Kumar D, Suthar DL (2022) Groundwater flow in karstic aquifer: analytic solution of dual-porosity fractional model to simulate groundwater flow. Appl Math Sci Eng 30(1):598–608. https://doi.org/10.1080/27690911.2022.2117913
Download references
Acknowledgements
The authors would like to thank Dr. Bedri Kurtuluş, Associate Professor at Muğla Sıtkı Koçman University for his contribution to this work. The authors would also like to express their gratitude to the editor and the two anonymous reviewers, whose constructive comments helped substantially to improve the current manuscript.
This work was not supported by any source.
Author information
Authors and affiliations.
School of Chemical Engineering, National Technical University of Athens, Athens, Greece
Athanasios Maramathas
Department of Water Resources and Ecosystems, IHE Delft Institute for Water Education, Delft, Netherlands
Konstantina Katsanou
Geological Engineering Department, Middle East Technical University, Ankara, Turkey
Çağdaş Sağır
Department of International Water Resources, İzmir Institute of Technology, İzmir, Turkey
Department of Geology, University of Patras, Rio, Greece
Nikolaos Lambrakis
You can also search for this author in PubMed Google Scholar
Corresponding author
Correspondence to Konstantina Katsanou .
Ethics declarations
Conflict of interest.
The authors declare that they have no known competing financial interests or personal relationships that could have appeared to influence the work reported in this paper.
Additional information
Publisher’s note.
Springer Nature remains neutral with regard to jurisdictional claims in published maps and institutional affiliations.
Rights and permissions
Reprints and permissions
About this article
Maramathas, A., Katsanou, K., Sağır, Ç. et al. A methodology providing new insights into the flow patterns of karst aquifers: an example from SW Türkiye. Bull Eng Geol Environ 83 , 396 (2024). https://doi.org/10.1007/s10064-024-03894-5
Download citation
Received : 12 December 2023
Accepted : 31 August 2024
Published : 12 September 2024
DOI : https://doi.org/10.1007/s10064-024-03894-5
Share this article
Anyone you share the following link with will be able to read this content:
Sorry, a shareable link is not currently available for this article.
Provided by the Springer Nature SharedIt content-sharing initiative
- Phase space
- Percolation theory
- Karst matrix
- Percolation backbone
- Find a journal
- Publish with us
- Track your research
Peer Reviewed
GPT-fabricated scientific papers on Google Scholar: Key features, spread, and implications for preempting evidence manipulation
Article metrics.
CrossRef Citations
Altmetric Score
PDF Downloads
Academic journals, archives, and repositories are seeing an increasing number of questionable research papers clearly produced using generative AI. They are often created with widely available, general-purpose AI applications, most likely ChatGPT, and mimic scientific writing. Google Scholar easily locates and lists these questionable papers alongside reputable, quality-controlled research. Our analysis of a selection of questionable GPT-fabricated scientific papers found in Google Scholar shows that many are about applied, often controversial topics susceptible to disinformation: the environment, health, and computing. The resulting enhanced potential for malicious manipulation of society’s evidence base, particularly in politically divisive domains, is a growing concern.
Swedish School of Library and Information Science, University of Borås, Sweden
Department of Arts and Cultural Sciences, Lund University, Sweden
Division of Environmental Communication, Swedish University of Agricultural Sciences, Sweden

Research Questions
- Where are questionable publications produced with generative pre-trained transformers (GPTs) that can be found via Google Scholar published or deposited?
- What are the main characteristics of these publications in relation to predominant subject categories?
- How are these publications spread in the research infrastructure for scholarly communication?
- How is the role of the scholarly communication infrastructure challenged in maintaining public trust in science and evidence through inappropriate use of generative AI?
research note Summary
- A sample of scientific papers with signs of GPT-use found on Google Scholar was retrieved, downloaded, and analyzed using a combination of qualitative coding and descriptive statistics. All papers contained at least one of two common phrases returned by conversational agents that use large language models (LLM) like OpenAI’s ChatGPT. Google Search was then used to determine the extent to which copies of questionable, GPT-fabricated papers were available in various repositories, archives, citation databases, and social media platforms.
- Roughly two-thirds of the retrieved papers were found to have been produced, at least in part, through undisclosed, potentially deceptive use of GPT. The majority (57%) of these questionable papers dealt with policy-relevant subjects (i.e., environment, health, computing), susceptible to influence operations. Most were available in several copies on different domains (e.g., social media, archives, and repositories).
- Two main risks arise from the increasingly common use of GPT to (mass-)produce fake, scientific publications. First, the abundance of fabricated “studies” seeping into all areas of the research infrastructure threatens to overwhelm the scholarly communication system and jeopardize the integrity of the scientific record. A second risk lies in the increased possibility that convincingly scientific-looking content was in fact deceitfully created with AI tools and is also optimized to be retrieved by publicly available academic search engines, particularly Google Scholar. However small, this possibility and awareness of it risks undermining the basis for trust in scientific knowledge and poses serious societal risks.
Implications
The use of ChatGPT to generate text for academic papers has raised concerns about research integrity. Discussion of this phenomenon is ongoing in editorials, commentaries, opinion pieces, and on social media (Bom, 2023; Stokel-Walker, 2024; Thorp, 2023). There are now several lists of papers suspected of GPT misuse, and new papers are constantly being added. 1 See for example Academ-AI, https://www.academ-ai.info/ , and Retraction Watch, https://retractionwatch.com/papers-and-peer-reviews-with-evidence-of-chatgpt-writing/ . While many legitimate uses of GPT for research and academic writing exist (Huang & Tan, 2023; Kitamura, 2023; Lund et al., 2023), its undeclared use—beyond proofreading—has potentially far-reaching implications for both science and society, but especially for their relationship. It, therefore, seems important to extend the discussion to one of the most accessible and well-known intermediaries between science, but also certain types of misinformation, and the public, namely Google Scholar, also in response to the legitimate concerns that the discussion of generative AI and misinformation needs to be more nuanced and empirically substantiated (Simon et al., 2023).
Google Scholar, https://scholar.google.com , is an easy-to-use academic search engine. It is available for free, and its index is extensive (Gusenbauer & Haddaway, 2020). It is also often touted as a credible source for academic literature and even recommended in library guides, by media and information literacy initiatives, and fact checkers (Tripodi et al., 2023). However, Google Scholar lacks the transparency and adherence to standards that usually characterize citation databases. Instead, Google Scholar uses automated crawlers, like Google’s web search engine (Martín-Martín et al., 2021), and the inclusion criteria are based on primarily technical standards, allowing any individual author—with or without scientific affiliation—to upload papers to be indexed (Google Scholar Help, n.d.). It has been shown that Google Scholar is susceptible to manipulation through citation exploits (Antkare, 2020) and by providing access to fake scientific papers (Dadkhah et al., 2017). A large part of Google Scholar’s index consists of publications from established scientific journals or other forms of quality-controlled, scholarly literature. However, the index also contains a large amount of gray literature, including student papers, working papers, reports, preprint servers, and academic networking sites, as well as material from so-called “questionable” academic journals, including paper mills. The search interface does not offer the possibility to filter the results meaningfully by material type, publication status, or form of quality control, such as limiting the search to peer-reviewed material.
To understand the occurrence of ChatGPT (co-)authored work in Google Scholar’s index, we scraped it for publications, including one of two common ChatGPT responses (see Appendix A) that we encountered on social media and in media reports (DeGeurin, 2024). The results of our descriptive statistical analyses showed that around 62% did not declare the use of GPTs. Most of these GPT-fabricated papers were found in non-indexed journals and working papers, but some cases included research published in mainstream scientific journals and conference proceedings. 2 Indexed journals mean scholarly journals indexed by abstract and citation databases such as Scopus and Web of Science, where the indexation implies journals with high scientific quality. Non-indexed journals are journals that fall outside of this indexation. More than half (57%) of these GPT-fabricated papers concerned policy-relevant subject areas susceptible to influence operations. To avoid increasing the visibility of these publications, we abstained from referencing them in this research note. However, we have made the data available in the Harvard Dataverse repository.
The publications were related to three issue areas—health (14.5%), environment (19.5%) and computing (23%)—with key terms such “healthcare,” “COVID-19,” or “infection”for health-related papers, and “analysis,” “sustainable,” and “global” for environment-related papers. In several cases, the papers had titles that strung together general keywords and buzzwords, thus alluding to very broad and current research. These terms included “biology,” “telehealth,” “climate policy,” “diversity,” and “disrupting,” to name just a few. While the study’s scope and design did not include a detailed analysis of which parts of the articles included fabricated text, our dataset did contain the surrounding sentences for each occurrence of the suspicious phrases that formed the basis for our search and subsequent selection. Based on that, we can say that the phrases occurred in most sections typically found in scientific publications, including the literature review, methods, conceptual and theoretical frameworks, background, motivation or societal relevance, and even discussion. This was confirmed during the joint coding, where we read and discussed all articles. It became clear that not just the text related to the telltale phrases was created by GPT, but that almost all articles in our sample of questionable articles likely contained traces of GPT-fabricated text everywhere.
Evidence hacking and backfiring effects
Generative pre-trained transformers (GPTs) can be used to produce texts that mimic scientific writing. These texts, when made available online—as we demonstrate—leak into the databases of academic search engines and other parts of the research infrastructure for scholarly communication. This development exacerbates problems that were already present with less sophisticated text generators (Antkare, 2020; Cabanac & Labbé, 2021). Yet, the public release of ChatGPT in 2022, together with the way Google Scholar works, has increased the likelihood of lay people (e.g., media, politicians, patients, students) coming across questionable (or even entirely GPT-fabricated) papers and other problematic research findings. Previous research has emphasized that the ability to determine the value and status of scientific publications for lay people is at stake when misleading articles are passed off as reputable (Haider & Åström, 2017) and that systematic literature reviews risk being compromised (Dadkhah et al., 2017). It has also been highlighted that Google Scholar, in particular, can be and has been exploited for manipulating the evidence base for politically charged issues and to fuel conspiracy narratives (Tripodi et al., 2023). Both concerns are likely to be magnified in the future, increasing the risk of what we suggest calling evidence hacking —the strategic and coordinated malicious manipulation of society’s evidence base.
The authority of quality-controlled research as evidence to support legislation, policy, politics, and other forms of decision-making is undermined by the presence of undeclared GPT-fabricated content in publications professing to be scientific. Due to the large number of archives, repositories, mirror sites, and shadow libraries to which they spread, there is a clear risk that GPT-fabricated, questionable papers will reach audiences even after a possible retraction. There are considerable technical difficulties involved in identifying and tracing computer-fabricated papers (Cabanac & Labbé, 2021; Dadkhah et al., 2023; Jones, 2024), not to mention preventing and curbing their spread and uptake.
However, as the rise of the so-called anti-vaxx movement during the COVID-19 pandemic and the ongoing obstruction and denial of climate change show, retracting erroneous publications often fuels conspiracies and increases the following of these movements rather than stopping them. To illustrate this mechanism, climate deniers frequently question established scientific consensus by pointing to other, supposedly scientific, studies that support their claims. Usually, these are poorly executed, not peer-reviewed, based on obsolete data, or even fraudulent (Dunlap & Brulle, 2020). A similar strategy is successful in the alternative epistemic world of the global anti-vaccination movement (Carrion, 2018) and the persistence of flawed and questionable publications in the scientific record already poses significant problems for health research, policy, and lawmakers, and thus for society as a whole (Littell et al., 2024). Considering that a person’s support for “doing your own research” is associated with increased mistrust in scientific institutions (Chinn & Hasell, 2023), it will be of utmost importance to anticipate and consider such backfiring effects already when designing a technical solution, when suggesting industry or legal regulation, and in the planning of educational measures.
Recommendations
Solutions should be based on simultaneous considerations of technical, educational, and regulatory approaches, as well as incentives, including social ones, across the entire research infrastructure. Paying attention to how these approaches and incentives relate to each other can help identify points and mechanisms for disruption. Recognizing fraudulent academic papers must happen alongside understanding how they reach their audiences and what reasons there might be for some of these papers successfully “sticking around.” A possible way to mitigate some of the risks associated with GPT-fabricated scholarly texts finding their way into academic search engine results would be to provide filtering options for facets such as indexed journals, gray literature, peer-review, and similar on the interface of publicly available academic search engines. Furthermore, evaluation tools for indexed journals 3 Such as LiU Journal CheckUp, https://ep.liu.se/JournalCheckup/default.aspx?lang=eng . could be integrated into the graphical user interfaces and the crawlers of these academic search engines. To enable accountability, it is important that the index (database) of such a search engine is populated according to criteria that are transparent, open to scrutiny, and appropriate to the workings of science and other forms of academic research. Moreover, considering that Google Scholar has no real competitor, there is a strong case for establishing a freely accessible, non-specialized academic search engine that is not run for commercial reasons but for reasons of public interest. Such measures, together with educational initiatives aimed particularly at policymakers, science communicators, journalists, and other media workers, will be crucial to reducing the possibilities for and effects of malicious manipulation or evidence hacking. It is important not to present this as a technical problem that exists only because of AI text generators but to relate it to the wider concerns in which it is embedded. These range from a largely dysfunctional scholarly publishing system (Haider & Åström, 2017) and academia’s “publish or perish” paradigm to Google’s near-monopoly and ideological battles over the control of information and ultimately knowledge. Any intervention is likely to have systemic effects; these effects need to be considered and assessed in advance and, ideally, followed up on.
Our study focused on a selection of papers that were easily recognizable as fraudulent. We used this relatively small sample as a magnifying glass to examine, delineate, and understand a problem that goes beyond the scope of the sample itself, which however points towards larger concerns that require further investigation. The work of ongoing whistleblowing initiatives 4 Such as Academ-AI, https://www.academ-ai.info/ , and Retraction Watch, https://retractionwatch.com/papers-and-peer-reviews-with-evidence-of-chatgpt-writing/ . , recent media reports of journal closures (Subbaraman, 2024), or GPT-related changes in word use and writing style (Cabanac et al., 2021; Stokel-Walker, 2024) suggest that we only see the tip of the iceberg. There are already more sophisticated cases (Dadkhah et al., 2023) as well as cases involving fabricated images (Gu et al., 2022). Our analysis shows that questionable and potentially manipulative GPT-fabricated papers permeate the research infrastructure and are likely to become a widespread phenomenon. Our findings underline that the risk of fake scientific papers being used to maliciously manipulate evidence (see Dadkhah et al., 2017) must be taken seriously. Manipulation may involve undeclared automatic summaries of texts, inclusion in literature reviews, explicit scientific claims, or the concealment of errors in studies so that they are difficult to detect in peer review. However, the mere possibility of these things happening is a significant risk in its own right that can be strategically exploited and will have ramifications for trust in and perception of science. Society’s methods of evaluating sources and the foundations of media and information literacy are under threat and public trust in science is at risk of further erosion, with far-reaching consequences for society in dealing with information disorders. To address this multifaceted problem, we first need to understand why it exists and proliferates.
Finding 1: 139 GPT-fabricated, questionable papers were found and listed as regular results on the Google Scholar results page. Non-indexed journals dominate.
Most questionable papers we found were in non-indexed journals or were working papers, but we did also find some in established journals, publications, conferences, and repositories. We found a total of 139 papers with a suspected deceptive use of ChatGPT or similar LLM applications (see Table 1). Out of these, 19 were in indexed journals, 89 were in non-indexed journals, 19 were student papers found in university databases, and 12 were working papers (mostly in preprint databases). Table 1 divides these papers into categories. Health and environment papers made up around 34% (47) of the sample. Of these, 66% were present in non-indexed journals.
| Indexed journals* | 5 | 3 | 4 | 7 | 19 |
| Non-indexed journals | 18 | 18 | 13 | 40 | 89 |
| Student papers | 4 | 3 | 1 | 11 | 19 |
| Working papers | 5 | 3 | 2 | 2 | 12 |
| Total | 32 | 27 | 20 | 60 | 139 |
Finding 2: GPT-fabricated, questionable papers are disseminated online, permeating the research infrastructure for scholarly communication, often in multiple copies. Applied topics with practical implications dominate.
The 20 papers concerning health-related issues are distributed across 20 unique domains, accounting for 46 URLs. The 27 papers dealing with environmental issues can be found across 26 unique domains, accounting for 56 URLs. Most of the identified papers exist in multiple copies and have already spread to several archives, repositories, and social media. It would be difficult, or impossible, to remove them from the scientific record.
As apparent from Table 2, GPT-fabricated, questionable papers are seeping into most parts of the online research infrastructure for scholarly communication. Platforms on which identified papers have appeared include ResearchGate, ORCiD, Journal of Population Therapeutics and Clinical Pharmacology (JPTCP), Easychair, Frontiers, the Institute of Electrical and Electronics Engineer (IEEE), and X/Twitter. Thus, even if they are retracted from their original source, it will prove very difficult to track, remove, or even just mark them up on other platforms. Moreover, unless regulated, Google Scholar will enable their continued and most likely unlabeled discoverability.
| Environment | researchgate.net (13) | orcid.org (4) | easychair.org (3) | ijope.com* (3) | publikasiindonesia.id (3) |
| Health | researchgate.net (15) | ieee.org (4) | twitter.com (3) | jptcp.com** (2) | frontiersin.org (2) |
A word rain visualization (Centre for Digital Humanities Uppsala, 2023), which combines word prominences through TF-IDF 5 Term frequency–inverse document frequency , a method for measuring the significance of a word in a document compared to its frequency across all documents in a collection. scores with semantic similarity of the full texts of our sample of GPT-generated articles that fall into the “Environment” and “Health” categories, reflects the two categories in question. However, as can be seen in Figure 1, it also reveals overlap and sub-areas. The y-axis shows word prominences through word positions and font sizes, while the x-axis indicates semantic similarity. In addition to a certain amount of overlap, this reveals sub-areas, which are best described as two distinct events within the word rain. The event on the left bundles terms related to the development and management of health and healthcare with “challenges,” “impact,” and “potential of artificial intelligence”emerging as semantically related terms. Terms related to research infrastructures, environmental, epistemic, and technological concepts are arranged further down in the same event (e.g., “system,” “climate,” “understanding,” “knowledge,” “learning,” “education,” “sustainable”). A second distinct event further to the right bundles terms associated with fish farming and aquatic medicinal plants, highlighting the presence of an aquaculture cluster. Here, the prominence of groups of terms such as “used,” “model,” “-based,” and “traditional” suggests the presence of applied research on these topics. The two events making up the word rain visualization, are linked by a less dominant but overlapping cluster of terms related to “energy” and “water.”
The bar chart of the terms in the paper subset (see Figure 2) complements the word rain visualization by depicting the most prominent terms in the full texts along the y-axis. Here, word prominences across health and environment papers are arranged descendingly, where values outside parentheses are TF-IDF values (relative frequencies) and values inside parentheses are raw term frequencies (absolute frequencies).
Finding 3: Google Scholar presents results from quality-controlled and non-controlled citation databases on the same interface, providing unfiltered access to GPT-fabricated questionable papers.
Google Scholar’s central position in the publicly accessible scholarly communication infrastructure, as well as its lack of standards, transparency, and accountability in terms of inclusion criteria, has potentially serious implications for public trust in science. This is likely to exacerbate the already-known potential to exploit Google Scholar for evidence hacking (Tripodi et al., 2023) and will have implications for any attempts to retract or remove fraudulent papers from their original publication venues. Any solution must consider the entirety of the research infrastructure for scholarly communication and the interplay of different actors, interests, and incentives.
We searched and scraped Google Scholar using the Python library Scholarly (Cholewiak et al., 2023) for papers that included specific phrases known to be common responses from ChatGPT and similar applications with the same underlying model (GPT3.5 or GPT4): “as of my last knowledge update” and/or “I don’t have access to real-time data” (see Appendix A). This facilitated the identification of papers that likely used generative AI to produce text, resulting in 227 retrieved papers. The papers’ bibliographic information was automatically added to a spreadsheet and downloaded into Zotero. 6 An open-source reference manager, https://zotero.org .
We employed multiple coding (Barbour, 2001) to classify the papers based on their content. First, we jointly assessed whether the paper was suspected of fraudulent use of ChatGPT (or similar) based on how the text was integrated into the papers and whether the paper was presented as original research output or the AI tool’s role was acknowledged. Second, in analyzing the content of the papers, we continued the multiple coding by classifying the fraudulent papers into four categories identified during an initial round of analysis—health, environment, computing, and others—and then determining which subjects were most affected by this issue (see Table 1). Out of the 227 retrieved papers, 88 papers were written with legitimate and/or declared use of GPTs (i.e., false positives, which were excluded from further analysis), and 139 papers were written with undeclared and/or fraudulent use (i.e., true positives, which were included in further analysis). The multiple coding was conducted jointly by all authors of the present article, who collaboratively coded and cross-checked each other’s interpretation of the data simultaneously in a shared spreadsheet file. This was done to single out coding discrepancies and settle coding disagreements, which in turn ensured methodological thoroughness and analytical consensus (see Barbour, 2001). Redoing the category coding later based on our established coding schedule, we achieved an intercoder reliability (Cohen’s kappa) of 0.806 after eradicating obvious differences.
The ranking algorithm of Google Scholar prioritizes highly cited and older publications (Martín-Martín et al., 2016). Therefore, the position of the articles on the search engine results pages was not particularly informative, considering the relatively small number of results in combination with the recency of the publications. Only the query “as of my last knowledge update” had more than two search engine result pages. On those, questionable articles with undeclared use of GPTs were evenly distributed across all result pages (min: 4, max: 9, mode: 8), with the proportion of undeclared use being slightly higher on average on later search result pages.
To understand how the papers making fraudulent use of generative AI were disseminated online, we programmatically searched for the paper titles (with exact string matching) in Google Search from our local IP address (see Appendix B) using the googlesearch – python library(Vikramaditya, 2020). We manually verified each search result to filter out false positives—results that were not related to the paper—and then compiled the most prominent URLs by field. This enabled the identification of other platforms through which the papers had been spread. We did not, however, investigate whether copies had spread into SciHub or other shadow libraries, or if they were referenced in Wikipedia.
We used descriptive statistics to count the prevalence of the number of GPT-fabricated papers across topics and venues and top domains by subject. The pandas software library for the Python programming language (The pandas development team, 2024) was used for this part of the analysis. Based on the multiple coding, paper occurrences were counted in relation to their categories, divided into indexed journals, non-indexed journals, student papers, and working papers. The schemes, subdomains, and subdirectories of the URL strings were filtered out while top-level domains and second-level domains were kept, which led to normalizing domain names. This, in turn, allowed the counting of domain frequencies in the environment and health categories. To distinguish word prominences and meanings in the environment and health-related GPT-fabricated questionable papers, a semantically-aware word cloud visualization was produced through the use of a word rain (Centre for Digital Humanities Uppsala, 2023) for full-text versions of the papers. Font size and y-axis positions indicate word prominences through TF-IDF scores for the environment and health papers (also visualized in a separate bar chart with raw term frequencies in parentheses), and words are positioned along the x-axis to reflect semantic similarity (Skeppstedt et al., 2024), with an English Word2vec skip gram model space (Fares et al., 2017). An English stop word list was used, along with a manually produced list including terms such as “https,” “volume,” or “years.”
- Artificial Intelligence
- / Search engines
Cite this Essay
Haider, J., Söderström, K. R., Ekström, B., & Rödl, M. (2024). GPT-fabricated scientific papers on Google Scholar: Key features, spread, and implications for preempting evidence manipulation. Harvard Kennedy School (HKS) Misinformation Review . https://doi.org/10.37016/mr-2020-156
- / Appendix B
Bibliography
Antkare, I. (2020). Ike Antkare, his publications, and those of his disciples. In M. Biagioli & A. Lippman (Eds.), Gaming the metrics (pp. 177–200). The MIT Press. https://doi.org/10.7551/mitpress/11087.003.0018
Barbour, R. S. (2001). Checklists for improving rigour in qualitative research: A case of the tail wagging the dog? BMJ , 322 (7294), 1115–1117. https://doi.org/10.1136/bmj.322.7294.1115
Bom, H.-S. H. (2023). Exploring the opportunities and challenges of ChatGPT in academic writing: A roundtable discussion. Nuclear Medicine and Molecular Imaging , 57 (4), 165–167. https://doi.org/10.1007/s13139-023-00809-2
Cabanac, G., & Labbé, C. (2021). Prevalence of nonsensical algorithmically generated papers in the scientific literature. Journal of the Association for Information Science and Technology , 72 (12), 1461–1476. https://doi.org/10.1002/asi.24495
Cabanac, G., Labbé, C., & Magazinov, A. (2021). Tortured phrases: A dubious writing style emerging in science. Evidence of critical issues affecting established journals . arXiv. https://doi.org/10.48550/arXiv.2107.06751
Carrion, M. L. (2018). “You need to do your research”: Vaccines, contestable science, and maternal epistemology. Public Understanding of Science , 27 (3), 310–324. https://doi.org/10.1177/0963662517728024
Centre for Digital Humanities Uppsala (2023). CDHUppsala/word-rain [Computer software]. https://github.com/CDHUppsala/word-rain
Chinn, S., & Hasell, A. (2023). Support for “doing your own research” is associated with COVID-19 misperceptions and scientific mistrust. Harvard Kennedy School (HSK) Misinformation Review, 4 (3). https://doi.org/10.37016/mr-2020-117
Cholewiak, S. A., Ipeirotis, P., Silva, V., & Kannawadi, A. (2023). SCHOLARLY: Simple access to Google Scholar authors and citation using Python (1.5.0) [Computer software]. https://doi.org/10.5281/zenodo.5764801
Dadkhah, M., Lagzian, M., & Borchardt, G. (2017). Questionable papers in citation databases as an issue for literature review. Journal of Cell Communication and Signaling , 11 (2), 181–185. https://doi.org/10.1007/s12079-016-0370-6
Dadkhah, M., Oermann, M. H., Hegedüs, M., Raman, R., & Dávid, L. D. (2023). Detection of fake papers in the era of artificial intelligence. Diagnosis , 10 (4), 390–397. https://doi.org/10.1515/dx-2023-0090
DeGeurin, M. (2024, March 19). AI-generated nonsense is leaking into scientific journals. Popular Science. https://www.popsci.com/technology/ai-generated-text-scientific-journals/
Dunlap, R. E., & Brulle, R. J. (2020). Sources and amplifiers of climate change denial. In D.C. Holmes & L. M. Richardson (Eds.), Research handbook on communicating climate change (pp. 49–61). Edward Elgar Publishing. https://doi.org/10.4337/9781789900408.00013
Fares, M., Kutuzov, A., Oepen, S., & Velldal, E. (2017). Word vectors, reuse, and replicability: Towards a community repository of large-text resources. In J. Tiedemann & N. Tahmasebi (Eds.), Proceedings of the 21st Nordic Conference on Computational Linguistics (pp. 271–276). Association for Computational Linguistics. https://aclanthology.org/W17-0237
Google Scholar Help. (n.d.). Inclusion guidelines for webmasters . https://scholar.google.com/intl/en/scholar/inclusion.html
Gu, J., Wang, X., Li, C., Zhao, J., Fu, W., Liang, G., & Qiu, J. (2022). AI-enabled image fraud in scientific publications. Patterns , 3 (7), 100511. https://doi.org/10.1016/j.patter.2022.100511
Gusenbauer, M., & Haddaway, N. R. (2020). Which academic search systems are suitable for systematic reviews or meta-analyses? Evaluating retrieval qualities of Google Scholar, PubMed, and 26 other resources. Research Synthesis Methods , 11 (2), 181–217. https://doi.org/10.1002/jrsm.1378
Haider, J., & Åström, F. (2017). Dimensions of trust in scholarly communication: Problematizing peer review in the aftermath of John Bohannon’s “Sting” in science. Journal of the Association for Information Science and Technology , 68 (2), 450–467. https://doi.org/10.1002/asi.23669
Huang, J., & Tan, M. (2023). The role of ChatGPT in scientific communication: Writing better scientific review articles. American Journal of Cancer Research , 13 (4), 1148–1154. https://www.ncbi.nlm.nih.gov/pmc/articles/PMC10164801/
Jones, N. (2024). How journals are fighting back against a wave of questionable images. Nature , 626 (8000), 697–698. https://doi.org/10.1038/d41586-024-00372-6
Kitamura, F. C. (2023). ChatGPT is shaping the future of medical writing but still requires human judgment. Radiology , 307 (2), e230171. https://doi.org/10.1148/radiol.230171
Littell, J. H., Abel, K. M., Biggs, M. A., Blum, R. W., Foster, D. G., Haddad, L. B., Major, B., Munk-Olsen, T., Polis, C. B., Robinson, G. E., Rocca, C. H., Russo, N. F., Steinberg, J. R., Stewart, D. E., Stotland, N. L., Upadhyay, U. D., & Ditzhuijzen, J. van. (2024). Correcting the scientific record on abortion and mental health outcomes. BMJ , 384 , e076518. https://doi.org/10.1136/bmj-2023-076518
Lund, B. D., Wang, T., Mannuru, N. R., Nie, B., Shimray, S., & Wang, Z. (2023). ChatGPT and a new academic reality: Artificial Intelligence-written research papers and the ethics of the large language models in scholarly publishing. Journal of the Association for Information Science and Technology, 74 (5), 570–581. https://doi.org/10.1002/asi.24750
Martín-Martín, A., Orduna-Malea, E., Ayllón, J. M., & Delgado López-Cózar, E. (2016). Back to the past: On the shoulders of an academic search engine giant. Scientometrics , 107 , 1477–1487. https://doi.org/10.1007/s11192-016-1917-2
Martín-Martín, A., Thelwall, M., Orduna-Malea, E., & Delgado López-Cózar, E. (2021). Google Scholar, Microsoft Academic, Scopus, Dimensions, Web of Science, and OpenCitations’ COCI: A multidisciplinary comparison of coverage via citations. Scientometrics , 126 (1), 871–906. https://doi.org/10.1007/s11192-020-03690-4
Simon, F. M., Altay, S., & Mercier, H. (2023). Misinformation reloaded? Fears about the impact of generative AI on misinformation are overblown. Harvard Kennedy School (HKS) Misinformation Review, 4 (5). https://doi.org/10.37016/mr-2020-127
Skeppstedt, M., Ahltorp, M., Kucher, K., & Lindström, M. (2024). From word clouds to Word Rain: Revisiting the classic word cloud to visualize climate change texts. Information Visualization , 23 (3), 217–238. https://doi.org/10.1177/14738716241236188
Swedish Research Council. (2017). Good research practice. Vetenskapsrådet.
Stokel-Walker, C. (2024, May 1.). AI Chatbots Have Thoroughly Infiltrated Scientific Publishing . Scientific American. https://www.scientificamerican.com/article/chatbots-have-thoroughly-infiltrated-scientific-publishing/
Subbaraman, N. (2024, May 14). Flood of fake science forces multiple journal closures: Wiley to shutter 19 more journals, some tainted by fraud. The Wall Street Journal . https://www.wsj.com/science/academic-studies-research-paper-mills-journals-publishing-f5a3d4bc
The pandas development team. (2024). pandas-dev/pandas: Pandas (v2.2.2) [Computer software]. Zenodo. https://doi.org/10.5281/zenodo.10957263
Thorp, H. H. (2023). ChatGPT is fun, but not an author. Science , 379 (6630), 313–313. https://doi.org/10.1126/science.adg7879
Tripodi, F. B., Garcia, L. C., & Marwick, A. E. (2023). ‘Do your own research’: Affordance activation and disinformation spread. Information, Communication & Society , 27 (6), 1212–1228. https://doi.org/10.1080/1369118X.2023.2245869
Vikramaditya, N. (2020). Nv7-GitHub/googlesearch [Computer software]. https://github.com/Nv7-GitHub/googlesearch
This research has been supported by Mistra, the Swedish Foundation for Strategic Environmental Research, through the research program Mistra Environmental Communication (Haider, Ekström, Rödl) and the Marcus and Amalia Wallenberg Foundation [2020.0004] (Söderström).
Competing Interests
The authors declare no competing interests.
The research described in this article was carried out under Swedish legislation. According to the relevant EU and Swedish legislation (2003:460) on the ethical review of research involving humans (“Ethical Review Act”), the research reported on here is not subject to authorization by the Swedish Ethical Review Authority (“etikprövningsmyndigheten”) (SRC, 2017).
This is an open access article distributed under the terms of the Creative Commons Attribution License , which permits unrestricted use, distribution, and reproduction in any medium, provided that the original author and source are properly credited.
Data Availability
All data needed to replicate this study are available at the Harvard Dataverse: https://doi.org/10.7910/DVN/WUVD8X
Acknowledgements
The authors wish to thank two anonymous reviewers for their valuable comments on the article manuscript as well as the editorial group of Harvard Kennedy School (HKS) Misinformation Review for their thoughtful feedback and input.
IMAGES
VIDEO
COMMENTS
Research Methodology Example. An Example of Research Methodology could be the following: ... The research methodology is an important section of any research paper or thesis, as it describes the methods and procedures that will be used to conduct the research. It should include details about the research design, data collection methods, data ...
Example of a methodology in a research paper. The following example of a methodology in a research paper provides insight into the structure and content to consider when writing your own: This research article discusses the psychological and emotional impact of a mental health support program for employees. The program provided prolonged and ...
The methodology section of your paper describes how your research was conducted. This information allows readers to check whether your approach is accurate and dependable. A good methodology can help increase the reader's trust in your findings. First, we will define and differentiate quantitative and qualitative research.
What Is a Research Methodology? | Steps & Tips. Published on August 25, 2022 by Shona McCombes and Tegan George. Revised on September 5, 2024. Your research methodology discusses and explains the data collection and analysis methods you used in your research. A key part of your thesis, dissertation, or research paper, the methodology chapter explains what you did and how you did it, allowing ...
Research Methodology Example. Detailed Walkthrough + Free Methodology Chapter Template. If you're working on a dissertation or thesis and are looking for an example of a research methodology chapter, you've come to the right place. In this video, we walk you through a research methodology from a dissertation that earned full distinction ...
Do yourself a favour and start with the end in mind. Section 1 - Introduction. As with all chapters in your dissertation or thesis, the methodology chapter should have a brief introduction. In this section, you should remind your readers what the focus of your study is, especially the research aims. As we've discussed many times on the blog ...
For example, if you are using a multiple choice questionnaire, readers need to know that it offered your respondents a reasonable range of answers to choose from. ... "How to Write the Methods Section of a Research Paper." Respiratory Care 49 (October 2004):1229-1232; Lunenburg, Frederick C. Writing a Successful Thesis or Dissertation: Tips ...
1. Qualitative research methodology. Qualitative research methodology is aimed at understanding concepts, thoughts, or experiences. This approach is descriptive and is often utilized to gather in-depth insights into people's attitudes, behaviors, or cultures. Qualitative research methodology involves methods like interviews, focus groups, and ...
The main heading of "Methods" should be centered, boldfaced, and capitalized. Subheadings within this section are left-aligned, boldfaced, and in title case. You can also add lower level headings within these subsections, as long as they follow APA heading styles. To structure your methods section, you can use the subheadings of ...
Your Methods Section contextualizes the results of your study, giving editors, reviewers and readers alike the information they need to understand and interpret your work. Your methods are key to establishing the credibility of your study, along with your data and the results themselves. A complete methods section should provide enough detail for a skilled researcher to replicate your process ...
The methods section is a fundamental section of any paper since it typically discusses the 'what', 'how', 'which', and 'why' of the study, which is necessary to arrive at the final conclusions. In a research article, the introduction, which serves to set the foundation for comprehending the background and results is usually ...
15 Research Methodology Examples. Research methodologies can roughly be categorized into three group: quantitative, qualitative, and mixed-methods. Qualitative Research: This methodology is based on obtaining deep, contextualized, non-numerical data. It can occur, for example, through open-ended questioning of research particiapnts in order to ...
Revised on 10 October 2022. Your research methodology discusses and explains the data collection and analysis methods you used in your research. A key part of your thesis, dissertation, or research paper, the methodology chapter explains what you did and how you did it, allowing readers to evaluate the reliability and validity of your research.
Research methods are specific procedures for collecting and analyzing data. Developing your research methods is an integral part of your research design. When planning your methods, there are two key decisions you will make. First, decide how you will collect data. Your methods depend on what type of data you need to answer your research question:
As we mentioned, research methodology refers to the collection of practical decisions regarding what data you'll collect, from who, how you'll collect it and how you'll analyse it. Research design, on the other hand, is more about the overall strategy you'll adopt in your study. For example, whether you'll use an experimental design ...
The methodology section of a research paper outlines how you plan to conduct your study. It covers various steps such as collecting data, statistical analysis, observing participants, and other procedures involved in the research process ... Include information about the sample and sample space in the methodology section. The term "sample ...
0 comment 39. Research methodology 1,2 is a structured and scientific approach used to collect, analyze, and interpret quantitative or qualitative data to answer research questions or test hypotheses. A research methodology is like a plan for carrying out research and helps keep researchers on track by limiting the scope of the research.
The methods section should describe what was done to answer the research question, describe how it was done, justify the experimental design, and explain how the results were analyzed. Scientific writing is direct and orderly. Therefore, the methods section structure should: describe the materials used in the study, explain how the materials ...
The following example of a methodology in a research paper can provide additional insight into what to include and how to structure yours: This research paper explains the psychological and emotional effects of a support program for employees with mental illness. The program involved extended and individualized support for employment candidates ...
The methodology section is the backbone of systematic reviews and meta-analyses, detailing the research methods employed to select, ... Outline Template For Research Paper: Research Paper Outline Examples; How To Use Litmaps To Create A Litmap For Literature Review; Unriddle AI: How To Use This Note Taking App For Research ...
Predicting future outcomes of patients is essential to clinical practice, with many prediction models published each year. Empirical evidence suggests that published studies often have severe methodological limitations, which undermine their usefulness. This article presents a step-by-step guide to help researchers develop and evaluate a clinical prediction model. The guide covers best ...
This paper explores the potential to synthesise practice-based evidence, reporting on a methodological study to develop and pilot a synthesis method with a sample of community wellbeing case studies. These published case studies all reported on the development and implementation of community-based wellbeing interventions in context.
When you write a thesis, dissertation, or research paper, you will likely have to conduct a literature review to situate your research within existing knowledge. The literature review gives you a chance to: Demonstrate your familiarity with the topic and its scholarly context; Develop a theoretical framework and methodology for your research
How to write findings in a research paper It follows the presentation of the Methods and Materials and is presented before the Discussion section —although the Results and Discussion are presented together in many journals. Tests of statistical significance should always be presented with your results to show that your research findings objectively confirm or disprove your hypotheses.
Research question or hypothesis: Clearly state your research question or hypothesis and explain its significance. Aims and objectives: Outline the goals of your research and what you aim to achieve through your study. Research approach: Provide a brief overview of your methodology and how you plan to address your research question.
This paper presents a new and innovative methodology for the investigation of karst systems using spring discharge. The behaviour of springs in phase space is investigated by plotting the measurements of spring discharge versus the measurements of the water level at the spring's outlet. Such a diagram reveals new features of the function of the karst system and the discharge pattern of the ...
Academic journals, archives, and repositories are seeing an increasing number of questionable research papers clearly produced using generative AI. They are often created with widely available, general-purpose AI applications, most likely ChatGPT, and mimic scientific writing. Google Scholar easily locates and lists these questionable papers alongside reputable, quality-controlled research.