
- Get new issue alerts Get alerts
- Submit a Manuscript

Secondary Logo
Journal logo.
Colleague's E-mail is Invalid
Your message has been successfully sent to your colleague.
Save my selection
Data Analysis in Qualitative Research
Ravindran, Vinitha 1,
1 College of Nursing, CMC, Vellore, Tamil Nadu, India
Address for correspondence: Dr. Vinitha Ravindran, College of Nursing, CMC, Vellore, Tamil Nadu, India. E-Mail: [email protected]
This is an open access journal, and articles are distributed under the terms of the Creative Commons Attribution-NonCommercial-ShareAlike 4.0 License, which allows others to remix, tweak, and build upon the work non-commercially, as long as appropriate credit is given and the new creations are licensed under the identical terms.
Data analysis in qualitative research is an iterative and complex process. The focus of analysis is to bring out tacit meanings that people attach to their actions and responses related to a phenomenon. Although qualitative data analysis softwares are available, the researcher is the primary instrument who attempts to bring out these meanings by a deep engagement with the data and the individuals who share their stories. Although different approaches are suggested in different qualitative methods, the basic steps of content analysis that includes preparing the data, reading and reflection, coding, categorising and developing themes are integral to all approaches. The analysis process moves the researcher from describing the phenomenon to conceptualisation and abstraction of themes without losing the voice of the participants which are represented by the findings.
INTRODUCTION
Qualitative data analysis appears simple to those who have limited knowledge of qualitative research approach, but for the seasoned qualitative researcher, it is one of the most difficult tasks. According to Thorn,[ 1 ] it is the complex and elusive part of the qualitative research process. Many challenges that are inherent in the research approach makes the analysis process demanding. The first challenge is to convert the data from visual or auditory recording to textual data. As qualitative approach includes data generation through sharing of experiences, it becomes fundamentally necessary to record data rather than writing down accounts as the stories are shared. Essential data which may become apparent or uncovered when reflecting on audiotaped interviews may be missed or overlooked if interviews are not recorded.[ 2 ] Although field notes are written they often augment the experiences conveyed by participants rather than being the primary data source. Therefore, the researcher needs to spend effort and time to record as well as transcribe data to texts which can be analysed.
The second challenge is managing the quantum of textual data. One hour of interview may produce 20–40 pages of text. Even with fewer participants as generally is in qualitative research, the researcher may have many pages of data which need coding and analysing. Although software packages such as NVivo and Atlas-ti are available, they only help to organise, sort and categorise data and will not give meaning to the text.[ 3 ] The researcher has to read, reflect, compare and analyse data. The categories and themes have to be brought forth by the researcher. The third challenge is doing data generation and data analysis at the same time. Concurrent data generation and analysis is a predominant feature in qualitative research. An iterative or cyclic method of data collection and analysis is emphasised in qualitative approach. What it means is that as the researcher collects data, the analysis process is also initiated. The researcher does not wait to complete collecting data and then do analysis.[ 2 ] Iterative process enhances the researcher to focus on emerging concepts and categories in subsequent interviews and observations. It enables the researcher to address the gaps in the data and get information to saturate the gaps in subsequent contacts with earlier or new research participants. Sufficient time and resources are needed for sustaining the iterative process throughout the research process.
The above challenges are mentioned at the beginning of this article not to discourage the researchers but to emphasise the complexity of data analysis which has to be seriously considered by all researchers who are interested in doing qualitative research. In addition to the general challenges, data analysis in qualitative research also varies between different approaches and designs. There is also the possibility of flexibility and fluidity that enhances the researcher to choose different approaches to analysis, either one specific approach or a combination of approaches.[ 4 ] The framework for the analysis should, however, be made explicit at the beginning of the analysis. In qualitative research, the researcher is a bricoleur (weaver of stories) who is creating a bricolage.[ 5 ]
CHARACTERISTICS OF DATA ANALYSIS
In qualitative data analysis.
- Researcher attempts to understand the meaning behind actions and behaviours of participants
- Researcher becomes the instrument to generate data and ask analytical questions
- Emphasis is given to quality and depth of narration about a phenomenon rather than the number of study participants
- The context and a holistic view of the participants' experience are stressed
- The research is sensitive to what the influence he/she has on the interpretation of data
- Analytical themes are projected as findings rather than quantified variables.
Process of data analysis
Qualitative data analysis can be both deductive and inductive. The deductive process, in which there is an attempt to establish causal relationships, is although associated with quantitative research, can be applied also in qualitative research as a deductive explanatory process or deductive category application.[ 6 ] When the researcher's interest is on specific aspects of the phenomenon, and the research question is focused and not general, a deductive approach to analysis may be used. For example, in a study done by Manoranjitham et al .,[ 7 ] focus group discussions were conducted to identify perceptions of suicide in terms of causes, methods of attempting suicide, impact of suicide and availability of support as perceived by family and community members and health-care professionals. Focused questions were asked to elicit information on what people thought about the above aspects of suicide. The answers from participants in focus groups were coded under each question, which was considered as categories and the number of responders and the responses were elaborated under the said questions as perceived by the participants. Deductive process in qualitative data analysis allows the researcher to be at a descriptive level where the results are closer to participants accounts, rather than moving to a more interpretive or conceptual level. This process is often used when qualitative research is used as a part of the mixed methods approach or as a part of an elaborate research study.
In contrast, the inductive process which is the hallmark of qualitative data analysis involves asking questions of the in-depth and vast data that have been generated from different sources regarding a phenomenon.[ 2 , 4 ] The inductive process is applicable to all qualitative research in which the research question has been more explorative and overarching in terms of understanding the phenomenon in peoples' lives. For example, in Rempel et al .'s[ 8 ] study on parenting children with life-threatening congenital heart disease, the researchers explored the process of parenting children with a lethal heart condition. Volumes of data generated through individual interviews with parents and grandparents were inductively analysed to understand the 'facets of parenting' children with heart disease. Inductive analysis motivates and enhances researchers to rise above describing what the participants say about their experience to interpretive conceptualisation and abstraction. The process of deduction and induction in qualitative data analysis is depicted in Figure 1 .

GENERAL STEPS IN DATA ANALYSIS
Although different analytical processes are proposed by different researchers, there are generally four basic steps to qualitative data analysis. These steps are similar to what is generally known as qualitative content analysis.[ 4 , 9 ] In any qualitative approach, the analysis starts with the steps of content analysis. The content analysis ends generally at an interpretive descriptive level. Further analysis to raise data to abstraction may be needed in some approaches such as grounded theory.
Preparation of data
Reading and reflecting, coding, categorising and memoing.
- Developing themes/conceptual models or theory.
As already discussed, the inductive process in qualitative research begins when data collection starts. Each recorded data set from individual interviews, focus groups or conversations should be first transcribed and edited. The researcher may decide on units of data that can be analysed to further help in organising.[ 10 ] The units can be the whole interview from one individual or interview transcripts from one family or data from different individuals connected with in a case (as in case study). On some occasions, the unit may consist of all answers to one question or one aspect of the phenomenon. Many researchers may not form any such units at the beginning of the analysis which is also accepted. The essential aspect of the preparation is to ensure that participants' accounts are truly represented in transcribing. Researchers who have a large amount of content will need assistance in transcription. One hour of interview may take 4–6 h to transcribe.[ 2 ] An official transcriber will do a good job than a researcher who may spend a long time in transcribing volumes of data. However, the researcher has to edit the transcription by listening to the audiotaped version and include words and connotations that are missed to maintain accuracy in transcription.[ 11 ] Another important point to note is to transcribe and prepare the data as soon as interviews are completed. This facilitates the iterative process of data collection and analysis. All data, including field notes, should be organised with date, time and identification number or pseudonym for easy retrieval.[ 2 ] Assigning numbers or pseudonyms help to maintain the confidentiality of the participants.
Reading the data as a whole, and reflecting on what the participants are sharing gives an initial understanding of the narrative. The reflection may start at the time of the interview itself. However, reading and rereading the transcribed text from an interview gives an understanding of context, situations, events and actions related to the phenomenon of interest before the data can be analysed for concepts and themes.[ 12 ] Reading and reflection help the researcher to get immersed in the data, understand the perspectives of participants and decide on an analytical framework for further data analysis.[ 13 ] As texts are read, the researcher may jot down points or questions that are striking or unusual or does or does not support assumptions. Such reflective notes assist the researcher to decide on questions to be asked in further interviews or look for similarities or differences in interview texts from other participants. These initial reflections do not complete analysis; rather, it provides a platform for the analysis to develop. An example of initial reflections when analysing interviews from a study on home care of children with chronic illness is given below.
Reflections-family 1 interview
'This family has a lot of issues related to home care. Their conversation is a list of complaints about the system and the personnel. Even though it appears that help is being rendered for support of child at home, nothing seems to satisfy the parents. The conversation revolves around how they have not been given their due in terms of material and personnel support rather than about their sick child or the siblings.
After a while, it became tedious for me to read this transcript as I resent the complaints (which I should not do I suppose). I wonder how other families perceive home care.'
The initial reflections also help to understand our position as a researcher and the assumptions the researcher brings to the study. It helps us to be aware of one's own professional and personal prejudices which may influence the interpretation of data.
For analysis to progress further the researcher has to decide on an organised way of sorting and categorising data to come to an understanding about the phenomenon or the concepts embedded in the phenomenon. Researchers may choose to analyse only the manifest content in a descriptive qualitative study or may move further to look for latent content in an analytical-qualitative study.[ 4 ] The manifest content analysis includes looking for specific words or phrases used by the participants and accounting for how many have expressed the same or similar words/phrases in the data. It looks at what is obvious. Latent content analysis, on the other hand, involves coding and categorising to identify patterns and themes that are implicit in the data.
Coding is an essential first step in sorting and organising data.[ 4 ] Codes are labels given to phrases, expressions, behaviours, images and sentences as the researcher goes through the data.[ 13 ] It can be 'in vivo' codes or 'interpretive codes'. When participants' exact expressions itself are used as codes it is called ' in vivo ' codes.[ 14 ] If the researcher interprets the expression or behaviour of the participant depicted in the text, then it is called interpretive codes. In the grounded theory method, different levels of coding are suggested. The first level is called the 'open coding' that involves sifting through the initial data line by line and creating in vivo or interpretive codes. Questions such as what are this person saying or doing or what is happening here? will help in the initial coding of data. Initial coding may reveal gaps in the data or raise questions.[ 15 , 16 ] These gaps and questions will help the researcher to locate the sources from where further data are to be collected. The second level is known as 'focus or selective coding' will be used in subsequent interviews. Focused coding involves using the most frequent or most significant earlier codes to sift through large amounts of data. Focused codes are more directed, selective and conceptual and are employed to raise the sorting of data to an analytical level.[ 17 ] The first level of coding can be done manually or can be done using qualitative software packages. In other types of content analysis, the different levels of coding may not be followed instead the researcher engages in interpretive coding as the text is read. In a grounded theory study on parenting children with burn injury open codes such as scolded, accused, unwanted, guilt, nonsupport, difficult to care, terrible pain, blaming oneself and tired came up as the data were coded [ Table 1 ]. These codes gave the researcher an initial insight into the traumatic experiences that the parents undergo when caring for their burn-injured children. As texts were coded, the researcher attempted to understand further the struggles of parents in the successive interviews with other families.

Categorising
Categorising involves grouping similar codes together and formulating an understandable set within which related data can be clubbed. A category is 'a collection of similar data sorted into the same place' – the 'what', developed using content analysis and developing trajectories and relationships over time.[ 18 ] It is a group of content that shares commonality. Data can be categorised generally when the researcher realises that the same codes or codes that are relatively similar are emerging from the data. When categories are developed based on codes, they can be still at descriptive level or can be at an abstract level.[ 10 ] By developing categories a conceptual coding structure can be formulated. At this level, there is no need to continue line by line coding. Instead, the researcher uses the coding structure to sort data. In other words, parts of data that best fit the categories, and the codes are grouped appropriately from across the data sets. The grouping of data into categories is enabled by comparing and contrasting data from different sources or individuals.[ 19 ] As constant comparison continues[ 15 ] questions such as 'What is different between the accounts of two families? What are similar? Will help in grouping data into categories. As the researcher compares data, questions such as 'what if' may come up which will propel the researcher to return to participants to know more or even purposively include participants who will answer the question. The data under each category should be read again to ensure that they appropriately represent the category.[ 4 ] Qualitative software packages are very useful in sorting and organising data from this level. Any part of data which is not fitting into any category needs to be coded newly, and the new codes should be added. The emerging new codes may later fit into a category or form new categories. All data are thus accounted for during this phase of analysis.
As analysis and grouping of further data continue, the researcher may rearrange data within categories or come up with subcategories.[ 4 ] The researcher may also go from data to codes, to sub-categories which then can be abstracted into categories.[ 10 ] In the burn study, similar codes that were repeated in many transcripts were grouped together. Grouping these codes helped in developing subcategories such as physical trauma, emotional trauma, self-blame and shame. The sub-categories were then grouped to develop meaningful categories such as facing blame and enduring the burn [ Table 2 ]. Creating categories thus assists the researcher to move from describing phenomenon to interpretation and abstraction.

Memoing is 'the researcher's record of analysis, thoughts, interpretations, questions and directions for further data collection' (pp 110).[ 20 ] Memos are elaborations of thoughts on data, codes and categories that are written down.[ 17 ] Simply put, memoing is writing down the reflections and ideas that arise from the data as data analysis progresses. As data are coded, the researcher writes down his/her thoughts on the codes and their relationships as they occur. Memo-writing is an on-going process, and memos lead to abstraction and theorising for the write-up of ideas.[ 15 ] Initial or early memos help in exploring and filling out the initial qualitative codes. It helps the researcher to understand what the participants are saying or doing and what is happening. Advanced memos help in the emergence of categories and identify the beliefs and assumptions that support the categories. Memos also help in looking at the categories and the data from different vantage points.[ 21 ] One of the early memos from burn study is given as an example.
Extensive wound
24 June, 2010, 10 pm – After coding interview texts from three families.
'I am struck by the enormity of a burn injury. I realize that family members cannot do many things for the child at home after discharge of a severely burned child because the injury is so big that even some clinics and doctors who are not familiar with burn care cannot manage care. These children need continuous attention of the health care professionals. They need professional assistance with dressing. They need professional assistance with splints and gadgets, and therapies. The injury is extensive that it is difficult for family members to do many things on their own. It is very hard, very hard for the parents to take up a role of the caregiver for children with burns because it involves large wound which has not healed or is in the process of early healing and the child suffers severe pain. The post burn care is very different from caring for other children with chronic illness or congenital defects which most often does not involve pain. The child's suffering makes it easy for the parents to view them as vulnerable. Yet the parents do their best. They try to follow the Health Care Professionals advice, they try to go for follow-up, but it seems simply not enough. I think the parents are doing all that they can within the context of severe injury, lack of finances, lack of resources in home town, or blame and ridicule from neighbors and others…'
Stopping to memo helps the researcher to reflect on data, move towards developing themes and models and lay the ground for discussion of findings later. Memos need to include the time, date, place and context at which they were written.
Developing themes, conceptual models and theory
Developing themes involves the 'threading together of the underlying meaning' that run through all the categories. It is the interpretation of the latent content in the texts.[ 10 ] Theming involves integrating all the categories and explicating the relationship in the categories.[ 4 ] In coding and categorising the researcher is involved in deconstructing or dividing the data to understand the feelings, behaviours and actions. In the phase of theming, the researcher is trying to connect the deconstructed part by understanding the implicit meaning that connects the behaviour, actions and reactions related to a phenomenon. To identify theme, the grounded theorist asks: What is the core issue which the participants are dealing with? The phenomenologist will ask about the central essence or structure of the lived experience related to the phenomenon of interest. The ethnographer may look at the cultural themes that link the categories. The researcher generally comes up with one to three themes.[ 4 ] Too many categories or themes may indicate that the analysis is prematurely closed and implies the need for the researcher to further interpret and conceptualise the data.[ 4 ] In the study on parenting children with burn injury, the researcher came up with the theme of 'Double Trauma' which explicated the experiences of parents living the burn with their children and also enduring the blame within the context of both the hospital and home [ Table 2 ].
In phenomenology and ethnography, the analysis may end with identifying themes. In other approaches, such as grounded theory and interpretive description, the analysis may progress further to developing theory or conceptual models. Identifying the core category/variable from the coding activity, memos and constant comparisons are the first step in moving towards theory development in grounded theory.[ 15 ] The core category is the main theme that the researcher identifies in the data. The next step in grounded theory is to identify the basic social process (BSP). The BSP evolves from understanding how participants are dealing with the core issue. In real-world situations, individuals develop their own strategies and process to deal with the core issue in any situation. Identifying this process is the stepping stone to theory development in grounded theory. In the example of burn study, the theme 'Double Trauma' was the core category and parenting in the burn study involved a dual process of 'embracing the survival' and 'enduring the blame'.[ 22 , 23 ] A conceptual model was developed based on these processes.
PITFALLS IN QUALITATIVE ANALYSIS
Large data sets for analysis.
As already explained, the amount of data text or field notes from observations and other sources in qualitative research can become overwhelming if data analysis is not initiated concurrently with data collection/generation. Coding large data text is tedious and takes much of the researcher's time. Postponing analysis to the end of data collection also prevents the researcher from becoming focused in subsequent interviews and filling gaps in data in further data collection. Therefore, deferring data analysis should be avoided.
Premature closure
Researcher should not hasten to conclude analysis with developing categories or themes. This may lead to 'premature closure' of the research and the danger that the participants' experiences are misunderstood or incompletely understood.[ 15 ] Qualitative data analysis involves in-depth interaction with the data and understanding the nuances in the experiences and the meanings behind actions. The researcher continues to generate data until all the categories are saturated, which means that the categories are mutually exclusive and can be explained from all aspects or angle.[ 21 ] In the burn study, although the table in this article appears simple, the codes and categories were developed from larger data sets representing multiple participant interviews and field notes. The category 'facing blame' was brought forth with parents' accounts of experiencing blame in almost all the families in one or multiple ways: from family members, health-care professionals, strangers and the child itself. The researcher needs to be reflexive and iteratively do data generation and analysis until there is no new information forthcoming in the data. Inferring conclusions too soon which is otherwise known as 'inferential leaps', will prevent the researcher from getting the whole picture of the phenomenon.[ 2 ]
Interpretation of meanings
During the analysis process as the researcher interprets and conceptualises the participants' experiences, he/she delves into the tacit meanings of actions and feelings expressed by participants or observed in various situations. The researcher endeavours to keep the interpretations as close to the participants' accounts as possible. However, it should be understood that the meanings are co-constructed by both the participant and researcher by collaborative effort which is also a hallmark of qualitative research.[ 2 ] In the process of co-construction, researcher should be cautious to not lose the voice of the participants. Discussion with peer at all steps of analysis or checks on codes and categories by others in the research team may help to avoid this problem.
Qualitative data analysis is a complex process that demands much of reading, thinking and reflection on the part of researcher. It is time-consuming as the researcher has to be constantly engaged with the texts to tease out the hidden meanings. Beyond the differences in data analysis in different qualitative methods, coding, categorising and developing themes are the essential phases of data analysis in most methods. Researchers should avoid premature conclusions and ensure that the findings are comprehensively represented by participants' accounts. Qualitative data analysis is an iterative process.
Financial support and sponsorship
Conflicts of interest.
There are no conflicts of interest.
- Cited Here |
- View Full Text | CrossRef
- PubMed | CrossRef
- View Full Text | PubMed | CrossRef
Categories; codes; data analysis; qualitative research; theme
- + Favorites
- View in Gallery
Readers Of this Article Also Read
Artificial intelligence in healthcare, q-methodology as a research design: a brief overview, scholarship in nursing, nursing management of patients with psychiatric emergencies, a study to assess the insight and motivation towards quitting alcohol among....
- Skip to main content
- Skip to primary sidebar
- Skip to footer
- QuestionPro

- Solutions Industries Gaming Automotive Sports and events Education Government Travel & Hospitality Financial Services Healthcare Cannabis Technology Use Case AskWhy Communities Audience Contactless surveys Mobile LivePolls Member Experience GDPR Positive People Science 360 Feedback Surveys
- Resources Blog eBooks Survey Templates Case Studies Training Help center
Home Market Research
Qualitative Data Analysis: What is it, Methods + Examples

In a world rich with information and narrative, understanding the deeper layers of human experiences requires a unique vision that goes beyond numbers and figures. This is where the power of qualitative data analysis comes to light.
In this blog, we’ll learn about qualitative data analysis, explore its methods, and provide real-life examples showcasing its power in uncovering insights.
What is Qualitative Data Analysis?
Qualitative data analysis is a systematic process of examining non-numerical data to extract meaning, patterns, and insights.
In contrast to quantitative analysis, which focuses on numbers and statistical metrics, the qualitative study focuses on the qualitative aspects of data, such as text, images, audio, and videos. It seeks to understand every aspect of human experiences, perceptions, and behaviors by examining the data’s richness.
Companies frequently conduct this analysis on customer feedback. You can collect qualitative data from reviews, complaints, chat messages, interactions with support centers, customer interviews, case notes, or even social media comments. This kind of data holds the key to understanding customer sentiments and preferences in a way that goes beyond mere numbers.
Importance of Qualitative Data Analysis
Qualitative data analysis plays a crucial role in your research and decision-making process across various disciplines. Let’s explore some key reasons that underline the significance of this analysis:
In-Depth Understanding
It enables you to explore complex and nuanced aspects of a phenomenon, delving into the ‘how’ and ‘why’ questions. This method provides you with a deeper understanding of human behavior, experiences, and contexts that quantitative approaches might not capture fully.
Contextual Insight
You can use this analysis to give context to numerical data. It will help you understand the circumstances and conditions that influence participants’ thoughts, feelings, and actions. This contextual insight becomes essential for generating comprehensive explanations.
Theory Development
You can generate or refine hypotheses via qualitative data analysis. As you analyze the data attentively, you can form hypotheses, concepts, and frameworks that will drive your future research and contribute to theoretical advances.
Participant Perspectives
When performing qualitative research, you can highlight participant voices and opinions. This approach is especially useful for understanding marginalized or underrepresented people, as it allows them to communicate their experiences and points of view.
Exploratory Research
The analysis is frequently used at the exploratory stage of your project. It assists you in identifying important variables, developing research questions, and designing quantitative studies that will follow.
Types of Qualitative Data
When conducting qualitative research, you can use several qualitative data collection methods , and here you will come across many sorts of qualitative data that can provide you with unique insights into your study topic. These data kinds add new views and angles to your understanding and analysis.
Interviews and Focus Groups
Interviews and focus groups will be among your key methods for gathering qualitative data. Interviews are one-on-one talks in which participants can freely share their thoughts, experiences, and opinions.
Focus groups, on the other hand, are discussions in which members interact with one another, resulting in dynamic exchanges of ideas. Both methods provide rich qualitative data and direct access to participant perspectives.
Observations and Field Notes
Observations and field notes are another useful sort of qualitative data. You can immerse yourself in the research environment through direct observation, carefully documenting behaviors, interactions, and contextual factors.
These observations will be recorded in your field notes, providing a complete picture of the environment and the behaviors you’re researching. This data type is especially important for comprehending behavior in their natural setting.
Textual and Visual Data
Textual and visual data include a wide range of resources that can be qualitatively analyzed. Documents, written narratives, and transcripts from various sources, such as interviews or speeches, are examples of textual data.
Photographs, films, and even artwork provide a visual layer to your research. These forms of data allow you to investigate what is spoken and the underlying emotions, details, and symbols expressed by language or pictures.
When to Choose Qualitative Data Analysis over Quantitative Data Analysis
As you begin your research journey, understanding why the analysis of qualitative data is important will guide your approach to understanding complex events. If you analyze qualitative data, it will provide new insights that complement quantitative methodologies, which will give you a broader understanding of your study topic.
It is critical to know when to use qualitative analysis over quantitative procedures. You can prefer qualitative data analysis when:
- Complexity Reigns: When your research questions involve deep human experiences, motivations, or emotions, qualitative research excels at revealing these complexities.
- Exploration is Key: Qualitative analysis is ideal for exploratory research. It will assist you in understanding a new or poorly understood topic before formulating quantitative hypotheses.
- Context Matters: If you want to understand how context affects behaviors or results, qualitative data analysis provides the depth needed to grasp these relationships.
- Unanticipated Findings: When your study provides surprising new viewpoints or ideas, qualitative analysis helps you to delve deeply into these emerging themes.
- Subjective Interpretation is Vital: When it comes to understanding people’s subjective experiences and interpretations, qualitative data analysis is the way to go.
You can make informed decisions regarding the right approach for your research objectives if you understand the importance of qualitative analysis and recognize the situations where it shines.
Qualitative Data Analysis Methods and Examples
Exploring various qualitative data analysis methods will provide you with a wide collection for making sense of your research findings. Once the data has been collected, you can choose from several analysis methods based on your research objectives and the data type you’ve collected.
There are five main methods for analyzing qualitative data. Each method takes a distinct approach to identifying patterns, themes, and insights within your qualitative data. They are:
Method 1: Content Analysis
Content analysis is a methodical technique for analyzing textual or visual data in a structured manner. In this method, you will categorize qualitative data by splitting it into manageable pieces and assigning the manual coding process to these units.
As you go, you’ll notice ongoing codes and designs that will allow you to conclude the content. This method is very beneficial for detecting common ideas, concepts, or themes in your data without losing the context.
Steps to Do Content Analysis
Follow these steps when conducting content analysis:
- Collect and Immerse: Begin by collecting the necessary textual or visual data. Immerse yourself in this data to fully understand its content, context, and complexities.
- Assign Codes and Categories: Assign codes to relevant data sections that systematically represent major ideas or themes. Arrange comparable codes into groups that cover the major themes.
- Analyze and Interpret: Develop a structured framework from the categories and codes. Then, evaluate the data in the context of your research question, investigate relationships between categories, discover patterns, and draw meaning from these connections.
Benefits & Challenges
There are various advantages to using content analysis:
- Structured Approach: It offers a systematic approach to dealing with large data sets and ensures consistency throughout the research.
- Objective Insights: This method promotes objectivity, which helps to reduce potential biases in your study.
- Pattern Discovery: Content analysis can help uncover hidden trends, themes, and patterns that are not always obvious.
- Versatility: You can apply content analysis to various data formats, including text, internet content, images, etc.
However, keep in mind the challenges that arise:
- Subjectivity: Even with the best attempts, a certain bias may remain in coding and interpretation.
- Complexity: Analyzing huge data sets requires time and great attention to detail.
- Contextual Nuances: Content analysis may not capture all of the contextual richness that qualitative data analysis highlights.
Example of Content Analysis
Suppose you’re conducting market research and looking at customer feedback on a product. As you collect relevant data and analyze feedback, you’ll see repeating codes like “price,” “quality,” “customer service,” and “features.” These codes are organized into categories such as “positive reviews,” “negative reviews,” and “suggestions for improvement.”
According to your findings, themes such as “price” and “customer service” stand out and show that pricing and customer service greatly impact customer satisfaction. This example highlights the power of content analysis for obtaining significant insights from large textual data collections.
Method 2: Thematic Analysis
Thematic analysis is a well-structured procedure for identifying and analyzing recurring themes in your data. As you become more engaged in the data, you’ll generate codes or short labels representing key concepts. These codes are then organized into themes, providing a consistent framework for organizing and comprehending the substance of the data.
The analysis allows you to organize complex narratives and perspectives into meaningful categories, which will allow you to identify connections and patterns that may not be visible at first.
Steps to Do Thematic Analysis
Follow these steps when conducting a thematic analysis:
- Code and Group: Start by thoroughly examining the data and giving initial codes that identify the segments. To create initial themes, combine relevant codes.
- Code and Group: Begin by engaging yourself in the data, assigning first codes to notable segments. To construct basic themes, group comparable codes together.
- Analyze and Report: Analyze the data within each theme to derive relevant insights. Organize the topics into a consistent structure and explain your findings, along with data extracts that represent each theme.
Thematic analysis has various benefits:
- Structured Exploration: It is a method for identifying patterns and themes in complex qualitative data.
- Comprehensive knowledge: Thematic analysis promotes an in-depth understanding of the complications and meanings of the data.
- Application Flexibility: This method can be customized to various research situations and data kinds.
However, challenges may arise, such as:
- Interpretive Nature: Interpreting qualitative data in thematic analysis is vital, and it is critical to manage researcher bias.
- Time-consuming: The study can be time-consuming, especially with large data sets.
- Subjectivity: The selection of codes and topics might be subjective.
Example of Thematic Analysis
Assume you’re conducting a thematic analysis on job satisfaction interviews. Following your immersion in the data, you assign initial codes such as “work-life balance,” “career growth,” and “colleague relationships.” As you organize these codes, you’ll notice themes develop, such as “Factors Influencing Job Satisfaction” and “Impact on Work Engagement.”
Further investigation reveals the tales and experiences included within these themes and provides insights into how various elements influence job satisfaction. This example demonstrates how thematic analysis can reveal meaningful patterns and insights in qualitative data.
Method 3: Narrative Analysis
The narrative analysis involves the narratives that people share. You’ll investigate the histories in your data, looking at how stories are created and the meanings they express. This method is excellent for learning how people make sense of their experiences through narrative.
Steps to Do Narrative Analysis
The following steps are involved in narrative analysis:
- Gather and Analyze: Start by collecting narratives, such as first-person tales, interviews, or written accounts. Analyze the stories, focusing on the plot, feelings, and characters.
- Find Themes: Look for recurring themes or patterns in various narratives. Think about the similarities and differences between these topics and personal experiences.
- Interpret and Extract Insights: Contextualize the narratives within their larger context. Accept the subjective nature of each narrative and analyze the narrator’s voice and style. Extract insights from the tales by diving into the emotions, motivations, and implications communicated by the stories.
There are various advantages to narrative analysis:
- Deep Exploration: It lets you look deeply into people’s personal experiences and perspectives.
- Human-Centered: This method prioritizes the human perspective, allowing individuals to express themselves.
However, difficulties may arise, such as:
- Interpretive Complexity: Analyzing narratives requires dealing with the complexities of meaning and interpretation.
- Time-consuming: Because of the richness and complexities of tales, working with them can be time-consuming.
Example of Narrative Analysis
Assume you’re conducting narrative analysis on refugee interviews. As you read the stories, you’ll notice common themes of toughness, loss, and hope. The narratives provide insight into the obstacles that refugees face, their strengths, and the dreams that guide them.
The analysis can provide a deeper insight into the refugees’ experiences and the broader social context they navigate by examining the narratives’ emotional subtleties and underlying meanings. This example highlights how narrative analysis can reveal important insights into human stories.
Method 4: Grounded Theory Analysis
Grounded theory analysis is an iterative and systematic approach that allows you to create theories directly from data without being limited by pre-existing hypotheses. With an open mind, you collect data and generate early codes and labels that capture essential ideas or concepts within the data.
As you progress, you refine these codes and increasingly connect them, eventually developing a theory based on the data. Grounded theory analysis is a dynamic process for developing new insights and hypotheses based on details in your data.
Steps to Do Grounded Theory Analysis
Grounded theory analysis requires the following steps:
- Initial Coding: First, immerse yourself in the data, producing initial codes that represent major concepts or patterns.
- Categorize and Connect: Using axial coding, organize the initial codes, which establish relationships and connections between topics.
- Build the Theory: Focus on creating a core category that connects the codes and themes. Regularly refine the theory by comparing and integrating new data, ensuring that it evolves organically from the data.
Grounded theory analysis has various benefits:
- Theory Generation: It provides a one-of-a-kind opportunity to generate hypotheses straight from data and promotes new insights.
- In-depth Understanding: The analysis allows you to deeply analyze the data and reveal complex relationships and patterns.
- Flexible Process: This method is customizable and ongoing, which allows you to enhance your research as you collect additional data.
However, challenges might arise with:
- Time and Resources: Because grounded theory analysis is a continuous process, it requires a large commitment of time and resources.
- Theoretical Development: Creating a grounded theory involves a thorough understanding of qualitative data analysis software and theoretical concepts.
- Interpretation of Complexity: Interpreting and incorporating a newly developed theory into existing literature can be intellectually hard.
Example of Grounded Theory Analysis
Assume you’re performing a grounded theory analysis on workplace collaboration interviews. As you open code the data, you will discover notions such as “communication barriers,” “team dynamics,” and “leadership roles.” Axial coding demonstrates links between these notions, emphasizing the significance of efficient communication in developing collaboration.
You create the core “Integrated Communication Strategies” category through selective coding, which unifies new topics.
This theory-driven category serves as the framework for understanding how numerous aspects contribute to effective team collaboration. This example shows how grounded theory analysis allows you to generate a theory directly from the inherent nature of the data.
Method 5: Discourse Analysis
Discourse analysis focuses on language and communication. You’ll look at how language produces meaning and how it reflects power relations, identities, and cultural influences. This strategy examines what is said and how it is said; the words, phrasing, and larger context of communication.
The analysis is precious when investigating power dynamics, identities, and cultural influences encoded in language. By evaluating the language used in your data, you can identify underlying assumptions, cultural standards, and how individuals negotiate meaning through communication.
Steps to Do Discourse Analysis
Conducting discourse analysis entails the following steps:
- Select Discourse: For analysis, choose language-based data such as texts, speeches, or media content.
- Analyze Language: Immerse yourself in the conversation, examining language choices, metaphors, and underlying assumptions.
- Discover Patterns: Recognize the dialogue’s reoccurring themes, ideologies, and power dynamics. To fully understand the effects of these patterns, put them in their larger context.
There are various advantages of using discourse analysis:
- Understanding Language: It provides an extensive understanding of how language builds meaning and influences perceptions.
- Uncovering Power Dynamics: The analysis reveals how power dynamics appear via language.
- Cultural Insights: This method identifies cultural norms, beliefs, and ideologies stored in communication.
However, the following challenges may arise:
- Complexity of Interpretation: Language analysis involves navigating multiple levels of nuance and interpretation.
- Subjectivity: Interpretation can be subjective, so controlling researcher bias is important.
- Time-Intensive: Discourse analysis can take a lot of time because careful linguistic study is required in this analysis.
Example of Discourse Analysis
Consider doing discourse analysis on media coverage of a political event. You notice repeating linguistic patterns in news articles that depict the event as a conflict between opposing parties. Through deconstruction, you can expose how this framing supports particular ideologies and power relations.
You can illustrate how language choices influence public perceptions and contribute to building the narrative around the event by analyzing the speech within the broader political and social context. This example shows how discourse analysis can reveal hidden power dynamics and cultural influences on communication.
How to do Qualitative Data Analysis with the QuestionPro Research suite?
QuestionPro is a popular survey and research platform that offers tools for collecting and analyzing qualitative and quantitative data. Follow these general steps for conducting qualitative data analysis using the QuestionPro Research Suite:
- Collect Qualitative Data: Set up your survey to capture qualitative responses. It might involve open-ended questions, text boxes, or comment sections where participants can provide detailed responses.
- Export Qualitative Responses: Export the responses once you’ve collected qualitative data through your survey. QuestionPro typically allows you to export survey data in various formats, such as Excel or CSV.
- Prepare Data for Analysis: Review the exported data and clean it if necessary. Remove irrelevant or duplicate entries to ensure your data is ready for analysis.
- Code and Categorize Responses: Segment and label data, letting new patterns emerge naturally, then develop categories through axial coding to structure the analysis.
- Identify Themes: Analyze the coded responses to identify recurring themes, patterns, and insights. Look for similarities and differences in participants’ responses.
- Generate Reports and Visualizations: Utilize the reporting features of QuestionPro to create visualizations, charts, and graphs that help communicate the themes and findings from your qualitative research.
- Interpret and Draw Conclusions: Interpret the themes and patterns you’ve identified in the qualitative data. Consider how these findings answer your research questions or provide insights into your study topic.
- Integrate with Quantitative Data (if applicable): If you’re also conducting quantitative research using QuestionPro, consider integrating your qualitative findings with quantitative results to provide a more comprehensive understanding.
Qualitative data analysis is vital in uncovering various human experiences, views, and stories. If you’re ready to transform your research journey and apply the power of qualitative analysis, now is the moment to do it. Book a demo with QuestionPro today and begin your journey of exploration.
LEARN MORE FREE TRIAL
MORE LIKE THIS

Jotform vs SurveyMonkey: Which Is Best in 2024
Aug 15, 2024
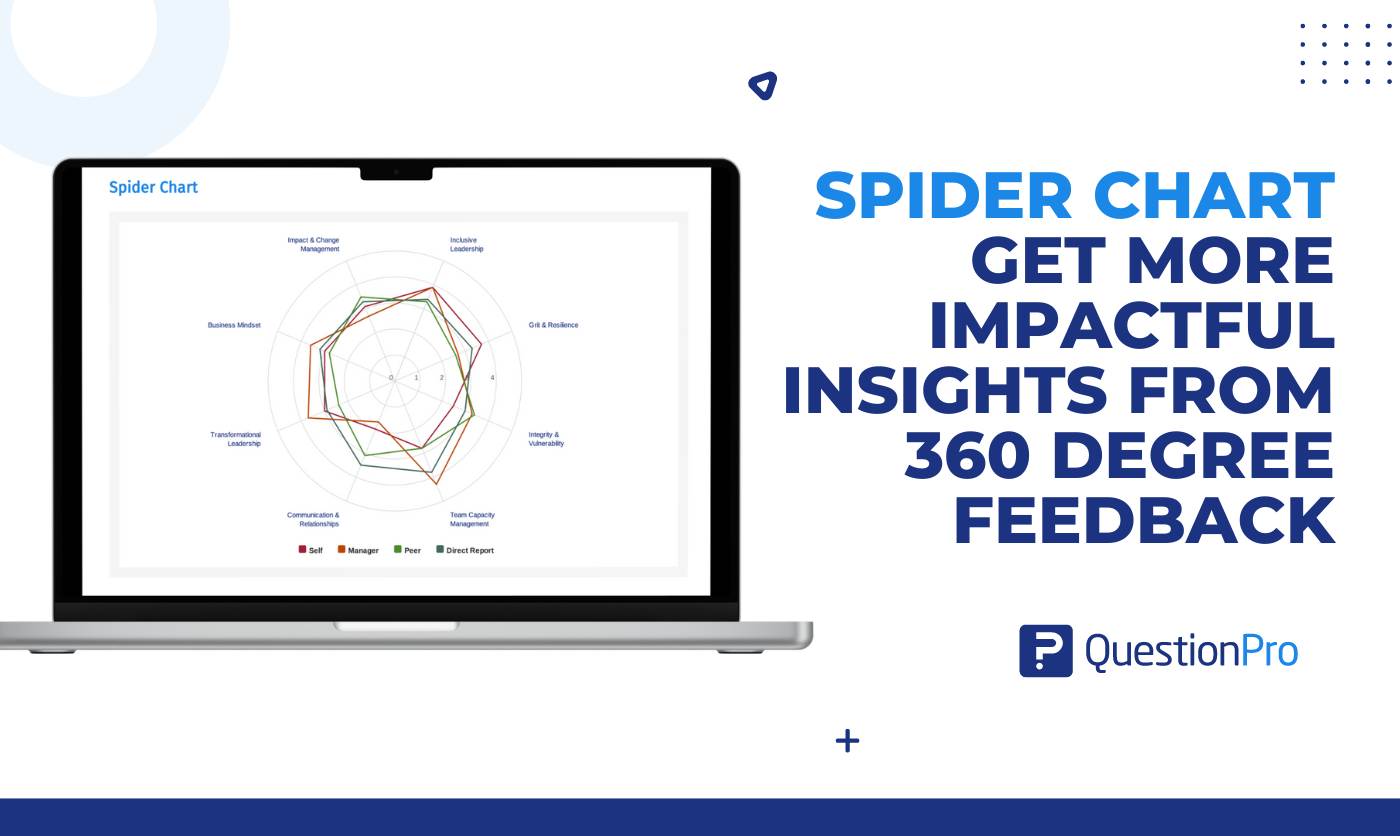
360 Degree Feedback Spider Chart is Back!
Aug 14, 2024

Jotform vs Wufoo: Comparison of Features and Prices
Aug 13, 2024
Product or Service: Which is More Important? — Tuesday CX Thoughts
Other categories.
- Academic Research
- Artificial Intelligence
- Assessments
- Brand Awareness
- Case Studies
- Communities
- Consumer Insights
- Customer effort score
- Customer Engagement
- Customer Experience
- Customer Loyalty
- Customer Research
- Customer Satisfaction
- Employee Benefits
- Employee Engagement
- Employee Retention
- Friday Five
- General Data Protection Regulation
- Insights Hub
- Life@QuestionPro
- Market Research
- Mobile diaries
- Mobile Surveys
- New Features
- Online Communities
- Question Types
- Questionnaire
- QuestionPro Products
- Release Notes
- Research Tools and Apps
- Revenue at Risk
- Survey Templates
- Training Tips
- Tuesday CX Thoughts (TCXT)
- Uncategorized
- What’s Coming Up
- Workforce Intelligence
- AI & NLP
- Churn & Loyalty
- Customer Experience
- Customer Journeys
- Customer Metrics
- Feedback Analysis
- Product Experience
- Product Updates
- Sentiment Analysis
- Surveys & Feedback Collection
- Text Analytics
- Try Thematic
Welcome to the community

Qualitative Data Analysis: Step-by-Step Guide (Manual vs. Automatic)
When we conduct qualitative methods of research, need to explain changes in metrics or understand people's opinions, we always turn to qualitative data. Qualitative data is typically generated through:
- Interview transcripts
- Surveys with open-ended questions
- Contact center transcripts
- Texts and documents
- Audio and video recordings
- Observational notes
Compared to quantitative data, which captures structured information, qualitative data is unstructured and has more depth. It can answer our questions, can help formulate hypotheses and build understanding.
It's important to understand the differences between quantitative data & qualitative data . But unfortunately, analyzing qualitative data is difficult. While tools like Excel, Tableau and PowerBI crunch and visualize quantitative data with ease, there are a limited number of mainstream tools for analyzing qualitative data . The majority of qualitative data analysis still happens manually.
That said, there are two new trends that are changing this. First, there are advances in natural language processing (NLP) which is focused on understanding human language. Second, there is an explosion of user-friendly software designed for both researchers and businesses. Both help automate the qualitative data analysis process.
In this post we want to teach you how to conduct a successful qualitative data analysis. There are two primary qualitative data analysis methods; manual & automatic. We will teach you how to conduct the analysis manually, and also, automatically using software solutions powered by NLP. We’ll guide you through the steps to conduct a manual analysis, and look at what is involved and the role technology can play in automating this process.
More businesses are switching to fully-automated analysis of qualitative customer data because it is cheaper, faster, and just as accurate. Primarily, businesses purchase subscriptions to feedback analytics platforms so that they can understand customer pain points and sentiment.

We’ll take you through 5 steps to conduct a successful qualitative data analysis. Within each step we will highlight the key difference between the manual, and automated approach of qualitative researchers. Here's an overview of the steps:
The 5 steps to doing qualitative data analysis
- Gathering and collecting your qualitative data
- Organizing and connecting into your qualitative data
- Coding your qualitative data
- Analyzing the qualitative data for insights
- Reporting on the insights derived from your analysis
What is Qualitative Data Analysis?
Qualitative data analysis is a process of gathering, structuring and interpreting qualitative data to understand what it represents.
Qualitative data is non-numerical and unstructured. Qualitative data generally refers to text, such as open-ended responses to survey questions or user interviews, but also includes audio, photos and video.
Businesses often perform qualitative data analysis on customer feedback. And within this context, qualitative data generally refers to verbatim text data collected from sources such as reviews, complaints, chat messages, support centre interactions, customer interviews, case notes or social media comments.
How is qualitative data analysis different from quantitative data analysis?
Understanding the differences between quantitative & qualitative data is important. When it comes to analyzing data, Qualitative Data Analysis serves a very different role to Quantitative Data Analysis. But what sets them apart?
Qualitative Data Analysis dives into the stories hidden in non-numerical data such as interviews, open-ended survey answers, or notes from observations. It uncovers the ‘whys’ and ‘hows’ giving a deep understanding of people’s experiences and emotions.
Quantitative Data Analysis on the other hand deals with numerical data, using statistics to measure differences, identify preferred options, and pinpoint root causes of issues. It steps back to address questions like "how many" or "what percentage" to offer broad insights we can apply to larger groups.
In short, Qualitative Data Analysis is like a microscope, helping us understand specific detail. Quantitative Data Analysis is like the telescope, giving us a broader perspective. Both are important, working together to decode data for different objectives.
Qualitative Data Analysis methods
Once all the data has been captured, there are a variety of analysis techniques available and the choice is determined by your specific research objectives and the kind of data you’ve gathered. Common qualitative data analysis methods include:
Content Analysis
This is a popular approach to qualitative data analysis. Other qualitative analysis techniques may fit within the broad scope of content analysis. Thematic analysis is a part of the content analysis. Content analysis is used to identify the patterns that emerge from text, by grouping content into words, concepts, and themes. Content analysis is useful to quantify the relationship between all of the grouped content. The Columbia School of Public Health has a detailed breakdown of content analysis .
Narrative Analysis
Narrative analysis focuses on the stories people tell and the language they use to make sense of them. It is particularly useful in qualitative research methods where customer stories are used to get a deep understanding of customers’ perspectives on a specific issue. A narrative analysis might enable us to summarize the outcomes of a focused case study.
Discourse Analysis
Discourse analysis is used to get a thorough understanding of the political, cultural and power dynamics that exist in specific situations. The focus of discourse analysis here is on the way people express themselves in different social contexts. Discourse analysis is commonly used by brand strategists who hope to understand why a group of people feel the way they do about a brand or product.
Thematic Analysis
Thematic analysis is used to deduce the meaning behind the words people use. This is accomplished by discovering repeating themes in text. These meaningful themes reveal key insights into data and can be quantified, particularly when paired with sentiment analysis . Often, the outcome of thematic analysis is a code frame that captures themes in terms of codes, also called categories. So the process of thematic analysis is also referred to as “coding”. A common use-case for thematic analysis in companies is analysis of customer feedback.
Grounded Theory
Grounded theory is a useful approach when little is known about a subject. Grounded theory starts by formulating a theory around a single data case. This means that the theory is “grounded”. Grounded theory analysis is based on actual data, and not entirely speculative. Then additional cases can be examined to see if they are relevant and can add to the original grounded theory.

Challenges of Qualitative Data Analysis
While Qualitative Data Analysis offers rich insights, it comes with its challenges. Each unique QDA method has its unique hurdles. Let’s take a look at the challenges researchers and analysts might face, depending on the chosen method.
- Time and Effort (Narrative Analysis): Narrative analysis, which focuses on personal stories, demands patience. Sifting through lengthy narratives to find meaningful insights can be time-consuming, requires dedicated effort.
- Being Objective (Grounded Theory): Grounded theory, building theories from data, faces the challenges of personal biases. Staying objective while interpreting data is crucial, ensuring conclusions are rooted in the data itself.
- Complexity (Thematic Analysis): Thematic analysis involves identifying themes within data, a process that can be intricate. Categorizing and understanding themes can be complex, especially when each piece of data varies in context and structure. Thematic Analysis software can simplify this process.
- Generalizing Findings (Narrative Analysis): Narrative analysis, dealing with individual stories, makes drawing broad challenging. Extending findings from a single narrative to a broader context requires careful consideration.
- Managing Data (Thematic Analysis): Thematic analysis involves organizing and managing vast amounts of unstructured data, like interview transcripts. Managing this can be a hefty task, requiring effective data management strategies.
- Skill Level (Grounded Theory): Grounded theory demands specific skills to build theories from the ground up. Finding or training analysts with these skills poses a challenge, requiring investment in building expertise.
Benefits of qualitative data analysis
Qualitative Data Analysis (QDA) is like a versatile toolkit, offering a tailored approach to understanding your data. The benefits it offers are as diverse as the methods. Let’s explore why choosing the right method matters.
- Tailored Methods for Specific Needs: QDA isn't one-size-fits-all. Depending on your research objectives and the type of data at hand, different methods offer unique benefits. If you want emotive customer stories, narrative analysis paints a strong picture. When you want to explain a score, thematic analysis reveals insightful patterns
- Flexibility with Thematic Analysis: thematic analysis is like a chameleon in the toolkit of QDA. It adapts well to different types of data and research objectives, making it a top choice for any qualitative analysis.
- Deeper Understanding, Better Products: QDA helps you dive into people's thoughts and feelings. This deep understanding helps you build products and services that truly matches what people want, ensuring satisfied customers
- Finding the Unexpected: Qualitative data often reveals surprises that we miss in quantitative data. QDA offers us new ideas and perspectives, for insights we might otherwise miss.
- Building Effective Strategies: Insights from QDA are like strategic guides. They help businesses in crafting plans that match people’s desires.
- Creating Genuine Connections: Understanding people’s experiences lets businesses connect on a real level. This genuine connection helps build trust and loyalty, priceless for any business.
How to do Qualitative Data Analysis: 5 steps
Now we are going to show how you can do your own qualitative data analysis. We will guide you through this process step by step. As mentioned earlier, you will learn how to do qualitative data analysis manually , and also automatically using modern qualitative data and thematic analysis software.
To get best value from the analysis process and research process, it’s important to be super clear about the nature and scope of the question that’s being researched. This will help you select the research collection channels that are most likely to help you answer your question.
Depending on if you are a business looking to understand customer sentiment, or an academic surveying a school, your approach to qualitative data analysis will be unique.
Once you’re clear, there’s a sequence to follow. And, though there are differences in the manual and automatic approaches, the process steps are mostly the same.
The use case for our step-by-step guide is a company looking to collect data (customer feedback data), and analyze the customer feedback - in order to improve customer experience. By analyzing the customer feedback the company derives insights about their business and their customers. You can follow these same steps regardless of the nature of your research. Let’s get started.
Step 1: Gather your qualitative data and conduct research (Conduct qualitative research)
The first step of qualitative research is to do data collection. Put simply, data collection is gathering all of your data for analysis. A common situation is when qualitative data is spread across various sources.
Classic methods of gathering qualitative data
Most companies use traditional methods for gathering qualitative data: conducting interviews with research participants, running surveys, and running focus groups. This data is typically stored in documents, CRMs, databases and knowledge bases. It’s important to examine which data is available and needs to be included in your research project, based on its scope.
Using your existing qualitative feedback
As it becomes easier for customers to engage across a range of different channels, companies are gathering increasingly large amounts of both solicited and unsolicited qualitative feedback.
Most organizations have now invested in Voice of Customer programs , support ticketing systems, chatbot and support conversations, emails and even customer Slack chats.
These new channels provide companies with new ways of getting feedback, and also allow the collection of unstructured feedback data at scale.
The great thing about this data is that it contains a wealth of valubale insights and that it’s already there! When you have a new question about user behavior or your customers, you don’t need to create a new research study or set up a focus group. You can find most answers in the data you already have.
Typically, this data is stored in third-party solutions or a central database, but there are ways to export it or connect to a feedback analysis solution through integrations or an API.
Utilize untapped qualitative data channels
There are many online qualitative data sources you may not have considered. For example, you can find useful qualitative data in social media channels like Twitter or Facebook. Online forums, review sites, and online communities such as Discourse or Reddit also contain valuable data about your customers, or research questions.
If you are considering performing a qualitative benchmark analysis against competitors - the internet is your best friend, and review analysis is a great place to start. Gathering feedback in competitor reviews on sites like Trustpilot, G2, Capterra, Better Business Bureau or on app stores is a great way to perform a competitor benchmark analysis.
Customer feedback analysis software often has integrations into social media and review sites, or you could use a solution like DataMiner to scrape the reviews.

Step 2: Connect & organize all your qualitative data
Now you all have this qualitative data but there’s a problem, the data is unstructured. Before feedback can be analyzed and assigned any value, it needs to be organized in a single place. Why is this important? Consistency!
If all data is easily accessible in one place and analyzed in a consistent manner, you will have an easier time summarizing and making decisions based on this data.
The manual approach to organizing your data
The classic method of structuring qualitative data is to plot all the raw data you’ve gathered into a spreadsheet.
Typically, research and support teams would share large Excel sheets and different business units would make sense of the qualitative feedback data on their own. Each team collects and organizes the data in a way that best suits them, which means the feedback tends to be kept in separate silos.
An alternative and a more robust solution is to store feedback in a central database, like Snowflake or Amazon Redshift .
Keep in mind that when you organize your data in this way, you are often preparing it to be imported into another software. If you go the route of a database, you would need to use an API to push the feedback into a third-party software.
Computer-assisted qualitative data analysis software (CAQDAS)
Traditionally within the manual analysis approach (but not always), qualitative data is imported into CAQDAS software for coding.
In the early 2000s, CAQDAS software was popularised by developers such as ATLAS.ti, NVivo and MAXQDA and eagerly adopted by researchers to assist with the organizing and coding of data.
The benefits of using computer-assisted qualitative data analysis software:
- Assists in the organizing of your data
- Opens you up to exploring different interpretations of your data analysis
- Allows you to share your dataset easier and allows group collaboration (allows for secondary analysis)
However you still need to code the data, uncover the themes and do the analysis yourself. Therefore it is still a manual approach.

Organizing your qualitative data in a feedback repository
Another solution to organizing your qualitative data is to upload it into a feedback repository where it can be unified with your other data , and easily searchable and taggable. There are a number of software solutions that act as a central repository for your qualitative research data. Here are a couple solutions that you could investigate:
- Dovetail: Dovetail is a research repository with a focus on video and audio transcriptions. You can tag your transcriptions within the platform for theme analysis. You can also upload your other qualitative data such as research reports, survey responses, support conversations ( conversational analytics ), and customer interviews. Dovetail acts as a single, searchable repository. And makes it easier to collaborate with other people around your qualitative research.
- EnjoyHQ: EnjoyHQ is another research repository with similar functionality to Dovetail. It boasts a more sophisticated search engine, but it has a higher starting subscription cost.
Organizing your qualitative data in a feedback analytics platform
If you have a lot of qualitative customer or employee feedback, from the likes of customer surveys or employee surveys, you will benefit from a feedback analytics platform. A feedback analytics platform is a software that automates the process of both sentiment analysis and thematic analysis . Companies use the integrations offered by these platforms to directly tap into their qualitative data sources (review sites, social media, survey responses, etc.). The data collected is then organized and analyzed consistently within the platform.
If you have data prepared in a spreadsheet, it can also be imported into feedback analytics platforms.
Once all this rich data has been organized within the feedback analytics platform, it is ready to be coded and themed, within the same platform. Thematic is a feedback analytics platform that offers one of the largest libraries of integrations with qualitative data sources.

Step 3: Coding your qualitative data
Your feedback data is now organized in one place. Either within your spreadsheet, CAQDAS, feedback repository or within your feedback analytics platform. The next step is to code your feedback data so we can extract meaningful insights in the next step.
Coding is the process of labelling and organizing your data in such a way that you can then identify themes in the data, and the relationships between these themes.
To simplify the coding process, you will take small samples of your customer feedback data, come up with a set of codes, or categories capturing themes, and label each piece of feedback, systematically, for patterns and meaning. Then you will take a larger sample of data, revising and refining the codes for greater accuracy and consistency as you go.
If you choose to use a feedback analytics platform, much of this process will be automated and accomplished for you.
The terms to describe different categories of meaning (‘theme’, ‘code’, ‘tag’, ‘category’ etc) can be confusing as they are often used interchangeably. For clarity, this article will use the term ‘code’.
To code means to identify key words or phrases and assign them to a category of meaning. “I really hate the customer service of this computer software company” would be coded as “poor customer service”.
How to manually code your qualitative data
- Decide whether you will use deductive or inductive coding. Deductive coding is when you create a list of predefined codes, and then assign them to the qualitative data. Inductive coding is the opposite of this, you create codes based on the data itself. Codes arise directly from the data and you label them as you go. You need to weigh up the pros and cons of each coding method and select the most appropriate.
- Read through the feedback data to get a broad sense of what it reveals. Now it’s time to start assigning your first set of codes to statements and sections of text.
- Keep repeating step 2, adding new codes and revising the code description as often as necessary. Once it has all been coded, go through everything again, to be sure there are no inconsistencies and that nothing has been overlooked.
- Create a code frame to group your codes. The coding frame is the organizational structure of all your codes. And there are two commonly used types of coding frames, flat, or hierarchical. A hierarchical code frame will make it easier for you to derive insights from your analysis.
- Based on the number of times a particular code occurs, you can now see the common themes in your feedback data. This is insightful! If ‘bad customer service’ is a common code, it’s time to take action.
We have a detailed guide dedicated to manually coding your qualitative data .

Using software to speed up manual coding of qualitative data
An Excel spreadsheet is still a popular method for coding. But various software solutions can help speed up this process. Here are some examples.
- CAQDAS / NVivo - CAQDAS software has built-in functionality that allows you to code text within their software. You may find the interface the software offers easier for managing codes than a spreadsheet.
- Dovetail/EnjoyHQ - You can tag transcripts and other textual data within these solutions. As they are also repositories you may find it simpler to keep the coding in one platform.
- IBM SPSS - SPSS is a statistical analysis software that may make coding easier than in a spreadsheet.
- Ascribe - Ascribe’s ‘Coder’ is a coding management system. Its user interface will make it easier for you to manage your codes.
Automating the qualitative coding process using thematic analysis software
In solutions which speed up the manual coding process, you still have to come up with valid codes and often apply codes manually to pieces of feedback. But there are also solutions that automate both the discovery and the application of codes.
Advances in machine learning have now made it possible to read, code and structure qualitative data automatically. This type of automated coding is offered by thematic analysis software .
Automation makes it far simpler and faster to code the feedback and group it into themes. By incorporating natural language processing (NLP) into the software, the AI looks across sentences and phrases to identify common themes meaningful statements. Some automated solutions detect repeating patterns and assign codes to them, others make you train the AI by providing examples. You could say that the AI learns the meaning of the feedback on its own.
Thematic automates the coding of qualitative feedback regardless of source. There’s no need to set up themes or categories in advance. Simply upload your data and wait a few minutes. You can also manually edit the codes to further refine their accuracy. Experiments conducted indicate that Thematic’s automated coding is just as accurate as manual coding .
Paired with sentiment analysis and advanced text analytics - these automated solutions become powerful for deriving quality business or research insights.
You could also build your own , if you have the resources!
The key benefits of using an automated coding solution
Automated analysis can often be set up fast and there’s the potential to uncover things that would never have been revealed if you had given the software a prescribed list of themes to look for.
Because the model applies a consistent rule to the data, it captures phrases or statements that a human eye might have missed.
Complete and consistent analysis of customer feedback enables more meaningful findings. Leading us into step 4.
Step 4: Analyze your data: Find meaningful insights
Now we are going to analyze our data to find insights. This is where we start to answer our research questions. Keep in mind that step 4 and step 5 (tell the story) have some overlap . This is because creating visualizations is both part of analysis process and reporting.
The task of uncovering insights is to scour through the codes that emerge from the data and draw meaningful correlations from them. It is also about making sure each insight is distinct and has enough data to support it.
Part of the analysis is to establish how much each code relates to different demographics and customer profiles, and identify whether there’s any relationship between these data points.
Manually create sub-codes to improve the quality of insights
If your code frame only has one level, you may find that your codes are too broad to be able to extract meaningful insights. This is where it is valuable to create sub-codes to your primary codes. This process is sometimes referred to as meta coding.
Note: If you take an inductive coding approach, you can create sub-codes as you are reading through your feedback data and coding it.
While time-consuming, this exercise will improve the quality of your analysis. Here is an example of what sub-codes could look like.

You need to carefully read your qualitative data to create quality sub-codes. But as you can see, the depth of analysis is greatly improved. By calculating the frequency of these sub-codes you can get insight into which customer service problems you can immediately address.
Correlate the frequency of codes to customer segments
Many businesses use customer segmentation . And you may have your own respondent segments that you can apply to your qualitative analysis. Segmentation is the practise of dividing customers or research respondents into subgroups.
Segments can be based on:
- Demographic
- And any other data type that you care to segment by
It is particularly useful to see the occurrence of codes within your segments. If one of your customer segments is considered unimportant to your business, but they are the cause of nearly all customer service complaints, it may be in your best interest to focus attention elsewhere. This is a useful insight!
Manually visualizing coded qualitative data
There are formulas you can use to visualize key insights in your data. The formulas we will suggest are imperative if you are measuring a score alongside your feedback.
If you are collecting a metric alongside your qualitative data this is a key visualization. Impact answers the question: “What’s the impact of a code on my overall score?”. Using Net Promoter Score (NPS) as an example, first you need to:
- Calculate overall NPS
- Calculate NPS in the subset of responses that do not contain that theme
- Subtract B from A
Then you can use this simple formula to calculate code impact on NPS .

You can then visualize this data using a bar chart.
You can download our CX toolkit - it includes a template to recreate this.
Trends over time
This analysis can help you answer questions like: “Which codes are linked to decreases or increases in my score over time?”
We need to compare two sequences of numbers: NPS over time and code frequency over time . Using Excel, calculate the correlation between the two sequences, which can be either positive (the more codes the higher the NPS, see picture below), or negative (the more codes the lower the NPS).
Now you need to plot code frequency against the absolute value of code correlation with NPS. Here is the formula:

The visualization could look like this:

These are two examples, but there are more. For a third manual formula, and to learn why word clouds are not an insightful form of analysis, read our visualizations article .
Using a text analytics solution to automate analysis
Automated text analytics solutions enable codes and sub-codes to be pulled out of the data automatically. This makes it far faster and easier to identify what’s driving negative or positive results. And to pick up emerging trends and find all manner of rich insights in the data.
Another benefit of AI-driven text analytics software is its built-in capability for sentiment analysis, which provides the emotive context behind your feedback and other qualitative textual data therein.
Thematic provides text analytics that goes further by allowing users to apply their expertise on business context to edit or augment the AI-generated outputs.
Since the move away from manual research is generally about reducing the human element, adding human input to the technology might sound counter-intuitive. However, this is mostly to make sure important business nuances in the feedback aren’t missed during coding. The result is a higher accuracy of analysis. This is sometimes referred to as augmented intelligence .

Step 5: Report on your data: Tell the story
The last step of analyzing your qualitative data is to report on it, to tell the story. At this point, the codes are fully developed and the focus is on communicating the narrative to the audience.
A coherent outline of the qualitative research, the findings and the insights is vital for stakeholders to discuss and debate before they can devise a meaningful course of action.
Creating graphs and reporting in Powerpoint
Typically, qualitative researchers take the tried and tested approach of distilling their report into a series of charts, tables and other visuals which are woven into a narrative for presentation in Powerpoint.
Using visualization software for reporting
With data transformation and APIs, the analyzed data can be shared with data visualisation software, such as Power BI or Tableau , Google Studio or Looker. Power BI and Tableau are among the most preferred options.
Visualizing your insights inside a feedback analytics platform
Feedback analytics platforms, like Thematic, incorporate visualisation tools that intuitively turn key data and insights into graphs. This removes the time consuming work of constructing charts to visually identify patterns and creates more time to focus on building a compelling narrative that highlights the insights, in bite-size chunks, for executive teams to review.
Using a feedback analytics platform with visualization tools means you don’t have to use a separate product for visualizations. You can export graphs into Powerpoints straight from the platforms.

Conclusion - Manual or Automated?
There are those who remain deeply invested in the manual approach - because it’s familiar, because they’re reluctant to spend money and time learning new software, or because they’ve been burned by the overpromises of AI.
For projects that involve small datasets, manual analysis makes sense. For example, if the objective is simply to quantify a simple question like “Do customers prefer X concepts to Y?”. If the findings are being extracted from a small set of focus groups and interviews, sometimes it’s easier to just read them
However, as new generations come into the workplace, it’s technology-driven solutions that feel more comfortable and practical. And the merits are undeniable. Especially if the objective is to go deeper and understand the ‘why’ behind customers’ preference for X or Y. And even more especially if time and money are considerations.
The ability to collect a free flow of qualitative feedback data at the same time as the metric means AI can cost-effectively scan, crunch, score and analyze a ton of feedback from one system in one go. And time-intensive processes like focus groups, or coding, that used to take weeks, can now be completed in a matter of hours or days.
But aside from the ever-present business case to speed things up and keep costs down, there are also powerful research imperatives for automated analysis of qualitative data: namely, accuracy and consistency.
Finding insights hidden in feedback requires consistency, especially in coding. Not to mention catching all the ‘unknown unknowns’ that can skew research findings and steering clear of cognitive bias.
Some say without manual data analysis researchers won’t get an accurate “feel” for the insights. However, the larger data sets are, the harder it is to sort through the feedback and organize feedback that has been pulled from different places. And, the more difficult it is to stay on course, the greater the risk of drawing incorrect, or incomplete, conclusions grows.
Though the process steps for qualitative data analysis have remained pretty much unchanged since psychologist Paul Felix Lazarsfeld paved the path a hundred years ago, the impact digital technology has had on types of qualitative feedback data and the approach to the analysis are profound.
If you want to try an automated feedback analysis solution on your own qualitative data, you can get started with Thematic .

Community & Marketing
Tyler manages our community of CX, insights & analytics professionals. Tyler's goal is to help unite insights professionals around common challenges.
We make it easy to discover the customer and product issues that matter.
Unlock the value of feedback at scale, in one platform. Try it for free now!
- Questions to ask your Feedback Analytics vendor
- How to end customer churn for good
- Scalable analysis of NPS verbatims
- 5 Text analytics approaches
- How to calculate the ROI of CX
Our experts will show you how Thematic works, how to discover pain points and track the ROI of decisions. To access your free trial, book a personal demo today.
Recent posts
Become a qualitative theming pro! Creating a perfect code frame is hard, but thematic analysis software makes the process much easier.
Discover the power of thematic analysis to unlock insights from qualitative data. Learn about manual vs. AI-powered approaches, best practices, and how Thematic software can revolutionize your analysis workflow.
When two major storms wreaked havoc on Auckland and Watercare’s infrastructurem the utility went through a CX crisis. With a massive influx of calls to their support center, Thematic helped them get inisghts from this data to forge a new approach to restore services and satisfaction levels.
Qualitative Data Analysis Methods 101:
The “big 6” methods + examples.
By: Kerryn Warren (PhD) | Reviewed By: Eunice Rautenbach (D.Tech) | May 2020 (Updated April 2023)
Qualitative data analysis methods. Wow, that’s a mouthful.
If you’re new to the world of research, qualitative data analysis can look rather intimidating. So much bulky terminology and so many abstract, fluffy concepts. It certainly can be a minefield!
Don’t worry – in this post, we’ll unpack the most popular analysis methods , one at a time, so that you can approach your analysis with confidence and competence – whether that’s for a dissertation, thesis or really any kind of research project.

What (exactly) is qualitative data analysis?
To understand qualitative data analysis, we need to first understand qualitative data – so let’s step back and ask the question, “what exactly is qualitative data?”.
Qualitative data refers to pretty much any data that’s “not numbers” . In other words, it’s not the stuff you measure using a fixed scale or complex equipment, nor do you analyse it using complex statistics or mathematics.
So, if it’s not numbers, what is it?
Words, you guessed? Well… sometimes , yes. Qualitative data can, and often does, take the form of interview transcripts, documents and open-ended survey responses – but it can also involve the interpretation of images and videos. In other words, qualitative isn’t just limited to text-based data.
So, how’s that different from quantitative data, you ask?
Simply put, qualitative research focuses on words, descriptions, concepts or ideas – while quantitative research focuses on numbers and statistics . Qualitative research investigates the “softer side” of things to explore and describe , while quantitative research focuses on the “hard numbers”, to measure differences between variables and the relationships between them. If you’re keen to learn more about the differences between qual and quant, we’ve got a detailed post over here .

So, qualitative analysis is easier than quantitative, right?
Not quite. In many ways, qualitative data can be challenging and time-consuming to analyse and interpret. At the end of your data collection phase (which itself takes a lot of time), you’ll likely have many pages of text-based data or hours upon hours of audio to work through. You might also have subtle nuances of interactions or discussions that have danced around in your mind, or that you scribbled down in messy field notes. All of this needs to work its way into your analysis.
Making sense of all of this is no small task and you shouldn’t underestimate it. Long story short – qualitative analysis can be a lot of work! Of course, quantitative analysis is no piece of cake either, but it’s important to recognise that qualitative analysis still requires a significant investment in terms of time and effort.
Need a helping hand?
In this post, we’ll explore qualitative data analysis by looking at some of the most common analysis methods we encounter. We’re not going to cover every possible qualitative method and we’re not going to go into heavy detail – we’re just going to give you the big picture. That said, we will of course includes links to loads of extra resources so that you can learn more about whichever analysis method interests you.
Without further delay, let’s get into it.
The “Big 6” Qualitative Analysis Methods
There are many different types of qualitative data analysis, all of which serve different purposes and have unique strengths and weaknesses . We’ll start by outlining the analysis methods and then we’ll dive into the details for each.
The 6 most popular methods (or at least the ones we see at Grad Coach) are:
- Content analysis
- Narrative analysis
- Discourse analysis
- Thematic analysis
- Grounded theory (GT)
- Interpretive phenomenological analysis (IPA)
Let’s take a look at each of them…
QDA Method #1: Qualitative Content Analysis
Content analysis is possibly the most common and straightforward QDA method. At the simplest level, content analysis is used to evaluate patterns within a piece of content (for example, words, phrases or images) or across multiple pieces of content or sources of communication. For example, a collection of newspaper articles or political speeches.
With content analysis, you could, for instance, identify the frequency with which an idea is shared or spoken about – like the number of times a Kardashian is mentioned on Twitter. Or you could identify patterns of deeper underlying interpretations – for instance, by identifying phrases or words in tourist pamphlets that highlight India as an ancient country.
Because content analysis can be used in such a wide variety of ways, it’s important to go into your analysis with a very specific question and goal, or you’ll get lost in the fog. With content analysis, you’ll group large amounts of text into codes , summarise these into categories, and possibly even tabulate the data to calculate the frequency of certain concepts or variables. Because of this, content analysis provides a small splash of quantitative thinking within a qualitative method.
Naturally, while content analysis is widely useful, it’s not without its drawbacks . One of the main issues with content analysis is that it can be very time-consuming , as it requires lots of reading and re-reading of the texts. Also, because of its multidimensional focus on both qualitative and quantitative aspects, it is sometimes accused of losing important nuances in communication.
Content analysis also tends to concentrate on a very specific timeline and doesn’t take into account what happened before or after that timeline. This isn’t necessarily a bad thing though – just something to be aware of. So, keep these factors in mind if you’re considering content analysis. Every analysis method has its limitations , so don’t be put off by these – just be aware of them ! If you’re interested in learning more about content analysis, the video below provides a good starting point.
QDA Method #2: Narrative Analysis
As the name suggests, narrative analysis is all about listening to people telling stories and analysing what that means . Since stories serve a functional purpose of helping us make sense of the world, we can gain insights into the ways that people deal with and make sense of reality by analysing their stories and the ways they’re told.
You could, for example, use narrative analysis to explore whether how something is being said is important. For instance, the narrative of a prisoner trying to justify their crime could provide insight into their view of the world and the justice system. Similarly, analysing the ways entrepreneurs talk about the struggles in their careers or cancer patients telling stories of hope could provide powerful insights into their mindsets and perspectives . Simply put, narrative analysis is about paying attention to the stories that people tell – and more importantly, the way they tell them.
Of course, the narrative approach has its weaknesses , too. Sample sizes are generally quite small due to the time-consuming process of capturing narratives. Because of this, along with the multitude of social and lifestyle factors which can influence a subject, narrative analysis can be quite difficult to reproduce in subsequent research. This means that it’s difficult to test the findings of some of this research.
Similarly, researcher bias can have a strong influence on the results here, so you need to be particularly careful about the potential biases you can bring into your analysis when using this method. Nevertheless, narrative analysis is still a very useful qualitative analysis method – just keep these limitations in mind and be careful not to draw broad conclusions . If you’re keen to learn more about narrative analysis, the video below provides a great introduction to this qualitative analysis method.
QDA Method #3: Discourse Analysis
Discourse is simply a fancy word for written or spoken language or debate . So, discourse analysis is all about analysing language within its social context. In other words, analysing language – such as a conversation, a speech, etc – within the culture and society it takes place. For example, you could analyse how a janitor speaks to a CEO, or how politicians speak about terrorism.
To truly understand these conversations or speeches, the culture and history of those involved in the communication are important factors to consider. For example, a janitor might speak more casually with a CEO in a company that emphasises equality among workers. Similarly, a politician might speak more about terrorism if there was a recent terrorist incident in the country.
So, as you can see, by using discourse analysis, you can identify how culture , history or power dynamics (to name a few) have an effect on the way concepts are spoken about. So, if your research aims and objectives involve understanding culture or power dynamics, discourse analysis can be a powerful method.
Because there are many social influences in terms of how we speak to each other, the potential use of discourse analysis is vast . Of course, this also means it’s important to have a very specific research question (or questions) in mind when analysing your data and looking for patterns and themes, or you might land up going down a winding rabbit hole.
Discourse analysis can also be very time-consuming as you need to sample the data to the point of saturation – in other words, until no new information and insights emerge. But this is, of course, part of what makes discourse analysis such a powerful technique. So, keep these factors in mind when considering this QDA method. Again, if you’re keen to learn more, the video below presents a good starting point.
QDA Method #4: Thematic Analysis
Thematic analysis looks at patterns of meaning in a data set – for example, a set of interviews or focus group transcripts. But what exactly does that… mean? Well, a thematic analysis takes bodies of data (which are often quite large) and groups them according to similarities – in other words, themes . These themes help us make sense of the content and derive meaning from it.
Let’s take a look at an example.
With thematic analysis, you could analyse 100 online reviews of a popular sushi restaurant to find out what patrons think about the place. By reviewing the data, you would then identify the themes that crop up repeatedly within the data – for example, “fresh ingredients” or “friendly wait staff”.
So, as you can see, thematic analysis can be pretty useful for finding out about people’s experiences , views, and opinions . Therefore, if your research aims and objectives involve understanding people’s experience or view of something, thematic analysis can be a great choice.
Since thematic analysis is a bit of an exploratory process, it’s not unusual for your research questions to develop , or even change as you progress through the analysis. While this is somewhat natural in exploratory research, it can also be seen as a disadvantage as it means that data needs to be re-reviewed each time a research question is adjusted. In other words, thematic analysis can be quite time-consuming – but for a good reason. So, keep this in mind if you choose to use thematic analysis for your project and budget extra time for unexpected adjustments.
")
QDA Method #5: Grounded theory (GT)
Grounded theory is a powerful qualitative analysis method where the intention is to create a new theory (or theories) using the data at hand, through a series of “ tests ” and “ revisions ”. Strictly speaking, GT is more a research design type than an analysis method, but we’ve included it here as it’s often referred to as a method.
What’s most important with grounded theory is that you go into the analysis with an open mind and let the data speak for itself – rather than dragging existing hypotheses or theories into your analysis. In other words, your analysis must develop from the ground up (hence the name).
Let’s look at an example of GT in action.
Assume you’re interested in developing a theory about what factors influence students to watch a YouTube video about qualitative analysis. Using Grounded theory , you’d start with this general overarching question about the given population (i.e., graduate students). First, you’d approach a small sample – for example, five graduate students in a department at a university. Ideally, this sample would be reasonably representative of the broader population. You’d interview these students to identify what factors lead them to watch the video.
After analysing the interview data, a general pattern could emerge. For example, you might notice that graduate students are more likely to read a post about qualitative methods if they are just starting on their dissertation journey, or if they have an upcoming test about research methods.
From here, you’ll look for another small sample – for example, five more graduate students in a different department – and see whether this pattern holds true for them. If not, you’ll look for commonalities and adapt your theory accordingly. As this process continues, the theory would develop . As we mentioned earlier, what’s important with grounded theory is that the theory develops from the data – not from some preconceived idea.
So, what are the drawbacks of grounded theory? Well, some argue that there’s a tricky circularity to grounded theory. For it to work, in principle, you should know as little as possible regarding the research question and population, so that you reduce the bias in your interpretation. However, in many circumstances, it’s also thought to be unwise to approach a research question without knowledge of the current literature . In other words, it’s a bit of a “chicken or the egg” situation.
Regardless, grounded theory remains a popular (and powerful) option. Naturally, it’s a very useful method when you’re researching a topic that is completely new or has very little existing research about it, as it allows you to start from scratch and work your way from the ground up .
")
QDA Method #6: Interpretive Phenomenological Analysis (IPA)
Interpretive. Phenomenological. Analysis. IPA . Try saying that three times fast…
Let’s just stick with IPA, okay?
IPA is designed to help you understand the personal experiences of a subject (for example, a person or group of people) concerning a major life event, an experience or a situation . This event or experience is the “phenomenon” that makes up the “P” in IPA. Such phenomena may range from relatively common events – such as motherhood, or being involved in a car accident – to those which are extremely rare – for example, someone’s personal experience in a refugee camp. So, IPA is a great choice if your research involves analysing people’s personal experiences of something that happened to them.
It’s important to remember that IPA is subject – centred . In other words, it’s focused on the experiencer . This means that, while you’ll likely use a coding system to identify commonalities, it’s important not to lose the depth of experience or meaning by trying to reduce everything to codes. Also, keep in mind that since your sample size will generally be very small with IPA, you often won’t be able to draw broad conclusions about the generalisability of your findings. But that’s okay as long as it aligns with your research aims and objectives.
Another thing to be aware of with IPA is personal bias . While researcher bias can creep into all forms of research, self-awareness is critically important with IPA, as it can have a major impact on the results. For example, a researcher who was a victim of a crime himself could insert his own feelings of frustration and anger into the way he interprets the experience of someone who was kidnapped. So, if you’re going to undertake IPA, you need to be very self-aware or you could muddy the analysis.

How to choose the right analysis method
In light of all of the qualitative analysis methods we’ve covered so far, you’re probably asking yourself the question, “ How do I choose the right one? ”
Much like all the other methodological decisions you’ll need to make, selecting the right qualitative analysis method largely depends on your research aims, objectives and questions . In other words, the best tool for the job depends on what you’re trying to build. For example:
- Perhaps your research aims to analyse the use of words and what they reveal about the intention of the storyteller and the cultural context of the time.
- Perhaps your research aims to develop an understanding of the unique personal experiences of people that have experienced a certain event, or
- Perhaps your research aims to develop insight regarding the influence of a certain culture on its members.
As you can probably see, each of these research aims are distinctly different , and therefore different analysis methods would be suitable for each one. For example, narrative analysis would likely be a good option for the first aim, while grounded theory wouldn’t be as relevant.
It’s also important to remember that each method has its own set of strengths, weaknesses and general limitations. No single analysis method is perfect . So, depending on the nature of your research, it may make sense to adopt more than one method (this is called triangulation ). Keep in mind though that this will of course be quite time-consuming.
As we’ve seen, all of the qualitative analysis methods we’ve discussed make use of coding and theme-generating techniques, but the intent and approach of each analysis method differ quite substantially. So, it’s very important to come into your research with a clear intention before you decide which analysis method (or methods) to use.
Start by reviewing your research aims , objectives and research questions to assess what exactly you’re trying to find out – then select a qualitative analysis method that fits. Never pick a method just because you like it or have experience using it – your analysis method (or methods) must align with your broader research aims and objectives.

Let’s recap on QDA methods…
In this post, we looked at six popular qualitative data analysis methods:
- First, we looked at content analysis , a straightforward method that blends a little bit of quant into a primarily qualitative analysis.
- Then we looked at narrative analysis , which is about analysing how stories are told.
- Next up was discourse analysis – which is about analysing conversations and interactions.
- Then we moved on to thematic analysis – which is about identifying themes and patterns.
- From there, we went south with grounded theory – which is about starting from scratch with a specific question and using the data alone to build a theory in response to that question.
- And finally, we looked at IPA – which is about understanding people’s unique experiences of a phenomenon.
Of course, these aren’t the only options when it comes to qualitative data analysis, but they’re a great starting point if you’re dipping your toes into qualitative research for the first time.
If you’re still feeling a bit confused, consider our private coaching service , where we hold your hand through the research process to help you develop your best work.

Psst... there’s more!
This post was based on one of our popular Research Bootcamps . If you're working on a research project, you'll definitely want to check this out ...
87 Comments

This has been very helpful. Thank you.

Thank you madam,

Thank you so much for this information

I wonder it so clear for understand and good for me. can I ask additional query?

Very insightful and useful

Good work done with clear explanations. Thank you.

Thanks so much for the write-up, it’s really good.

Thanks madam . It is very important .

thank you very good

Great presentation

This has been very well explained in simple language . It is useful even for a new researcher.

Great to hear that. Good luck with your qualitative data analysis, Pramod!

This is very useful information. And it was very a clear language structured presentation. Thanks a lot.

Thank you so much.

very informative sequential presentation

Precise explanation of method.

Hi, may we use 2 data analysis methods in our qualitative research?
Thanks for your comment. Most commonly, one would use one type of analysis method, but it depends on your research aims and objectives.

You explained it in very simple language, everyone can understand it. Thanks so much.

Thank you very much, this is very helpful. It has been explained in a very simple manner that even a layman understands

Thank nicely explained can I ask is Qualitative content analysis the same as thematic analysis?
Thanks for your comment. No, QCA and thematic are two different types of analysis. This article might help clarify – https://onlinelibrary.wiley.com/doi/10.1111/nhs.12048

This is my first time to come across a well explained data analysis. so helpful.

I have thoroughly enjoyed your explanation of the six qualitative analysis methods. This is very helpful. Thank you!

Thank you very much, this is well explained and useful

i need a citation of your book.

Thanks a lot , remarkable indeed, enlighting to the best

Hi Derek, What other theories/methods would you recommend when the data is a whole speech?

Keep writing useful artikel.

It is important concept about QDA and also the way to express is easily understandable, so thanks for all.

Thank you, this is well explained and very useful.

Very helpful .Thanks.

Hi there! Very well explained. Simple but very useful style of writing. Please provide the citation of the text. warm regards

The session was very helpful and insightful. Thank you
This was very helpful and insightful. Easy to read and understand

As a professional academic writer, this has been so informative and educative. Keep up the good work Grad Coach you are unmatched with quality content for sure.
Keep up the good work Grad Coach you are unmatched with quality content for sure.

Its Great and help me the most. A Million Thanks you Dr.

It is a very nice work

Very insightful. Please, which of this approach could be used for a research that one is trying to elicit students’ misconceptions in a particular concept ?

This is Amazing and well explained, thanks

great overview

What do we call a research data analysis method that one use to advise or determining the best accounting tool or techniques that should be adopted in a company.

Informative video, explained in a clear and simple way. Kudos

Waoo! I have chosen method wrong for my data analysis. But I can revise my work according to this guide. Thank you so much for this helpful lecture.

This has been very helpful. It gave me a good view of my research objectives and how to choose the best method. Thematic analysis it is.

Very helpful indeed. Thanku so much for the insight.

This was incredibly helpful.

Very helpful.

very educative

Nicely written especially for novice academic researchers like me! Thank you.

choosing a right method for a paper is always a hard job for a student, this is a useful information, but it would be more useful personally for me, if the author provide me with a little bit more information about the data analysis techniques in type of explanatory research. Can we use qualitative content analysis technique for explanatory research ? or what is the suitable data analysis method for explanatory research in social studies?

that was very helpful for me. because these details are so important to my research. thank you very much

I learnt a lot. Thank you

Relevant and Informative, thanks !

Well-planned and organized, thanks much! 🙂

I have reviewed qualitative data analysis in a simplest way possible. The content will highly be useful for developing my book on qualitative data analysis methods. Cheers!

Clear explanation on qualitative and how about Case study

This was helpful. Thank you

This was really of great assistance, it was just the right information needed. Explanation very clear and follow.
Wow, Thanks for making my life easy

This was helpful thanks .

Very helpful…. clear and written in an easily understandable manner. Thank you.

This was so helpful as it was easy to understand. I’m a new to research thank you so much.

so educative…. but Ijust want to know which method is coding of the qualitative or tallying done?

Thank you for the great content, I have learnt a lot. So helpful

precise and clear presentation with simple language and thank you for that.

very informative content, thank you.

You guys are amazing on YouTube on this platform. Your teachings are great, educative, and informative. kudos!

Brilliant Delivery. You made a complex subject seem so easy. Well done.

Beautifully explained.
Thanks a lot

Is there a video the captures the practical process of coding using automated applications?
Thanks for the comment. We don’t recommend using automated applications for coding, as they are not sufficiently accurate in our experience.

content analysis can be qualitative research?

THANK YOU VERY MUCH.

Thank you very much for such a wonderful content

do you have any material on Data collection

What a powerful explanation of the QDA methods. Thank you.

Great explanation both written and Video. i have been using of it on a day to day working of my thesis project in accounting and finance. Thank you very much for your support.

very helpful, thank you so much

The tutorial is useful. I benefited a lot.

This is an eye opener for me and very informative, I have used some of your guidance notes on my Thesis, I wonder if you can assist with your 1. name of your book, year of publication, topic etc., this is for citing in my Bibliography,
I certainly hope to hear from you
Submit a Comment Cancel reply
Your email address will not be published. Required fields are marked *
Save my name, email, and website in this browser for the next time I comment.
- Print Friendly

The Ultimate Guide to Qualitative Research - Part 2: Handling Qualitative Data

- Handling qualitative data
- Transcripts
- Field notes
- Survey data and responses
- Visual and audio data
- Data organization
- Data coding
- Coding frame
- Auto and smart coding
- Organizing codes
- Introduction
What is qualitative data analysis?
Qualitative data analysis methods, how do you analyze qualitative data, content analysis, thematic analysis.
- Thematic analysis vs. content analysis
- Narrative research
Phenomenological research
Discourse analysis, grounded theory.
- Deductive reasoning
- Inductive reasoning
- Inductive vs. deductive reasoning
- Qualitative data interpretation
- Qualitative data analysis software
Qualitative data analysis
Analyzing qualitative data is the next step after you have completed the use of qualitative data collection methods . The qualitative analysis process aims to identify themes and patterns that emerge across the data.

In simplified terms, qualitative research methods involve non-numerical data collection followed by an explanation based on the attributes of the data . For example, if you are asked to explain in qualitative terms a thermal image displayed in multiple colors, then you would explain the color differences rather than the heat's numerical value. If you have a large amount of data (e.g., of group discussions or observations of real-life situations), the next step is to transcribe and prepare the raw data for subsequent analysis.
Researchers can conduct studies fully based on qualitative methodology, or researchers can preface a quantitative research study with a qualitative study to identify issues that were not originally envisioned but are important to the study. Quantitative researchers may also collect and analyze qualitative data following their quantitative analyses to better understand the meanings behind their statistical results.
Conducting qualitative research can especially help build an understanding of how and why certain outcomes were achieved (in addition to what was achieved). For example, qualitative data analysis is often used for policy and program evaluation research since it can answer certain important questions more efficiently and effectively than quantitative approaches.

Qualitative data analysis can also answer important questions about the relevance, unintended effects, and impact of programs, such as:
- Were expectations reasonable?
- Did processes operate as expected?
- Were key players able to carry out their duties?
- Were there any unintended effects of the program?
The importance of qualitative data analysis
Qualitative approaches have the advantage of allowing for more diversity in responses and the capacity to adapt to new developments or issues during the research process itself. While qualitative analysis of data can be demanding and time-consuming to conduct, many fields of research utilize qualitative software tools that have been specifically developed to provide more succinct, cost-efficient, and timely results.

Qualitative data analysis is an important part of research and building greater understanding across fields for a number of reasons. First, cases for qualitative data analysis can be selected purposefully according to whether they typify certain characteristics or contextual locations. In other words, qualitative data permits deep immersion into a topic, phenomenon, or area of interest. Rather than seeking generalizability to the population the sample of participants represent, qualitative research aims to construct an in-depth and nuanced understanding of the research topic.
Secondly, the role or position of the researcher in qualitative analysis of data is given greater critical attention. This is because, in qualitative data analysis, the possibility of the researcher taking a ‘neutral' or transcendent position is seen as more problematic in practical and/or philosophical terms. Hence, qualitative researchers are often exhorted to reflect on their role in the research process and make this clear in the analysis.

Thirdly, while qualitative data analysis can take a wide variety of forms, it largely differs from quantitative research in the focus on language, signs, experiences, and meaning. In addition, qualitative approaches to analysis are often holistic and contextual rather than analyzing the data in a piecemeal fashion or removing the data from its context. Qualitative approaches thus allow researchers to explore inquiries from directions that could not be accessed with only numerical quantitative data.
Establishing research rigor
Systematic and transparent approaches to the analysis of qualitative data are essential for rigor . For example, many qualitative research methods require researchers to carefully code data and discern and document themes in a consistent and credible way.

Perhaps the most traditional division in the way qualitative and quantitative research have been used in the social sciences is for qualitative methods to be used for exploratory purposes (e.g., to generate new theory or propositions) or to explain puzzling quantitative results, while quantitative methods are used to test hypotheses .

After you’ve collected relevant data , what is the best way to look at your data ? As always, it will depend on your research question . For instance, if you employed an observational research method to learn about a group’s shared practices, an ethnographic approach could be appropriate to explain the various dimensions of culture. If you collected textual data to understand how people talk about something, then a discourse analysis approach might help you generate key insights about language and communication.

The qualitative data coding process involves iterative categorization and recategorization, ensuring the evolution of the analysis to best represent the data. The procedure typically concludes with the interpretation of patterns and trends identified through the coding process.
To start off, let’s look at two broad approaches to data analysis.
Deductive analysis
Deductive analysis is guided by pre-existing theories or ideas. It starts with a theoretical framework , which is then used to code the data. The researcher can thus use this theoretical framework to interpret their data and answer their research question .
The key steps include coding the data based on the predetermined concepts or categories and using the theory to guide the interpretation of patterns among the codings. Deductive analysis is particularly useful when researchers aim to verify or extend an existing theory within a new context.
Inductive analysis
Inductive analysis involves the generation of new theories or ideas based on the data. The process starts without any preconceived theories or codes, and patterns, themes, and categories emerge out of the data.

The researcher codes the data to capture any concepts or patterns that seem interesting or important to the research question . These codes are then compared and linked, leading to the formation of broader categories or themes. The main goal of inductive analysis is to allow the data to 'speak for itself' rather than imposing pre-existing expectations or ideas onto the data.
Deductive and inductive approaches can be seen as sitting on opposite poles, and all research falls somewhere within that spectrum. Most often, qualitative analysis approaches blend both deductive and inductive elements to contribute to the existing conversation around a topic while remaining open to potential unexpected findings. To help you make informed decisions about which qualitative data analysis approach fits with your research objectives, let's look at some of the common approaches for qualitative data analysis.
Content analysis is a research method used to identify patterns and themes within qualitative data. This approach involves systematically coding and categorizing specific aspects of the content in the data to uncover trends and patterns. An often important part of content analysis is quantifying frequencies and patterns of words or characteristics present in the data .
It is a highly flexible technique that can be adapted to various data types , including text, images, and audiovisual content . While content analysis can be exploratory in nature, it is also common to use pre-established theories and follow a more deductive approach to categorizing and quantifying the qualitative data.

Thematic analysis is a method used to identify, analyze, and report patterns or themes within the data. This approach moves beyond counting explicit words or phrases and focuses on also identifying implicit concepts and themes within the data.

Researchers conduct detailed coding of the data to ascertain repeated themes or patterns of meaning. Codes can be categorized into themes, and the researcher can analyze how the themes relate to one another. Thematic analysis is flexible in terms of the research framework, allowing for both inductive (data-driven) and deductive (theory-driven) approaches. The outcome is a rich, detailed, and complex account of the data.
Grounded theory is a systematic qualitative research methodology that is used to inductively generate theory that is 'grounded' in the data itself. Analysis takes place simultaneously with data collection , and researchers iterate between data collection and analysis until a comprehensive theory is developed.
Grounded theory is characterized by simultaneous data collection and analysis, the development of theoretical codes from the data, purposeful sampling of participants, and the constant comparison of data with emerging categories and concepts. The ultimate goal is to create a theoretical explanation that fits the data and answers the research question .
Discourse analysis is a qualitative research approach that emphasizes the role of language in social contexts. It involves examining communication and language use beyond the level of the sentence, considering larger units of language such as texts or conversations.

Discourse analysts typically investigate how social meanings and understandings are constructed in different contexts, emphasizing the connection between language and power. It can be applied to texts of all kinds, including interviews , documents, case studies , and social media posts.
Phenomenological research focuses on exploring how human beings make sense of an experience and delves into the essence of this experience. It strives to understand people's perceptions, perspectives, and understandings of a particular situation or phenomenon.

It involves in-depth engagement with participants, often through interviews or conversations, to explore their lived experiences. The goal is to derive detailed descriptions of the essence of the experience and to interpret what insights or implications this may bear on our understanding of this phenomenon.

Whatever your data analysis approach, start with ATLAS.ti
Qualitative data analysis done quickly and intuitively with ATLAS.ti. Download a free trial today.
Now that we've summarized the major approaches to data analysis, let's look at the broader process of research and data analysis. Suppose you need to do some research to find answers to any kind of research question, be it an academic inquiry, business problem, or policy decision. In that case, you need to collect some data. There are many methods of collecting data: you can collect primary data yourself by conducting interviews, focus groups , or a survey , for instance. Another option is to use secondary data sources. These are data previously collected for other projects, historical records, reports, statistics – basically everything that exists already and can be relevant to your research.

The data you collect should always be a good fit for your research question . For example, if you are interested in how many people in your target population like your brand compared to others, it is no use to conduct interviews or a few focus groups . The sample will be too small to get a representative picture of the population. If your questions are about "how many….", "what is the spread…" etc., you need to conduct quantitative research . If you are interested in why people like different brands, their motives, and their experiences, then conducting qualitative research can provide you with the answers you are looking for.
Let's describe the important steps involved in conducting research.
Step 1: Planning the research
As the saying goes: "Garbage in, garbage out." Suppose you find out after you have collected data that
- you talked to the wrong people
- asked the wrong questions
- a couple of focus groups sessions would have yielded better results because of the group interaction, or
- a survey including a few open-ended questions sent to a larger group of people would have been sufficient and required less effort.
Think thoroughly about sampling, the questions you will be asking, and in which form. If you conduct a focus group or an interview, you are the research instrument, and your data collection will only be as good as you are. If you have never done it before, seek some training and practice. If you have other people do it, make sure they have the skills.

Step 2: Preparing the data
When you conduct focus groups or interviews, think about how to transcribe them. Do you want to run them online or offline? If online, check out which tools can serve your needs, both in terms of functionality and cost. For any audio or video recordings , you can consider using automatic transcription software or services. Automatically generated transcripts can save you time and money, but they still need to be checked. If you don't do this yourself, make sure that you instruct the person doing it on how to prepare the data.
- How should the final transcript be formatted for later analysis?
- Which names and locations should be anonymized?
- What kind of speaker IDs to use?
What about survey data ? Some survey data programs will immediately provide basic descriptive-level analysis of the responses. ATLAS.ti will support you with the analysis of the open-ended questions. For this, you need to export your data as an Excel file. ATLAS.ti's survey import wizard will guide you through the process.
Other kinds of data such as images, videos, audio recordings, text, and more can be imported to ATLAS.ti. You can organize all your data into groups and write comments on each source of data to maintain a systematic organization and documentation of your data.

Step 3: Exploratory data analysis
You can run a few simple exploratory analyses to get to know your data. For instance, you can create a word list or word cloud of all your text data or compare and contrast the words in different documents. You can also let ATLAS.ti find relevant concepts for you. There are many tools available that can automatically code your text data, so you can also use these codings to explore your data and refine your coding.

For instance, you can get a feeling for the sentiments expressed in the data. Who is more optimistic, pessimistic, or neutral in their responses? ATLAS.ti can auto-code the positive, negative, and neutral sentiments in your data. Naturally, you can also simply browse through your data and highlight relevant segments that catch your attention or attach codes to begin condensing the data.

Step 4: Build a code system
Whether you start with auto-coding or manual coding, after having generated some first codes, you need to get some order in your code system to develop a cohesive understanding. You can build your code system by sorting codes into groups and creating categories and subcodes. As this process requires reading and re-reading your data, you will become very familiar with your data. Counting on a tool like ATLAS.ti qualitative data analysis software will support you in the process and make it easier to review your data, modify codings if necessary, change code labels, and write operational definitions to explain what each code means.

Step 5: Query your coded data and write up the analysis
Once you have coded your data, it is time to take the analysis a step further. When using software for qualitative data analysis , it is easy to compare and contrast subsets in your data, such as groups of participants or sets of themes.

For instance, you can query the various opinions of female vs. male respondents. Is there a difference between consumers from rural or urban areas or among different age groups or educational levels? Which codes occur together throughout the data set? Are there relationships between various concepts, and if so, why?
Step 6: Data visualization
Data visualization brings your data to life. It is a powerful way of seeing patterns and relationships in your data. For instance, diagrams allow you to see how your codes are distributed across documents or specific subpopulations in your data.

Exploring coded data on a canvas, moving around code labels in a virtual space, linking codes and other elements of your data set, and thinking about how they are related and why – all of these will advance your analysis and spur further insights. Visuals are also great for communicating results to others.
Step 7: Data presentation
The final step is to summarize the analysis in a written report . You can now put together the memos you have written about the various topics, select some salient quotes that illustrate your writing, and add visuals such as tables and diagrams. If you follow the steps above, you will already have all the building blocks, and you just have to put them together in a report or presentation.
When preparing a report or a presentation, keep your audience in mind. Does your audience better understand numbers than long sections of detailed interpretations? If so, add more tables, charts, and short supportive data quotes to your report or presentation. If your audience loves a good interpretation, add your full-length memos and walk your audience through your conceptual networks and illustrative data quotes.

Qualitative data analysis begins with ATLAS.ti
For tools that can make the most out of your data, check out ATLAS.ti with a free trial.

An official website of the United States government
The .gov means it’s official. Federal government websites often end in .gov or .mil. Before sharing sensitive information, make sure you’re on a federal government site.
The site is secure. The https:// ensures that you are connecting to the official website and that any information you provide is encrypted and transmitted securely.
- Publications
- Account settings
Preview improvements coming to the PMC website in October 2024. Learn More or Try it out now .
- Advanced Search
- Journal List
- J Prev Med Public Health
- v.56(2); 2023 Mar
- PMC10111102
Qualitative Research in Healthcare: Data Analysis
1 Department of Preventive Medicine, Ulsan University Hospital, University of Ulsan College of Medicine, Ulsan, Korea
2 Ulsan Metropolitan City Public Health Policy’s Institute, Ulsan, Korea
Hyeran Jung
3 Department of Preventive Medicine, University of Ulsan College of Medicine, Seoul, Korea
Qualitative research methodology has been applied with increasing frequency in various fields, including in healthcare research, where quantitative research methodology has traditionally dominated, with an empirically driven approach involving statistical analysis. Drawing upon artifacts and verbal data collected from in-depth interviews or participatory observations, qualitative research examines the comprehensive experiences of research participants who have experienced salient yet unappreciated phenomena. In this study, we review 6 representative qualitative research methodologies in terms of their characteristics and analysis methods: consensual qualitative research, phenomenological research, qualitative case study, grounded theory, photovoice, and content analysis. We mainly focus on specific aspects of data analysis and the description of results, while also providing a brief overview of each methodology’s philosophical background. Furthermore, since quantitative researchers have criticized qualitative research methodology for its perceived lack of validity, we examine various validation methods of qualitative research. This review article intends to assist researchers in employing an ideal qualitative research methodology and in reviewing and evaluating qualitative research with proper standards and criteria.
INTRODUCTION
Researchers should select the research methodology best suited for their study. Quantitative research, which is based on empiricism and positivism, has long been the mainstream research methodology in most scientific fields. In recent years, however, increasing attempts have been made to use qualitative research methodology in various research fields, either combined with quantitative research methodology or as a stand-alone research method. Unlike quantitative research, which performs statistical analyses using the results derived in numerical form through investigations or experiments, qualitative research uses various qualitative analysis methods based on verbal data obtained through participatory observations or in-depth interviews. Qualitative research is advantageous when researching topics that involve research participants’ in-depth experiences and perceptions, topics that are important but have not yet drawn sufficient attention, and topics that should be reviewed from a new perspective.
However, qualitative research remains relatively rare in healthcare research, with quantitative research still predominating as the mainstream research practice [ 1 ]. Consequently, there is a lack of understanding of qualitative research, its characteristics, and its procedures in healthcare research. The low level of awareness of qualitative research can lead to the denigration of its results. Therefore, it is essential not only for researchers conducting qualitative research to have a correct understanding of various qualitative research methods, but also for peer researchers who review research proposals, reports, and papers to properly understand the procedures and advantages/disadvantages of qualitative research.
In our previous review paper, we explored the characteristics of qualitative research in comparison to quantitative research and its usefulness in healthcare research [ 2 ]. Specifically, we conducted an in-depth review of the general qualitative research process, selection of research topics and problems, selection of theoretical frameworks and methods, literature analysis, and selection of research participants and data collection methods [ 2 ]. This review article is dedicated to data analysis and the description of results, which may be considered the core of qualitative research, in different qualitative research methods in greater detail, along with the criteria for evaluating the validity of qualitative research. This review article is expected to offer insights into selecting and implementing the qualitative research methodology best suited for a given research topic and evaluating the quality of research.
IN-DEPTH REVIEW OF QUALITATIVE RESEARCH METHODS
This section is devoted to the in-depth review of 6 qualitative research methodologies (consensual qualitative research, phenomenological research, qualitative case study, grounded theory, photovoice, and content analysis), focusing on their characteristics and concrete analysis processes. Table 1 summarizes the characteristics of each methodology.
Characteristics and key analytical approaches of each qualitative research methodology
| Qualitative research methods | Key analytical approaches | Advantages | Limitation |
|---|---|---|---|
| Consensual qualitative research | |||
| Phenomenological research | |||
| Qualitative case study | |||
| Grounded theory | |||
| Photovoice | |||
| Qualitative content analysis |
Consensual Qualitative Research
Consensual qualitative research (CQR) was developed by Professor Clara Hill of the University of Maryland [ 3 ]. It emphasizes consensus within a research team (or analysis team) to address the problem of low objectivity being likely to occur when conducting qualitative research. This method seeks to maintain scientific rigor by deriving analysis results through team consensus, asserting the importance of ethical issues, trust, and the role of culture. In CQR, researchers are required to verify each conclusion whenever it is drawn by checking it against the original data.
Building a solid research team is the first step in conducting CQR. Most importantly, each team member should have resolute initiative and clear motivations for joining the research team. In general, at least 3 main team members are needed for data analysis, with 1 or 2 advisors (or auditors) reviewing their work. Researchers without experience in CQR should first receive prior education and training on its procedures and then team up with team members experienced in CQR. Furthermore, as is the case with other types of qualitative research, CQR attaches great importance to ensuring the objectivity of research by sharing prejudices, pre-understanding, and expectations of the research topic among the team members.
CQR is performed in 4 sequential steps: the initial stage, intra-case analysis stage, cross-analysis stage, and manuscript writing stage [ 4 ]. First, in the initial stage, the pre-formed team of researchers selects a research topic, performs a literature review, develops an interview guideline, and conducts pilot interviews. Research participants who fit the research topic are recruited using inclusion and exclusion criteria for selecting suitable participants. Then, interviews are conducted according to the interview guideline, recorded, and transcribed. The transcripts are sent to the interviewees for review. During this process, researchers could make slight modifications to explore the research topic better.
Second, in intra-case analysis stage, domains and subdomains are developed based on the initial interview guideline. The initial domains and subdomains are used to analyze 1 or 2 interviews, and afterward, the domains and subdomains are modified to reflect the analysis results. Core ideas are also created through interview analysis and are coded in domains and subdomains. The advisors review the domains, subdomains, and core ideas and provide suggestions for improvement. The remaining interviews are analyzed according to the revised domains, subdomains, and core ideas.
Third, in the cross-analysis stage, the core ideas from the interview analysis are categorized according to the domains and subdomains. In this process, repeated team discussions are encouraged to revise domains and subdomains and place the core ideas that do not lend themselves well to categorization into a miscellaneous category. The frequency of occurrence of each domain is then calculated for each interview case. In general, a domain is classified as a general category when it appears in all cases, a typical category when it appears in more than half of the cases, and a variant category when it appears in fewer than half of the cases [ 5 ]. However, the criteria for frequency counting may slightly differ from study to study. The advisors should also review the results of the cross-analysis stage, and the main analysis team revises the analysis results based on those comments.
Fourth, the intra-case analysis and cross-analysis results are described in the manuscript writing stage. It is essential to present a clear and convincing narrative to the audience [ 5 ], and it is thus recommended to revise and formulate the manuscript based on team discussions and advisor opinions. However, CQR does not guarantee that different research teams would reach similar conclusions, and the CQR research team dynamics strongly affect conflict-resolution issues during the consensus-building process [ 3 ].
As examined above, despite its limitations, the salient feature of CQR is its rigorous process for ensuring the objectivity of analysis results compared to other qualitative research methods. In addition, it is an accessible method for quantitative researchers because it explains the analysis results in terms of the frequency of domain occurrences. CQR can be a suitable research methodology to persuade researchers who are hesitant to accept the results of qualitative research. Although CQR is still rarely used in healthcare research, some studies have applied it to investigate topics of interest [ 6 , 7 ].
Phenomenological Research
Phenomenological research (PR) is, as its name suggests, qualitative research based on the phenomenological principle. The term “phenomenological principle” is based on Husserlian phenomenology, which seeks the essence (inner core) and the meaning of people’s lived experiences [ 8 ]. According to Husserl, it is necessary to go “back to the things themselves” (in German: zurück zu den Sachen selbst ) and accurately explore the essence of experience. Diverse reflective attitudes based on the phenomenological principle are required to understand “ Sachen ” without expectations and prejudices [ 9 ]. Thus, the purpose of PR using Husserl’s phenomenological principle can be understood as an inquiry into the essence of experience.
The process of PR aiming to fulfill this purpose differs among various schools and scholars. The Husserlian, Heideggerian, and Utrecht schools had major impacts on PR [ 10 ]. Representative Husserlian scholars who further developed the PR process include Amedeo Giorgi and Paul Colaizzi. Giorgi, who pioneered the field of phenomenological psychology, collected data through in-depth interviews and divided the analysis process into 4 steps [ 11 ]. Colaizzi, who was one of Giorgi’s students, proposed a more complex process from data collection to analysis [ 12 , 13 ]. Representative Heideggerian scholars are Patricia Benner, who introduced an interpretive phenomenological qualitative research method to the field of nursing on the subject of clinical placement of nursing students but did not fully clarify its specific procedure [ 14 ], and Nancy Diekelmann [ 15 ] and Nancy Diekelmann and David Allen [ 16 ], who emphasized the role of the team in the analysis process and proposed the 7-step method of analysis. Max Van Manen, a Dutch-born Canadian scholar, is a representative Utrecht School scholar who proposed a 6-step data collection and analysis process and emphasized the importance of phenomenological description [ 8 ]. As a scholar with no affiliation with any specific school, Adrian Van Kaam [ 17 ], an existentialist psychologist, developed an experiential PR method using descriptive texts. Despite differences in data collection and analysis processes, the common denominator of these approaches is a fundamentally phenomenological attitude and the goal of exploring the essence of experience.
In general, the process of phenomenological qualitative analysis can be divided into 5 steps based on the phenomenological attitude [ 18 ]: step 1, reading the data repeatedly to get a sense of the whole and gauge the meanings of the data; step 2, categorizing and clustering the data by meaning unit; step 3, writing analytically by meaning unit in a descriptive, reflective, and hermeneutic manner; step 4, deriving essential factors and thematizing while writing; and step 5, deriving the essential experiential structure by identifying the relationships between essential experiential factors. During the entire process, researchers must embrace the attitudes of “reduction” and “imaginative variation.” The term “reduction” reflects the thought of accepting the meaning of experience in the way it manifests itself [ 19 ]. An attitude of phenomenological reduction is required to recover freshness and curiosity about the research object through non-judgment, bracketing, and epoché , which assist to minimize the effects of researchers’ prejudices of research topic during the analysis process. An attitude of imaginative variation is required to diversify the meanings pertaining to data and view them as diametric opposites.
As described above, PR is characterized more by emphasizing the researcher’s constant reflection and interpretation/recording of the experience, seeking to explore its very essence, than by being conducted according to a concrete procedure. Based on these characteristics, PR in healthcare research has been applied to various topics, including research on the meaning of health behaviors such as drinking and smoking in various cultures since the 1970s [ 20 , 21 ], information and education needs of patients with diabetes [ 22 ], pain in cancer patients [ 23 ], and the experiences of healthcare students and professionals in patient safety activities [ 24 , 25 ].
Qualitative Case Study
Although case studies have long been conducted in various academic fields, in the 1980s [ 26 ], they began to be recognized as a qualitative research method with the case study publications by researchers such as Merriam [ 27 ], Stake [ 28 ], Yin [ 29 ], and Hays [ 30 ]. Case studies include both quantitative and qualitative strategies and can also be used with other qualitative research methods. In general, a qualitative case study (QCS) is a research method adopted to understand the complexity of a case, derive its meaning, and identify the process of change over time [ 27 ]. To achieve these goals, a QCS collects in-depth data using various information sources from rich contexts and explores one or more bounded systems [ 31 ].
A case, which is the core of a case study, has delimitation [ 28 ], contextuality [ 29 ], specificity [ 30 ], complexity [ 32 ], and newness [ 27 ]. The definition of a case study differs among scholars, but they agree that a case to be studied should have boundaries that distinguish it from other cases. Therefore, a case can be a person, a group, a program, or an event and can also be a single or complex case [ 28 ]. The types of QCSs are classified by the scale of the bounded system and the purpose of case analysis. From the latter perspective, Stake [ 28 ] divided case studies into intrinsic and instrumental case studies.
A QCS is conducted in 5 steps [ 33 ]. Stage 1 is the research design stage, where an overall plan is established for case selection, research question setting, research time and cost allocation, and the report format of research outcomes [ 28 ]. Yin [ 33 ] noted that 4 types of case studies could be designed based on the number of cases (single or multiple cases) and the number of analysis units (holistic design for a single unit or embedded design for multiple units). These types are called single holistic design, single embedded design, multiple holistic design, and multiple embedded design. Stage 2 is the preparation stage for data collection. The skills and qualifications required for the researcher are reviewed, prior training of researchers takes place, a protocol is developed, candidate cases are screened, and a pilot case study is conducted. Stage 3 is data collection. Data are collected from the data sources commonly used in case studies, such as documents, archival records, interviews, direct observations, participatory observations, and physical artifacts [ 33 ]. Other data sources for case studies include films, photos, videotapes, and life history studies [ 34 ]. The data collection period may vary depending on the research topic and the need for additional data collection during the analysis process. Stage 4 is the data analysis stage. The case is described in detail based on the collected data, and the data for concrete topics are analyzed [ 28 ]. With no prescribed method related to data collection and analysis for a case study, a general data analysis procedure is followed, and the choice of analysis method differs among researchers. In a multiple-case study, the meaning of the cases is interpreted by performing intra-case and inter-case analyses. The last stage is the interpretation stage, in which the researcher reports the meaning of the case—that is, the lessons learned from the case [ 35 ].
Compared to other qualitative research methods, QCSs have no prescribed procedure, which may prove challenging in the actual research process. However, when the researcher seeks an in-depth understanding of a bound system clearly distinguished from other cases, a QCS can be an appropriate approach. Based on the characteristics mentioned above, QCSs in healthcare research have been mainly conducted on unique cases or cases that should be known in detail, such as the experience of rare diseases [ 36 ], victims of medical malpractice [ 37 ], complications due to home birth [ 38 ], and post-stroke gender awareness of women of childbearing age [ 39 ].
Grounded Theory
Grounded theory (GT) is a research approach to gaining facts about an unfamiliar specific social phenomenon or a new understanding of a particular phenomenon [ 40 ]. GT involves the most systematic research process among all qualitative research methods [ 41 ]. Its most salient feature is generating a theory by collecting various data from research subjects and analyzing the relationship between the central phenomenon and each category through an elaborate analysis process. GT is adequate for understanding social and psychological structural phenomena regarding a specific object or social phenomenon, rather than framework or hypothesis testing [ 42 ].
GT was first introduced in 1967 by Strauss and Glaser. Their views subsequently diverged and each scholar separately developed different GT methods. Glaser’s GT focused on the natural emergence of categories and theories based on positivism [ 40 , 43 ]. Strauss, who was influenced by symbolic interactionism and pragmatism, teamed up with Corbin and systematically presented the techniques and procedures of the GT process [ 44 ]. Since then, various GT techniques have been developed [ 45 ]; Charmaz’s GT is based on constructivism [ 43 ].
Researchers using GT should collect data based on theoretical sampling and theoretical saturation. Theoretical sampling refers to selecting additional data using the theoretical concepts encountered in collecting and analyzing data, and theoretical saturation occurs when no new categories are expected to appear [ 40 ]. Researchers must also possess theoretical sensitivity—that is, the ability to react sensitively to the collected data and gain insight into them [ 40 ]. An analysis is performed through the constant comparative method, wherein researchers constantly compare the collected data and discover similarities and differences to understand the relationships between phenomena, concepts, and categories.
Among the different types of GT research designs, the one proposed by Strauss and Corbin is divided into 3 stages. Stage 1 is open coding; the concepts are derived from the data through a line-by-line data analysis, and the initial categorization occurs. Stage 2 is axial coding; the interrelationships among the categories derived from open coding are schematized in line with the structural framework defined as a paradigm. The major components of the paradigm are causal conditions, context, intervening conditions, action/interaction strategies, and consequences. Stage 3 is selective coding; the core category is first derived, the relationships between subcategories and concepts are identified, and the narrative outline is described. Lastly, the process is presented in a visual mode, whereupon a theoretical model is built and integrated. In contrast, Glaser’s analysis method involves theoretical coding that weaves practical concepts into hypotheses or theories instead of axial coding [ 46 ]. Currently, Strauss and Corbin’s GT method is the most widely used one [ 47 ], and given that different terms are used among scholars, it is crucial to accurately understand the meaning of a term in context instead of solely focusing on the term itself [ 48 ].
The most salient features of GT are that it seeks to generate a new theory from data based on the inductive principle through its analytical framework. This framework enables an understanding of the interaction experience and the structure of its performances [ 40 ]. Furthermore, the above-described characteristics of GT widen the pathway of quantitative researchers to apply GT more than other qualitative research methods [ 43 ], which has resulted in its broader application in healthcare research. GT has been used to explore a wide range of research topics, such as asthma patients’ experiences of disease management [ 48 ], the experiences of cancer patients or their families [ 49 , 50 ], and the experiences of caregivers of patients with cognitive disorders and dementia [ 51 ].
Photovoice, a research methodology initiated by Wang and Burris [ 52 ], has been used to highlight the experiences and perspectives of marginalized people using photos. In other words, photos and their narratives are at the heart of photovoice; this method is designed to make marginalized voices heard. Photovoice, which uses photos to bring to the fore the experiences of participants who have lived a marginalized life, requires the active engagement of the participants. In other research methods, the participants play an essential role in the data collection stage (interview, topic-related materials such as diary and doodle) and the research validation stage (participants’ review). In contrast, in photovoice research, which is classified as participatory action research, participants’ dynamic engagement is essential throughout the study process—from the data collection and analysis procedure to exhibition and policy development [ 53 ].
Specifically, the photovoice research design is as follows [ 54 , 55 ]: First, policymakers or community stakeholders, who will likely bring about practical improvements on the research topic, are recruited. Second, participants with a wealth of experience on a research topic are recruited. In this stage, it should be borne in mind that the drop-out rate is high because participants’ active involvement is required, and the process is relatively time-consuming. Third, the participants are provided with information on the purpose and process of photovoice research, and they are educated on research ethics and the potential risks. Fourth, consent is obtained from the participants for research participation and the use of their photos. Fifth, a brainstorming session is held to create a specific topic within the general research topic. Sixth, researchers select a type of camera and educate the participants on the camera and photo techniques. The characteristics of the camera function (e.g., autofocus and manual focus) should be considered when selecting a camera type (e.g., mobile phone camera, disposable camera, or digital camera). Seventh, participants are given time to take pictures for discussion. Eighth, a discussion is held on the photos provided by the participants. The collected data are managed and analyzed in 3 sub-steps: (1) participants’ photo selection (selecting a photo considered more meaningful or important than other photos); (2) contextualization (analyzing the selected photo and putting the meanings attached to the photo into context); and (3) codifying (categorizing similar photos and meanings among the data collected and summarizing them in writing). In sub-step 2, the “SHOWeD” question skill could be applied to facilitate the discussion [ 56 ]: “What do you S ee here? What’s really H appening here? How does this relate to O ur lives? W hy does this situation, concern, or strength E xist? What can we D o about it?” Ninth, the participants’ summarized experiences related to their respective photos are shared and presented. This process is significant because it provides the participants with an opportunity to exhibit their photos and improve the related topics’ conditions. It is recommended that policymakers or community stakeholders join the roundtable to reflect on the outcomes and discuss their potential involvement to improve the related topics.
Based on the characteristics described above, photovoice has been used in healthcare research since the early 2000s to reveal the experiences of marginalized people, such as the lives of Black lesbian, gay, bisexual, transgender and questioning people [ 57 ] and women with acquired immunodeficiency syndrome [ 58 ], and in studies on community health issues, such as the health status of indigenous women living in a remote community [ 59 ], the quality of life of breast cancer survivors living in rural areas [ 60 ], and healthy eating habits of rural youth [ 61 ].
Qualitative Content Analysis
Content analysis is a research method that can use both qualitative and quantitative methods to derive valid inferences from data [ 62 ]. It can use a wide range of data covering a long period and diverse fields [ 63 ]. It helps compare objects, identify a specific person’s characteristics or hidden intentions, or analyze a specific era’s characteristics [ 64 ]. Quantitative content analysis categorizes research data and analyzes the relationships between the derived categories using statistical methods [ 65 ]. In contrast, qualitative content analysis (QCA) uses data coding to identify categories’ extrinsic and intrinsic meanings. The parallelism of these aspects contributes to establishing the validity of conclusions in content analysis [ 63 ].
Historically, mass media, such as newspapers and news programs, played the role of the locomotive for the development of content analysis. As interest in mass media content dealing with particular events and issues increased, content analysis was increasingly used in research analyzing mass media. In particular, it was also used in various forms to analyze propaganda content during World War II. The subsequent emergence of computer technology led to the revival of various types of content analysis research [ 66 ].
QCA is largely divided into conventional, directed, and summative [ 67 ]. First, conventional content analysis is an inductive method for deriving categories from data without using perceived categories. Key concepts are derived via the coding process by repeatedly reading and analyzing the data collected through open-ended questions. Categorization is then performed by sorting the coded data while checking similarities and differences. Second, directed content analysis uses key concepts or categories extracted from existing theories or studies as the initial coding categories. Unlike conventional content analysis, directed content analysis is closer to a deductive method and is anchored in a more structured process. Summative content analysis, the third approach, not only counts the frequency of keywords or content, but also evaluates their contextual usage and provides qualitative interpretations. It is used to understand the context of a word, along with the frequency of its occurrence, and thus to find the range of meanings that a word can have.
Since there is no concrete set procedure, the content analysis procedure varies among researchers. Some of the typical processes are a 3-step process (preparation, organizing, reporting) proposed by Elo and Kyngäs [ 68 ], a 4-step process (formulating research questions, sampling, coding, analyzing) presented by White and Marsh [ 69 ], and a 6-step process proposed by Krippendorff [ 66 ].
The 6-step content analysis research process proposed by Krippendorff [ 66 ] is as follows: Step 1, unitizing, is a process in which the researcher selects a scheme for classifying the data of interest for data collection and analysis. Step 2, sampling, involves selecting a conceptually representative sample population. In Step 3, recording/coding, the researcher records materials that are difficult to preserve, such as verbal statements, in a way that allows repeated review. Step 4, reducing, refers to simplifying the data into a manageable format using statistical techniques or summaries. Step 5, abductively inferring, involves inferring a phenomenon in the context of a situation to understand the contextual phenomenon while analyzing the data. In Step 6, narrating, the research outcomes are presented in a narrative accessible to the audience. These 6 steps are not subject to a sequential order and may go through a cyclical or iterative process [ 63 ].
As examined above, content analysis is used in several fields due to its advantages of embracing both qualitative and quantitative aspects and processing comprehensive data [ 62 , 70 ]. In recognition of its research potential, the public health field is also increasingly using content analysis research, as exemplified by suicide-related social media content analysis [ 71 ], an analysis of children’s books in association with breast cancer [ 72 ], and an analysis of patients’ medical records [ 73 ].
VALIDATION OF QUALITATIVE RESEARCH
The validation of qualitative research begins when a researcher attempts to persuade others that the research results are worthy of attention [ 35 ]. Several researchers have advanced their arguments in many different ways, from the reason or justification for existence of the validity used in qualitative research to the assessment terms and their meanings [ 74 ]. We explain the validity of qualitative research, focusing on the argument advanced by Guba and Lincoln [ 75 ]. They emphasized that the evaluation of qualitative research is a socio-political process—namely, a researcher should assume the role of a mediator of the judgment process, not that of the judge [ 75 ]. Specifically, Lincoln and Guba [ 75 ] proposed trustworthiness as a validity criterion: credibility, transferability, dependability, and confirmability.
First, credibility is a concept that corresponds to internal validity in quantitative research. To enhance the credibility of qualitative research, a “member check” is used to directly assess whether the reality of the research participants is well-reflected in the raw data, transcripts, and analysis categories [ 76 , 77 ]. Second, transferability corresponds to external validity or generalizability in quantitative research. To enhance the transferability of qualitative research, researchers must describe the data collection and analysis processes in detail and provide thick data on the overall research process, including research participants and the context and culture of research [ 77 , 78 ]. Transferability can also be enhanced by checking whether the analysis results elicit similar feelings in those who have not participated in the study but share similar experiences. Third, dependability corresponds to reliability in quantitative research and is associated with data stability. To enhance the trustworthiness of qualitative research, it is common for multiple researchers to perform the analysis independently; alternatively, or if one researcher has performed the analysis, another researcher reviews the analysis results. Furthermore, a qualitative researcher must provide a detailed and transparent description of the entire research process so that other researchers, internal or external, can evaluate whether the researcher has adequately proceeded with the overall research process. Fourth, confirmability corresponds to objectivity in quantitative research. Bracketing, a process of disclosing and discussing the researcher’s pre-understanding that may affect the research process from the beginning to the end, is conducted to enhance the confirmability of qualitative research. The results of bracketing should be included in the study results so that readers can also track the possible influence [ 77 ].
However, regarding the validity of a qualitative study, it is necessary to consider the research topic, the target audience, and research costs. Caution should also be applied to the proposed theories because presentation methods vary among scholars and researchers. Apart from the methods discussed above, other methods are used to enhance the validity of qualitative research methods, such as prolonged involvement, persistent observation, triangulation, and peer debriefing. In prolonged involvement, a researcher depicts the core of a phenomenon while staying at the study site for a sufficient time to build rapport with the participants and pose a sufficient amount of questions. In persistent observation, a researcher repeatedly reviews and observes data resources until the factors closest to the research topic are identified, giving depth to the study. Triangulation is used to check whether the same results are drawn by a team of researchers who conduct a study using various resources, including individual interviews, talks, and field notes, and discuss their respective analysis processes and results. Lastly, in peer debriefing, research results are discussed with colleagues who have not participated in the study from the beginning to the end, but are well-informed about the research topic or phenomenon [ 76 , 78 ].
This review article examines the characteristics and analysis processes of 6 different qualitative research methodologies. Additionally, a detailed overview of various validation methods for qualitative research is provided. However, a few limitations should be considered when novice qualitative researchers follow the steps in this article. First, as each qualitative research methodology has extensive and unique research approaches and analysis procedures, it should be kept in mind that the priority of this article was to highlight each methodology’s most exclusive elements that essentially compromise the core of its identity. Its scope unfortunately does not include the inch-by-inch steps of individual methodologies—for this information, it would be necessary to review the references included in the section dedicated to each methodology. Another limitation is that this article does not concentrate on the direct comparison of each methodology, which might benefit novice researchers in the process of selecting an adequate methodology for their research topic. Instead, this review article emphasizes the advantages and limitations of each methodology. Nevertheless, this review article is expected to help researchers considering employing qualitative research methodologies in the field of healthcare select an optimal method and conduct a qualitative study properly. It is sincerely hoped that this review article, along with the previous one, will encourage many researchers in the healthcare domain to use qualitative research methodologies.
Ethics Statement
Approval from the institutional review board was not obtained as this study is a review article.
ACKNOWLEDGEMENTS
CONFLICT OF INTEREST
The authors have no conflicts of interest associated with the material presented in this paper.
AUTHOR CONTRIBUTIONS
Conceptualization: Ock M. Literature review: Im D, Pyo J, Lee H, Jung H, Ock M. Funding acquisition: None. Writing – original draft: Im D, Pyo J, Lee H, Jung H, Ock M. Writing – review & editing: Im D, Pyo J, Lee H, Jung H, Ock M.

Want to create or adapt books like this? Learn more about how Pressbooks supports open publishing practices.
Part 4: Using qualitative methods
19. A survey of approaches to qualitative data analysis
Chapter outline.
- Ethical responsibility and cultural respect (6 minute read)
- Critical considerations (6 minute read)
- Preparations: Creating a plan for qualitative data analysis (11 minute read)
- Thematic analysis (15 minute read)
- Content analysis (13 minute read)
- Grounded theory analysis (7 minute read)
- Photovoice (5 minute read)
Content warning: Examples in this chapter contain references to LGBTQ+ ageing, damaged-centered research, long-term older adult care, family violence and violence against women, vocational training, financial hardship, educational practices towards rights and justice, Schizophrenia, mental health stigma, and water rights and water access.
Just a brief disclaimer, this chapter is not intended to be a comprehensive discussion on qualitative data analysis. It does offer an overview of some of the diverse approaches that can be used for qualitative data analysis, but as you will read, even within each one of these there are variations in how they might be implemented in a given project. If you are passionate (or at least curious 😊) about conducting qualitative research, use this as a starting point to help you dive deeper into some of these strategies. Please note that there are approaches to analysis that are not addressed in this chapter, but still may be very valuable qualitative research tools. Examples include heuristic analysis, [1] narrative analysis, [2] discourse analysis, [3] and visual analysis, [4] among a host of others. These aren’t mentioned to confuse or overwhelm you, but instead to suggest that qualitative research is a broad field with many options. Before we begin reviewing some of these strategies, here a few considerations regarding ethics, cultural responsibility, power and control that should influence your thinking and planning as you map out your data analysis plan.
19.1 Ethical responsibility and cultural respectfulness
Learning objectives.
Learners will be able to…
- Identify how researchers can conduct ethically responsible qualitative data analysis.
- Explain the role of culture and cultural context in qualitative data analysis (for both researcher and participant)
The ethics of deconstructing stories
Throughout this chapter, I will consistently suggest that you will be deconstructing data . That is to say, you will be taking the information that participants share with you through their words, performances, videos, documents, photos, and artwork, then breaking it up into smaller points of data, which you will then reassemble into your findings. We have an ethical responsibility to treat what is shared with a sense of respect during this process of deconstruction and reconstruction . This means that we make conscientious efforts not to twist, change, or subvert the meaning of data as we break them down or string them back together.
The act of bringing together people’s stories through qualitative research is not an easy one and shouldn’t be taken lightly. Through the informed consent process, participants should learn about the ways in which their information will be used in your research, including giving them a general idea what will happen in your analysis and what format the end results of that process will likely be.
A deep understanding of cultural context as we make sense of meaning
Similar to the ethical considerations we need to keep in mind as we deconstruct stories, we also need to work diligently to understand the cultural context in which these stories are shared. This requires that we approach the task of analysis with a sense of cultural humility, meaning that we don’t assume that our perspective or worldview as the researcher is the same as our participants. Their life experiences may be quite different from our own, and because of this, the meaning in their stories may be very different than what we might initially expect.
As such, we need to ask questions to better understand words, phrases, ideas, gestures, etc. that seem to have particular significance to participants. We also can use activities like member checking , another tool to support qualitative rigor , to ensure that our findings are accurately interpreted by vetting them with participants prior to the study conclusion. We can spend a good amount of time getting to know the groups and communities that we work with, paying attention to their values, priorities, practices, norms, strengths, and challenges. Finally, we can actively work to challenge more traditional methods research and support more participatory models that advance community co-researchers or consistent oversight of research by community advisory groups to inform, challenge, and advance this process; thus elevating the wisdom of community members and their influence (and power) in the research process.

Accounting for our influence in the analysis process
Along with our ethical responsibility to our research participants, we also have an accountability to research consumers, the scientific community at large, and other stakeholders in our qualitative research. As qualitative researchers (or quantitative researchers, for that matter), people should expect that we have attempted, to the best of our abilities, to account for our role in the research process. This is especially true in analysis. Our finding should not emerge from some ‘black box’, where raw data goes in and findings pop out the other side, with no indication of how we arrive at them. Thus, an important part of rigor is transparency and the use of tools such as writing in reflexive journals , memoing , and creating an audit trail to assist us in documenting both our thought process and activities in reaching our findings. There will be more about this in Chapter 20 dedicated to qualitative rigor.
Key Takeaways
- Ethics, as it relates specifically to the analysis phase of qualitative research, requires that we are especially thoughtful in how we treat the data that participants share with us. This data often represents very intimate parts of people’s lives and/or how they view the world. Therefore, we need to actively conduct our analysis in a way that does not misrepresent, compromise the privacy of, and/or disenfranchise or oppress our participants and the groups they belong to.
- Part of demonstrating this ethical commitment to analysis involves capturing and documenting our influence as researchers to the qualitative research process.
After you have had a chance to read through this chapter, come back to this exercise. Think about your qualitative proposal. Based on the strategies that you might consider for analysis of your qualitative data:
- What ethical concerns do you have specific to this approach to analyzing your data?
- What steps might you take to anticipate and address these concerns?
19.2 Critical considerations
- Explain how data analysis may be used as tool for power and control
- Develop steps that reflect increased opportunities for empowerment of your study population, especially during the data analysis phase
How are participants present in the analysis process; What power or influence do they have
Remember, research is political. We need to consider that our findings represent ideas that are shared with us by living and breathing human beings and often the groups and communities that they represent. They have been gracious enough to share their time and their stories with us, yet they often have a limited role once we gather data from them. They are essentially putting their trust in us that we won’t be misrepresenting or culturally appropriating their stories in ways that will be harmful, damaging, or demeaning. Elliot (2016) [5] discusses the problems of "damaged-centered" research , which is research that portrays groups of people or communities as flawed, surrounded by problems, or incapable of producing change. Her work specifically references the way research and media have often portrayed people from the Appalachian region, and how these influences have perpetuated, reinforced, and even created stereotypes that these communities face. We need to thoughtfully consider how the research we are involved in will reflect on our participants and their communities.
Now, some research approaches, particularly participatory approaches, suggest that participants should be trained and actively engaged throughout the research process, helping to shape how our findings are presented and how the target population is portrayed. Implementing a participatory approach requires academic researchers to give up some of their power and control to community co-researchers. Ideally these co-researchers provide their input and are active members in determining what the findings are and interpreting why/how they are important. I believe this is a standard we need to strive for. However, this is the exception, not the rule. As such, if you are participating in a more traditional research role where community participants are not actively engaged, whenever possible, it is good practice to find ways to allow participants or other representatives to help lend their validation to our findings. While to a smaller extent, these opportunities suggest ways that community members can be empowered during the research process (and researchers can turn over some of our control). You may do this through activities like consulting with community representatives early and often during the analysis process and using member checking (referenced above and in our chapter on qualitative rigor) to help review and refine results. These are distinct and important roles for the community and do not mean that community members become researchers; but that they lend their perspectives in helping the researcher to interpret their findings.
The bringing together of voices: What does this represent and to whom
As social work researchers, we need to be mindful that research is a tool for advancing social justice. However, that doesn’t mean that all research fulfills that capacity or that all parties perceive it in this way. Qualitative research generally involves a relatively small number of participants (or even a single person) sharing their stories. As researchers, we then bring together this data in the analysis phase in an attempt to tell a broader story about the issue we are studying. Our findings often reflect commonalities and patterns, but also should highlight contradictions, tensions, and dissension about the topic.
Reflexive Journal Entry Prompt
Pause for a minute. Think about what the findings for your research proposal might represent.
- What do they represent to you as a researcher?
- What do they represent to participants directly involved in your study?
- What do they represent to the families of these participants?
- What do they represent to the groups and communities that represent or are connected to your population?
For each of the perspectives outlined in the reflexive journal entry prompt above, there is no single answer. As a student researcher, your study might represent a grade, an opportunity to learn more about a topic you are interested in, and a chance to hone your skills as a researcher. For participants, the findings might represent a chance to share their input or frustration that they are being misrepresented. Community members might view the research findings with skepticism that research produces any kind of change or anger that findings bring unwanted attention to the community. Obviously we can’t foretell all the answers to these questions, but thinking about them can help us to thoughtfully and carefully consider how we go about collecting, analyzing and presenting our data. We certainly need to be honest and transparent in our data analysis, but additionally, we need to consider how our analysis impacts others. It is especially important that we anticipate this and integrate it early into our efforts to educate our participants on what the research will involve, including potential risks.
It is important to note here that there are a number of perspectives that are rising to challenge traditional research methods. These challenges are often grounded in issues of power and control that we have been discussing, recognizing that research has and continues to be used as a tool for oppression and division. These perspectives include but are not limited to: Afrocentric methodologies, Decolonizing methodologies, Feminist methodologies, and Queer methodologies. While it’s a poor substitute for not diving deeper into these valuable contributions, I do want to offer a few resources if you are interested in learning more about these perspectives and how they can help to more inclusively define the research process.
- Research findings can represent many different things to many different stakeholders. Rather than as an afterthought, as qualitative researchers, we need to thoughtfully consider a range of these perspectives prior to and throughout the analysis to reduce the risk of oppression and misrepresentation through our research.
- There are a variety of strategies and whole alternative research paradigms that can aid qualitative researchers in conducting research in more empowering ways when compared to traditional research methods where the researcher largely maintain control and ownership of the research process and agenda.
This type of research means that African indigenous culture must be understood and kept at the forefront of any research and recommendations affecting indigenous communities and their culture.
Afrocentric methodologies : These methods represent research that is designed, conducted, and disseminated in ways that center and affirm African cultures, knowledge, beliefs, and values.
- Pellerin, M. (2012). Benefits of Afrocentricity in exploring social phenomena: Understanding Afrocentricity as a social science methodology .
- University of Illinois Library. (n.d.). The Afrocentric Research Center .
Decolonizing methodologies : These methods represent research that is designed, conducted, and disseminated in ways to reclaim control over indigenous ways of knowing and being. [6]
- Paris, D., & Winn, M. T. (Eds.). (2013). Humanizing research: Decolonizing qualitative inquiry with youth and communities . Sage Publications.
- Smith, L. T. (2012). Decolonizing methodologies: Research and indigenous peoples (2nd ed.). Zed Books Ltd.
Feminist methodologies : Research methods in this tradition seek to, “remove the power imbalance between research and subject; (are) politically motivated in that (they) seeks to change social inequality; and (they) begin with the standpoints and experiences of women”. [7]
- Gill, J. (n.d.) Feminist research methodologies. Feminist Perspectives on Media and Technology .
- U.C.Davis., Feminist Research Institute. (n.d.). What is feminist research?
Queer(ing) methodologies : Research methods using this approach aim to question, challenge and often reject knowledge that is commonly accepted and privileged in society and elevate and empower knowledge and perspectives that are often perceived as non-normative.
- de Jong, D. H. (2014). A new paradigm in social work research: It’s here, it’s queer, get used to it! .
- Ghaziani, A., & Brim, M. (Eds.). (2019). Imagining queer methods . NYU Press.
19.3 Preparations: Creating a plan for qualitative data analysis
- Identify how your research question, research aim, sample selection, and type of data may influence your choice of analytic methods
- Outline the steps you will take in preparation for conducting qualitative data analysis in your proposal
Now we can turn our attention to planning your analysis. The analysis should be anchored in the purpose of your study. Qualitative research can serve a range of purposes. Below is a brief list of general purposes we might consider when using a qualitative approach.
- Are you trying to understand how a particular group is affected by an issue?
- Are you trying to uncover how people arrive at a decision in a given situation?
- Are you trying to examine different points of view on the impact of a recent event?
- Are you trying to summarize how people understand or make sense of a condition?
- Are you trying to describe the needs of your target population?
If you don’t see the general aim of your research question reflected in one of these areas, don’t fret! This is only a small sampling of what you might be trying to accomplish with your qualitative study. Whatever your aim, you need to have a plan for what you will do once you have collected your data.
Decision Point: What are you trying to accomplish with your data?
- Consider your research question. What do you need to do with the qualitative data you are gathering to help answer that question?
To help answer this question, consider:
- What action verb(s) can be associated with your project and the qualitative data you are collecting? Does your research aim to summarize, compare, describe, examine, outline, identify, review, compose, develop, illustrate, etc.?
- Then, consider noun(s) you need to pair with your verb(s)—perceptions, experiences, thoughts, reactions, descriptions, understanding, processes, feelings, actions responses, etc.
Iterative or linear
We touched on this briefly in Chapter 17 about qualitative sampling, but this is a n important distinction to consider. Some qualitative research is linear , meaning it follows more of a tra ditionally quantitative process: create a plan, gather data, and analyze data; each step is completed before we proceed to the next. You can think of this like how information is presented in this book. We discuss each topic, one after another.
However, many times qualitative research is iterative , or evolving in cycles. An iterative approach means that once we begin collecting data, we also begin analyzing data as it is coming in. This early and ongoing analysis of our (incomplete) data then impacts our continued planning, data gathering and future analysis. Again, coming back to this book, while it may be written linear, we hope that you engage with it iteratively as you are building your proposal. By this we mean that you will revisit previous sections so you can understand how they fit together and you are in continuous process of building and revising how you think about the concepts you are learning about.
As you may have guessed, there are benefits and challenges to both linear and iterative approaches. A linear approach is much more straightforward, each step being fairly defined. However, linear research being more defined and rigid also presents certain challenges. A linear approach assumes that we know what we need to ask or look for at the very beginning of data collection, which often is not the case.

With iterative research, we have more flexibility to adapt our approach as we learn new things. We still need to keep our approach systematic and organized, however, so that our work doesn’t become a free-for-all. As we adapt, we do not want to stray too far from the original premise of our study. It’s also important to remember with an iterative approach that we may risk ethical concerns if our work extends beyond the original boundaries of our informed consent and IRB agreement. If you feel that you do need to modify your original research plan in a significant way as you learn more about the topic, you can submit an addendum to modify your original application that was submitted. Make sure to keep detailed notes of the decisions that you are making and what is informing these choices. This helps to support transparency and your credibility throughout the research process.
Decision Point: Will your analysis reflect more of a linear or an iterative approach?
- What justifies or supports this decision?
Think about:
- Fit with your research question
- Available time and resources
- Your knowledge and understanding of the research process
- What evidence are you basing this on?
- How might this help or hinder your qualitative research process?
- How might this help or hinder you in a practice setting as you work with clients?
Acquainting yourself with your data
As y ou begin your analysis, y ou need to get to know your data. This usually means reading through your data prior to any attempt at breaking it apart and labeling it. You mig ht read through a couple of times, in fact. This helps give you a more comprehensive feel for each piece of data and the data as a whole, again, before you start to break it down into smaller units or deconstruct it. This is especially important if others assisted us in the data collection process. We often gather data as part of team and everyone involved in the analysis needs to be very familiar with all of the data.
Capturing your reaction to the data
During the review process, our understanding of the data often evolves as we observe patterns and trends. It is a good practice to document your reaction and evolving understanding. Your reaction can include noting phrases or ideas that surprise you, similarities or distinct differences in responses, additional questions that the data brings to mind, among other things. We often record these reactions directly in the text or artifact if we have the ability to do so, such as making a comment in a word document associated with a highlighted phrase. If this isn’t possible, you will want to have a way to track what specific spot(s) in your data your reactions are referring to. In qualitative research we refer to this process as memoing . Memoing is a strategy that helps us to link our findings to our raw data, demonstrating transparency. If you are using a Computre-Assisted Qualitative Data Analysis Software (CAQDAS) software package, memoing functions are generally built into the technology.
Capturing your emerging understanding of the data
During your reviewing and memoing you will start to develop and evolve your understanding of what the data means. This understanding should be dynamic and flexible, but you want to have a way to capture this understanding as it evolves. You may include this as part of your memoing or as part of your codebook where you are tracking the main ideas that are emerging and what they mean. Figure 19.3 is an example of how your thinking might change about a code and how you can go about capturing it. Coding is a part of the qualitative data analysis process where we begin to interpret and assign meaning to the data. It represents one of the first steps as we begin to filter the data through our own subjective lens as the researcher. We will discuss coding in much more detail in the sections below covering various different approaches to analysis.
Decision Point: How to capture your thoughts?
- What will this look like?
- How often will you do it?
- How will you keep it organized and consistent over time?
In addition, you will want to be actively using your reflexive journal during this time. Document your thoughts and feelings throughout the research process. This will promote transparency and help account for your role in the analysis.
For entries during your analysis, respond to questions such as these in your journal:
- What surprises you about what participants are sharing?
- How has this information challenged you to look at this topic differently?
- Where might these have come from?
- How might these be influencing your study?
- How will you proceed differently based on what you are learning?
By including community members as active co-researchers, they can be invaluable in reviewing, reacting to and leading the interpretation of data during your analysis. While it can certainly be challenging to converge on an agreed-upon version of the results; their insider knowledge and lived experience can provide very important insights into the data analysis process.
Determining when you are finished
When conducting quantitative research, it is perhaps easier to decide when we are finished with our analysis. We determine the tests we need to run, we perform them, we interpret them, and for the most part, we call it a day. It’s a bit more nebulous for qualitative research. There is no hard and fast rule for when we have completed our qualitative analysis. Rather, our decision to end the analysis should be guided by reflection and consideration of a number of important questions. These questions are presented below to help ensure that your analysis results in a finished product that is comprehensive, systematic, and coherent.
Have I answered my research question?
Your analysis should be clearly connected to and in service of answering your research question. Your examination of the data should help you arrive at findings that sufficiently address the question that you set out to answer. You might find that it is surprisingly easy to get distracted while reviewing all your data. Make sure as you conducted the analysis you keep coming back to your research question.
Have I utilized all my data?
Unless you have intentionally made the decision that certain portions of your data are not relevant for your study, make sure that you don’t have sources or segments of data that aren’t incorporated into your analysis. Just because some data doesn’t “fit” the general trends you are uncovering, find a way to acknowledge this in your findings as well so that these voices don’t get lost in your data.
Have I fulfilled my obligation to my participants?
As a qualitative researcher, you are a craftsperson. You are taking raw materials (e.g. people’s words, observations, photos) and bringing them together to form a new creation, your findings. These findings need to both honor the original integrity of the data that is shared with you, but also help tell a broader story that answers your research question(s).
Have I fulfilled my obligation to my audience?
Not only do your findings need to help answer your research question, but they need to do so in a way that is consumable for your audience. From an analysis standpoint, this means that we need to make sufficient efforts to condense our data. For example, if you are conducting a thematic analysis, you don’t want to wind up with 20 themes. Having this many themes suggests that you aren’t finished looking at how these ideas relate to each other and might be combined into broader themes. Having these sufficiently reduced to a handful of themes will help tell a more complete story, one that is also much more approachable and meaningful for your reader.
In the following subsections, there is information regarding a variety of different approaches to qualitative analysis. In designing your qualitative study, you would identify an analytical approach as you plan out your project. The one you select would depend on the type of data you have and what you want to accomplish with it.
- Qualitative research analysis requires preparation and careful planning. You will need to take time to familiarize yourself with the data in general sense before you begin analyzing.
- Once you begin your analysis, make sure that you have strategies for capture and recording both your reaction to the data and your corresponding developing understanding of what the collective meaning of the data is (your results). Qualitative research is not only invested in the end results but also the process at which you arrive at them.
Decision Point: When will you stop?
- How will you know when you are finished? What will determine your endpoint?
- How will you monitor your work so you know when it’s over?
19.4 Thematic analysis
- Explain defining features of thematic analysis as a strategy for qualitative data analysis and identify when it is most effectively used
- Formulate an initial thematic analysis plan (if appropriate for your research proposal)
What are you trying to accomplish with thematic analysis?
As its name suggests, with thematic analysis we are attempting to identify themes or common ideas across our data. Themes can help us to:
- Determine shared meaning or significance of an event
- Povide a more complete understanding of concept or idea by exposing different dimensions of the topic
- Explore a range of values, beliefs or perceptions on a given topic
Themes help us to identify common ways that people are making sense of their world. Let’s say that you are studying empowerment of older adults in assisted living facilities by interviewing residents in a number of these facilities. As you review your transcripts, you note that a number of participants are talking about the importance of maintaining connection to previous aspects of their life (e.g. their mosque, their Veterans of Foreign Wars (VFW) Post, their Queer book club) and having input into how the facility is run (e.g. representative on the board, community town hall meetings). You might note that these are two emerging themes in your data. After you have deconstructed your data, you will likely end up with a handful (likely three or four) central ideas or take-aways that become the themes or major findings of your research.
Variations in approaches to thematic analysis
There are a variety of ways to approach qualitative data analysis, but even within the broad approach of thematic analysis, there is variation. Some thematic analysis takes on an inductive analysis approach. In this case, we would first deconstruct our data into small segments representing distinct ideas (this is explained further in the section below on coding data). We then go on to see which of these pieces seem to group together around common ideas.
In direct contrast, you might take a deductive analysis approach (like we discussed in Chapter 8 ), in which you start with some idea about what grouping might look like and we see how well our data fits into those pre-identified groupings. These initial deductive groupings (we call these a priori categories) often come from an existing theory related to the topic we are studying. You may also elect to use a combination of deductive and inductive strategies, especially if you find that much of your data is not fitting into deductive categories and you decide to let new categories inductively emerge.
A couple things to note here. If you are using a deductive approach, be clear in specifying where your a priori categories came from. For instance, perhaps you are interested in studying the conceptualization of social work in other cultures. You begin your analysis with prior research conducted by Tracie Mafile’o (2004) that identified the concepts of fekau’aki (connecting) and fakatokilalo (humility) as being central to Tongan social work practice. [8] You decide to use these two concepts as part of your initial deductive framework, because you are interested in studying a population that shares much in common with the Tongan people. When using an inductive approach, you need to plan to use memoing and reflexive journaling to document where the new categories or themes are coming from.
Coding data
Coding is the process of breaking down your data into smaller meaningful units. Just like any story is made up by the bringing together of many smaller ideas, you need to uncover and label these smaller ideas within each piece of your data. After you have reviewed each piece of data you will go back and assign labels to words, phrases, or pieces of data that represent separate ideas that can stand on their own. Identifying and labeling codes can be tricky. When attempting to locate units of data to code, look for pieces of data that seem to represent an idea in-and-of-itself; a unique thought that stands alone. For additional information about coding, check out this brief video from Duke’s Social Science Research Institute on this topic. It offers a nice concise overview of coding and also ties into our previous discussion of memoing to help encourage rigor in your analysis process.
As suggested in the video [9] , when you identify segments of data and are considering what to label them ask yourself:
- How does this relate to/help to answer my research question?
- How does this connect with what we know from the existing literature?
- How does this fit (or contrast) with the rest of my data?
You might do the work of coding in the margins if you are working with hard copies, or you might do this through the use of comments or through copying and pasting if you are working with digital materials (like pasting them into an excel sheet, as in the example below). If you are using a CAQDAS, there will be a function(s) built into the software to accomplish this.
Regardless of which strategy you use, the central task of thematic analysis is to have a way to label discrete segments of your data with a short phrase that reflects what it stands for. As you come across segments that seem to mean the same thing, you will want to use the same code. Make sure to select the words to represent your codes wisely, so that they are clear and memorable. When you are finished, you will likely have hundreds (if not thousands!) of different codes – again, a story is made up of many different ideas and you are bringing together many different stories! A cautionary note, if you are physically manipulating your data in some way, for example copying and pasting, which I frequently do, you need to have a way to trace each code or little segment back to its original home (the artifact that it came from).
When I’m working with interview data, I will assign each interview transcript a code and use continuous line numbering. That way I can label each segment of data or code with a corresponding transcript code and line number so I can find where it came from in case I need to refer back to the original.
The following is an excerpt from a portion of an autobiographical memoir (Wolf, 2010) [10] . Continuous numbers have been added to the transcript to identify line numbers (Figure 19.4). A few preliminary codes have been identified from this data and entered into a data matrix (below) with information to trace back to the raw data (transcript) (Figure 19.5).
| 1 | I have a vivid picture in my mind of my mother, sitting at a kitchen table, |
| 2 | listening to the announcement of FDR’s Declaration of War in his famous “date |
| 3 | which will live in infamy” speech delivered to Congress on December 8, 1941: |
| 4 | “The United States was suddenly and deliberately attacked by naval and air forces |
| 5 | of the Empire of Japan.” I still can hear his voice. |
| 6 | |
| 7 | I couldn’t understand “war,” of course, but I knew that something terrible had |
| 8 | happened; and I wanted it to stop so my mother wouldn’t be unhappy. I later |
| 9 | asked my older brother what war was and when it would be over. He said, “Not |
| 10 | soon, so we better get ready for it, and, remember, kid, I’m a Captain and you’re a |
| 11 | private.” |
| 12 | |
| 13 | So the war became a family matter in some sense: my mother’s sorrow (thinking, |
| 14 | doubtless, about the fate and future of her sons) and my brother’s assertion of |
| 15 | male authority and superiority always thereafter would come to mind in times of |
| 16 | international conflict—just as Pearl Harbor, though it was far from the mainland, |
| 17 | always would be there for America as an icon of victimization, never more so than |
| 18 | in the semi-paranoid aftermath of “9/11” with its disastrous consequences in |
| 19 | Iraq. History always has a personal dimension. |
| I have a vivid picture in my mind of my mother, sitting at a kitchen table, listening to the announcement of FDR’s Declaration of War in his famous “date which will live in infamy” speech delivered to Congress on December 8, 1941: “The United States was suddenly and deliberately attacked by naval and air forces of the Empire of Japan.” I still can hear his voice. | Wolf Memoir | 1-5 | Memories |
| I couldn’t understand “war,” of course, but I knew that something terrible had happened; and I wanted it to stop so my mother wouldn’t be unhappy. | Wolf Memoir | 7-8 | Meaning of War |
| I later asked my older brother what war was and when it would be over. He said, “Not soon, so we better get ready for it, and, remember, kid, I’m a Captain and you’re a private.” | Wolf Memoir | 8-11 | Meaning of War; Memories |
Below is another excerpt from the same memoir [11]
What segments of this interview can you pull out and what initial code would you place on them?
Create a data matrix as you reflect on this.
It was painful to think, even at an early age, that a part of the world I was beginning to love—Europe—was being substantially destroyed by the war; that cities with their treasures, to say nothing of innocent people, were being bombed and consumed in flames. I was a patriotic young American and wanted “us” to win the war, but I also wanted Europe to be saved.
Some displaced people began to arrive in our apartment house, and even as I knew that they had suffered in Europe, their names and language pointed back to a civilized Europe that I wanted to experience. One person, who had studied at Heidelberg, told me stories about student life in the early part of the 20 th century that inspired me to want to become an accomplished student, if not a “student prince.” He even had a dueling scar. A baby-sitter showed me a photo of herself in a feathered hat, standing on a train platform in Bratislava. I knew that she belonged in a world that was disappearing.
For those of us growing up in New York City in the 1940s, Japan, following Pearl Harbor and the “death march” in Corregidor, seemed to be our most hated enemy. The Japanese were portrayed as grotesque and blood-thirsty on posters. My friends and I were fighting back against the “Japs” in movie after movie: Gung Ho, Back to Bataan, The Purple Heart, Thirty Seconds Over Tokyo, They Were Expendable, and Flying Tigers, to name a few.
We wanted to be like John Wayne when we grew up. It was only a few decades after the war, when we realized the horrors of Hiroshima and Nagasaki, that some of us began to understand that the Japanese, whatever else was true, had been dehumanized as a people; that we had annihilated, guiltlessly at the time, hundreds of thousands of non-combatants in a horrific flash. It was only after the publication of John Hersey’s Hiroshima(1946), that we began to think about other sides of the war that patriotic propaganda had concealed.
When my friends and I went to summer camp in the foothills of the Berkshires during the late years of the war and sang patriotic songs around blazing bonfires, we weren’t thinking about the firestorms of Europe (Dresden) and Japan. We were worried that our counselors would be drafted and suddenly disappear, leaving us unprotected.
Identifying, reviewing, and refining themes
Now we have our codes, we need to find a sensible way of putting them together. Remember, we want to narrow this vast field of hundreds of codes down to a small handful of themes. If we don’t review and refine all these codes, the story we are trying to tell with our data becomes distracting and diffuse. An example is provided below to demonstrate this process.
As we refine our thematic analysis, our first step will be to identify groups of codes that hang together or seem to be related. Let’s say y ou are studying the experience of people who are in a vocational preparation program and you have codes labeled “worrying about paying the bills” and “loss of benefits”. You might group these codes into a category you label “income & expenses” (Figrue 19.6).
| Worrying about paying the bills | Income & expenses | Seem to be talking about financial stressors and potential impact on resources |
| Loss of benefits |
| Worrying about Paying the bills | Income & expenses | Seem to be talking about financial stressors and potential impact on resources | Financial insecurities | Expanded category to also encompass personal factor- confidence related to issue |
| Loss of benefits | ||||
| Not confident managing money |
You may review and refine the groups of your codes many times during the course of your analysis, including shifting codes around from one grouping to another as you get a clearer picture of what each of the groups represent. This reflects the iterative process we were describing earlier. While you are shifting codes and relabeling categories, track this! A research journal is a good place to do this. So, as in the example above, you would have a journal entry that explains that you changed the label on the category from “income & expenses” to “financial insecurities” and you would briefly explain why. Your research journal can take many different forms. It can be hard copy, an evolving word document, or a spreadsheet with multiple tabs (Figure 19.8).
Now, eventually you may decide that some of these categories can also be grouped together, but still stand alone as separate ideas. Continuing with our example above, you have another category labeled “financial potential” that contains codes like “money to do things” and “saving for my future”. You determine that “financial insecurities” and “financial potential” are related, but distinctly different aspects of a broader grouping, which you go on to label “financial considerations”. This broader grouping reflects both the more worrisome or stressful aspects of people’s experiences that you have interviewed, but also the optimism and hope that was reflected related to finances and future work (Figure 19.9).
| Worrying about paying the bills | Income & expenses | Seem to be talking about financial stressors and potential impact on resources | Financial insecurities | Expanded category to also encompass personal factor- confidence related to issue | Financial considerations |
| Loss of benefits | |||||
| Not confident managing money | |||||
| Money to do things | Financial potential | Reflects positive aspects related to earnings | |||
| Saving for my future |
This broadest grouping then becomes your theme and utilizing the categories and the codes contained therein, you create a description of what each of your themes means based on the data you have collected, and again, can record this in your research journal entry (Figure 19.10).
Building a thematic representation
However, providing a list of themes may not really tell the whole story of your study. It may fail to explain to your audience how these individual themes relate to each other. A thematic map or thematic array can do just that: provides a visual representation of how each individual category fits with the others. As you build your thematic representation, be thoughtful of how you position each of your themes, as this spatially tells part of the story. [12] You should also make sure that the relationships between the themes represented in your thematic map or array are narratively explained in your text as well.
Figure 19.11 offers an illustration of the beginning of thematic map for the theme we had been developing in the examples above. I emphasize that this is the beginning because we would likely have a few other themes (not just “financial considerations”). These other themes might have codes or categories in common with this theme, and these connections would be visual evident in our map. As you can see in the example, the thematic map allows the reader, reviewer, or researcher can quickly see how these ideas relate to each other. Each of these themes would be explained in greater detail in our write up of the results. Additionally, sample quotes from the data that reflected those themes are often included.

- Thematic analysis offers qualitative researchers a method of data analysis through which we can identify common themes or broader ideas that are represented in our qualitative data.
- Themes are identified through an iterative process of coding and categorizing (or grouping) to identify trends during your analysis.
- Tracking and documenting this process of theme identification is an important part of utilizing this approach.
References for learning more about Thematic Analysis
Clarke, V. (2017, December 9). What is thematic analysis?
Maguire, M., & Delahunt, B. (2017). Doing a thematic analysis: A practical, step-by-step guide for learning and teaching scholars .
Nowell et al. (2017). Thematic analysis: Striving to meet the trustworthiness criteria .
The University of Auckland. (n.d.). Thematic analysis: A reflexive approach .
A few exemplars of studies employing Thematic Analysis
Bastiaensens et al. (2019). “Were you cyberbullied? Let me help you.” Studying adolescents’ online peer support of cyberbullying victims using thematic analysis of online support group Fora .
Borgström, Å., Daneback, K., & Molin, M. (2019). Young people with intellectual disabilities and social media: A literature review and thematic analysis .
Kapoulitsas, M., & Corcoran, T. (2015). Compassion fatigue and resilience: A qualitative analysis of social work practice .
19.5 Content analysis
- Explain defining features of content analysis as a strategy for analyzing qualitative data
- Determine when content analysis can be most effectively used
- Formulate an initial content analysis plan (if appropriate for your research proposal)
What are you trying to accomplish with content analysis
Much like with thematic analysis, if you elect to use content analysis to analyze your qualitative data, you will be deconstructing the artifacts that you have sampled and looking for similarities across these deconstructed parts. Also consistent with thematic analysis, you will be seeking to bring together these similarities in the discussion of your findings to tell a collective story of what you learned across your data. While the distinction between thematic analysis and content analysis is somewhat murky, if you are looking to distinguish between the two, content analysis:
- Places greater emphasis on determining the unit of analysis. Just to quickly distinguish, when we discussed sampling in Chapter 10 we also used the term “unit of analysis. As a reminder, when we are talking about sampling, unit of analysis refers to the entity that a researcher wants to say something about at the end of her study (individual, group, or organization). However, for our purposes when we are conducting a content analysis, this term has to do with the ‘chunk’ or segment of data you will be looking at to reflect a particular idea. This may be a line, a paragraph, a section, an image or section of an image, a scene, etc., depending on the type of artifact you are dealing with and the level at which you want to subdivide this artifact.
- Content analysis is also more adept at bringing together a variety of forms of artifacts in the same study. While other approaches can certainly accomplish this, content analysis more readily allows the researcher to deconstruct, label and compare different kinds of ‘content’. For example, perhaps you have developed a new advocacy training for community members. To evaluate your training you want to analyze a variety of products they create after the workshop, including written products (e.g. letters to their representatives, community newsletters), audio/visual products (e.g. interviews with leaders, photos hosted in a local art exhibit on the topic) and performance products (e.g. hosting town hall meetings, facilitating rallies). Content analysis can allow you the capacity to examine evidence across these different formats.
For some more in-depth discussion comparing these two approaches, including more philosophical differences between the two, check out this article by Vaismoradi, Turunen, and Bondas (2013) . [13]
Variations in the approach
There are also significant variations among different content analysis approaches. Some of these approaches are more concerned with quantifying (counting) how many times a code representing a specific concept or idea appears. These are more quantitative and deductive in nature. Other approaches look for codes to emerge from the data to help describe some idea or event. These are more qualitative and inductive . Hsieh and Shannon (2005) [14] describe three approaches to help understand some of these differences:
- Conventional Content Analysis. Starting with a general idea or phenomenon you want to explore (for which there is limited data), coding categories then emerge from the raw data. These coding categories help us understand the different dimensions, patterns, and trends that may exist within the raw data collected in our research.
- Directed Content Analysis. Starts with a theory or existing research for which you develop your initial codes (there is some existing research, but incomplete in some aspects) and uses these to guide your initial analysis of the raw data to flesh out a more detailed understanding of the codes and ultimately, the focus of your study.
- Summative Content Analysis. Starts by examining how many times and where codes are showing up in your data, but then looks to develop an understanding or an “interpretation of the underlying context” (p.1277) for how they are being used. As you might have guessed, this approach is more likely to be used if you’re studying a topic that already has some existing research that forms a basic place to begin the analysis.
This is only one system of categorization for different approaches to content analysis. If you are interested in utilizing a content analysis for your proposal, you will want to design an approach that fits well with the aim of your research and will help you generate findings that will help to answer your research question(s). Make sure to keep this as your north star, guiding all aspects of your design.
Determining your codes
We are back to coding! As in thematic analysis, you will be coding your data (labeling smaller chunks of information within each data artifact of your sample). In content analysis, you may be using pre-determined codes, such as those suggested by an existing theory (deductive) or you may seek out emergent codes that you uncover as you begin reviewing your data (inductive). Regardless of which approach you take, you will want to develop a well-documented codebook.
A codebook is a document that outlines the list of codes you are using as you analyze your data, a descriptive definition of each of these codes, and any decision-rules that apply to your codes. A decision-rule provides information on how the researcher determines what code should be placed on an item, especially when codes may be similar in nature. If you are using a deductive approach, your codebook will largely be formed prior to analysis, whereas if you use an inductive approach, your codebook will be built over time. To help illustrate what this might look like, Figure 19.12 offers a brief excerpt of a codebook from one of the projects I’m currently working on.

Coding, comparing, counting
Once you have (or are developing) your codes, your next step will be to actually code your data. In most cases, you are looking for your coding structure (your list of codes) to have good coverage . This means that most of the content in your sample should have a code applied to it. If there are large segments of your data that are uncoded, you are potentially missing things. Now, do note that I said most of the time. There are instances when we are using artifacts that may contain a lot of information, only some of which will apply to what we are studying. In these instances, we obviously wouldn’t be expecting the same level of coverage with our codes. As you go about coding you may change, refine and adapt your codebook as you go through your data and compare the information that reflects each code. As you do this, keep your research journal handy and make sure to capture and record these changes so that you have a trail documenting the evolution of your analysis. Also, as suggested earlier, content analysis may also involve some degree of counting as well. You may be keeping a tally of how many times a particular code is represented in your data, thereby offering your reader both a quantification of how many times (and across how many sources) a code was reflected and a narrative description of what that code came to mean.
Representing the findings from your coding scheme
Finally, you need to consider how you will represent the findings from your coding work. This may involve listing out narrative descriptions of codes, visual representations of what each code came to mean or how they related to each other, or a table that includes examples of how your data reflected different elements of your coding structure. However you choose to represent the findings of your content analysis, make sure the resulting product answers your research question and is readily understandable and easy-to-interpret for your audience.
- Much like thematic analysis, content analysis is concerned with breaking up qualitative data so that you can compare and contrast ideas as you look across all your data, collectively. A couple of distinctions between thematic and content analysis include content analysis’s emphasis on more clearly specifying the unit of analysis used for the purpose of analysis and the flexibility that content analysis offers in comparing across different types of data.
- Coding involves both grouping data (after it has been deconstructed) and defining these codes (giving them meaning). If we are using a deductive approach to analysis, we will start with the code defined. If we are using an inductive approach, the code will not be defined until the end of the analysis.
Identify a qualitative research article that uses content analysis (do a quick search of “qualitative” and “content analysis” in your research search engine of choice).
- How do the authors display their findings?
- What was effective in their presentation?
- What was ineffective in their presentation?
Resources for learning more about Content Analysis
Bengtsson, M. (2016). How to plan and perform a qualitative study using content analysis .
Colorado State University (n.d.) Writing@CSU Guide: Content analysis .
Columbia University Mailman School of Public Health, Population Health. (n.d.) Methods: Content analysis
Mayring, P. (2000, June). Qualitative content analysis .
A few exemplars of studies employing Content Analysis
Collins et al. (2018). Content analysis of advantages and disadvantages of drinking among individuals with the lived experience of homelessness and alcohol use disorders .
Corley, N. A., & Young, S. M. (2018). Is social work still racist? A content analysis of recent literature .
Deepak et al. (2016). Intersections between technology, engaged learning, and social capital in social work education .
19.6 Grounded theory analysis
- Explain defining features of grounded theory analysis as a strategy for qualitative data analysis and identify when it is most effectively used
- Formulate an initial grounded theory analysis plan (if appropriate for your research proposal)
What are you trying to accomplish with grounded theory analysis
Just to be clear, grounded theory doubles as both qualitative research design (we will talk about some other qualitative designs in Chapter 22 ) and a type of qualitative data analysis. Here we are specifically interested in discussing grounded theory as an approach to analysis in this chapter. With a grounded theory analysis , we are attempting to come up with a common understanding of how some event or series of events occurs based on our examination of participants’ knowledge and experience of that event. Let’s consider the potential this approach has for us as social workers in the fight for social justice. Using grounded theory analysis we might try to answer research questions like:
- How do communities identity, organize, and challenge structural issues of racial inequality?
- How do immigrant families respond to threat of family member deportation?
- How has the war on drugs campaign shaped social welfare practices?
In each of these instances, we are attempting to uncover a process that is taking place. To do so, we will be analyzing data that describes the participants’ experiences with these processes and attempt to draw out and describe the components that seem quintessential to understanding this process.
Differences in approaches to grounded theory analysis largely lie in the amount (and types) of structure that are applied to the analysis process. Strauss and Corbin (2014) [15] suggest a highly structured approach to grounded theory analysis, one that moves back and forth between the data and the evolving theory that is being developed, making sure to anchor the theory very explicitly in concrete data points. With this approach, the researcher role is more detective-like; the facts are there, and you are uncovering and assembling them, more reflective of deductive reasoning . While Charmaz (2014) [16] suggests a more interpretive approach to grounded theory analysis, where findings emerge as an exchange between the unique and subjective (yet still accountable) position of the researcher(s) and their understanding of the data, acknowledging that another researcher might emerge with a different theory or understanding. So in this case, the researcher functions more as a liaison, where they bridge understanding between the participant group and the scientific community, using their own unique perspective to help facilitate this process. This approach reflects inductive reasoning .
Coding in grounded theory
Coding in grounded theory is generally a sequential activity. First, the researcher engages in open coding of the data. This involves reviewing the data to determine the preliminary ideas that seem important and potential labels that reflect their significance for the event or process you are studying. Within this open coding process, the researcher will also likely develop subcategories that help to expand and provide a richer understanding of what each of the categories can mean. Next, axial coding will revisit the open codes and identify connections between codes, thereby beginning to group codes that share a relationship. Finally, selective or theoretical coding explores how the relationships between these concepts come together, providing a theory that describes how this event or series of events takes place, often ending in an overarching or unifying idea tying these concepts together. Dr. Tiffany Gallicano [17] has a helpful blog post that walks the reader through examples of each stage of coding. Figure 19.13 offers an example of each stage of coding in a study examining experiences of students who are new to online learning and how they make sense of it. Keep in mind that this is an evolving process and your document should capture this changing process. You may notice that in the example “Feels isolated from professor and classmates” is listed under both axial codes “Challenges presented by technology” and “Course design”. This isn’t an error; it just represents that it isn’t yet clear if this code is most reflective of one of these two axial codes or both. Eventually, the placement of this code may change, but we will make sure to capture why this change is made.
| Anxious about using new tools | Challenges presented by technology | Doubts, insecurities and frustration experienced by new online learners |
| Lack of support for figuring technology out | ||
| Feels isolated from professor and classmates | ||
| Twice the work—learn the content and how to use the technology | ||
| Limited use of teaching activities (e.g. “all we do is respond to discussion boards”) | Course design | |
| Feels isolated from professor and classmates | ||
| Unclear what they should be taking away from course work and materials | ||
| Returning student, feel like I’m too old to learn this stuff | Learner characteristics | |
| Home feels chaotic, hard to focus on learning |
Constant comparison
While ground theory is not the only approach to qualitative analysis that utilizes constant comparison, it is certainly widely associated with this approach. Constant comparison reflects the motion that takes place throughout the analytic process (across the levels of coding described above), whereby as researchers we move back and forth between the data and the emerging categories and our evolving theoretical understanding. We are continually checking what we believe to be the results against the raw data. It is an ongoing cycle to help ensure that we are doing right by our data and helps ensure the trustworthiness of our research. Ground theory often relies on a relatively large number of interviews and usually will begin analysis while the interviews are ongoing. As a result, the researcher(s) work to continuously compare their understanding of findings against new and existing data that they have collected.
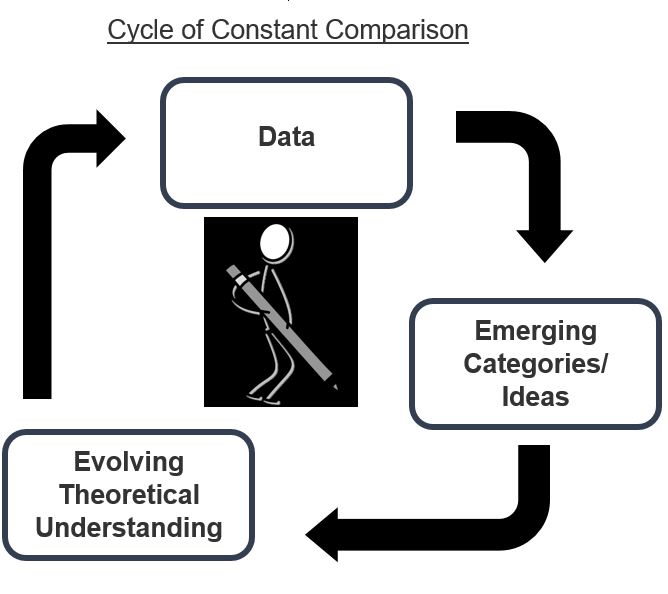
Developing your theory
Remember, the aim of using a grounded theory approach to your analysis is to develop a theory, or an explanation of how a certain event/phenomenon/process occurs. As you bring your coding process to a close, you will emerge not just with a list of ideas or themes, but an explanation of how these ideas are interrelated and work together to produce the event you are studying. Thus, you are building a theory that explains the event you are studying that is grounded in the data you have gathered.
Thinking about power and control as we build theories
I want to bring the discussion back to issues of power and control in research. As discussed early in this chapter, regardless of what approach we are using to analyze our data we need to be concerned with the potential for abuse of power in the research process and how this can further contribute to oppression and systemic inequality. I think this point can be demonstrated well here in our discussion of grounded theory analysis. Since grounded theory is often concerned with describing some aspect of human behavior: how people respond to events, how people arrive at decisions, how human processes work. Even though we aren’t necessarily seeking generalizable results in a qualitative study, research consumers may still be influenced by how we present our findings. This can influence how they perceive the population that is represented in our study. For example, for many years science did a great disservice to families impacted by schizophrenia, advancing the theory of the schizophrenogenic mother [18] . Using pseudoscience , the scientific community misrepresented the influence of parenting (a process), and specifically the mother’s role in the development of the disorder of schizophrenia. You can imagine the harm caused by this theory to family dynamics, stigma, institutional mistrust, etc. To learn more about this you can read this brief but informative editorial article by Anne Harrington in the Lancet . [19] Instances like these should haunt and challenge the scientific community to do better. Engaging community members in active and more meaningful ways in research is one important way we can respond. Shouldn’t theories be built by the people they are meant to represent?
- Ground theory analysis aims to develop a common understanding of how some event or series of events occurs based on our examination of participants’ knowledge and experience of that event.
- Using grounded theory often involves a series of coding activities (e.g. open, axial, selective or theoretical) to help determine both the main concepts that seem essential to understanding an event, but also how they relate or come together in a dynamic process.
- Constant comparison is a tool often used by qualitative researchers using a grounded theory analysis approach in which they move back and forth between the data and the emerging categories and the evolving theoretical understanding they are developing.
Resources for learning more about Grounded Theory
Chun Tie, Y., Birks, M., & Francis, K. (2019). Grounded theory research: A design framework for novice researchers .
Gibbs, G.R. (2015, February 4). A discussion with Kathy Charmaz on Grounded Theory .
Glaser, B.G., & Holton, J. (2004, May). Remodeling grounded theory .
Mills, J., Bonner, A., & Francis, K. (2006). The development of Constructivist Grounded Theory .
A few exemplars of studies employing Grounded Theory
Burkhart, L., & Hogan, N. (2015). Being a female veteran: A grounded theory of coping with transitions .
Donaldson, W. V., & Vacha-Haase, T. (2016). Exploring staff clinical knowledge and practice with LGBT residents in long-term care: A grounded theory of cultural competency and training needs .
Vanidestine, T., & Aparicio, E. M. (2019). How social welfare and health professionals understand “Race,” Racism, and Whiteness: A social justice approach to grounded theory .
19.7 Photovoice
- Explain defining features of photovoice as a strategy for qualitative data analysis and identify when it is most effectively used
- Formulate an initial analysis plan using photovoice (if appropriate for your research proposal)
What are you trying to accomplish with photovoice analysis?
Photovoice is an approach to qualitative research that combines the steps of data gathering and analysis with visual and narrative data. The ultimate aim of the analysis is to produce some kind of desired change with and for the community of participants. While other analysis approaches discussed here may involve including participants more actively in the research process, it is certainly not the norm. However, with photovoice, it is. Using an approach that involves photovoice will generally assume that the participants in your study will be taking on a very active role throughout the research process, to the point of acting as co-researchers. This is especially evident during the analysis phase of your work.
As an example of this work, Mitchell (2018) [20] combines photovoice and an environmental justice approach to engage a Native American community around the significance and the implications of water for their tribe. This research is designed to help raise awareness and support advocacy efforts for improved access to and quality of natural resources for this group. Photovoice has grown out of participatory and community-based research traditions that assume that community members have their own expertise they bring to the research process, and that they should be involved, empowered, and mutually benefit from research that is being conducted. This mutual benefit means that this type of research involves some kind of desired and very tangible changes for participants; the research will support something that community members want to see happen. Examples of these changes could be legislative action, raising community awareness, or changing some organizational practice(s).
Training your team
Because this approach involve s participants not just sharing information, but actually utilizing research skills to help collect and interpret data, as a researcher you need to take on an educator role and share your research expertise in preparing them to do so. After recruiting and gathering informed consent, part of the on-boarding process will be to determine the focus of your study. Some photovoice projects are more prescribed, where the researcher comes with an idea and seeks to partner with a specific group or community to explore this topic. At other times, the researcher joins with the community first, and collectively they determine the focus of the study and craft the research question. Once this focus has been determined and shared, the team will be charged with gathering photos or videos that represent responses to the research question for each individual participant. Depending on the technology used to capture these photos (e.g. cameras, ipads, video recorders, cell phones), training may need to be provided.
Once photos have been captured, team members will be asked to provide a caption or description that helps to interpret what their picture(s) mean in relation to the focus of the study. After this, the team will collectively need to seek out themes and patterns across the visual and narrative representations. This means you may employ different elements of thematic or content analysis to help you interpret the collective meaning across the data and you will need to train your team to utilize these approaches.
Converging on a shared story
Once you have found common themes, together you will work to assemble these into a cohesive broader story or message regarding the focus of your topic. Now remember, the participatory roots of photovoice suggest that the aim of this message is to seek out, support, encourage or demand some form of change or transformation, so part of what you will want to keep in mind is that this is intended to be a persuasive story. Your research team will need to consider how to put your findings together in a way that supports this intended change. The packaging and format of your findings will have important implications for developing and disseminating the final products of qualitative research. Chapter 21 focuses more specifically on decisions connected with this phase of the research process.
- Photovoice is a unique approach to qualitative research that combines visual and narrative information in an attempt to produce more meaningful and accessible results as an alternative to other traditional research methods.
- A cornerstone of Photovoice research involves the training and participation of community members during the analysis process. Additionally, the results of the analysis are often intended for some form of direct change or transformation that is valued by the community.
After learning about these different types of qualitative analysis:
- Which of these approaches make the most sense to you and how you view the world?
- Which of them are most appealing and why?
- Which do you want to learn more about?
Decision Point: How will you conduct your analysis?
- What makes this the most effective choice?
- Outline the steps you plan to take to conduct your analysis
- What peer-reviewed resources have you gathered to help you learn more about this method of analysis? (keep these handy for when you write-up your study!)
Resources for learning more about Photovice:
Liebenberg, L. (2018). Thinking critically about photovoice: Achieving empowerment and social change .
Mangosing, D. (2015, June 18). Photovoice training and orientation .
University of Kansas, Community Toolbox. (n.d.). Section 20. Implementing Photovoice in Your Community .
Woodgate et al. (2017, January). Worth a thousand words? Advantages, challenges and opportunities in working with photovoice as a qualitative research method with youth and their families .
A few exemplars of studies employing Photovoice:
Fisher-Borne, M., & Brown, A. (2018). A case study using Photovoice to explore racial and social identity among young Black men: Implications for social work research and practice .
Houle et al. (2018). Public housing tenants’ perspective on residential environment and positive well-being: An empowerment-based Photovoice study and its implications for social work .
Mitchell, F. M. (2018). “Water Is Life”: Using photovoice to document American Indian perspectives on water and health .
Media Attributions
- no black box © Cory Cummings
- iterative v linear © Cory Cummings
- discussing around table © Activités culturelles UdeM is licensed under a Public Domain license
- thematic map © Cory Cummings
- codebook and decision rules
- constant compare © JohannaMarie is licensed under a CC0 (Creative Commons Zero) license
- community meeting © Korean Resource Center 민족학교 is licensed under a CC BY-ND (Attribution NoDerivatives) license
- photo exhibit © University of the Fraser Valley, I Lead Abbey Youth 4 Change is licensed under a CC BY (Attribution) license
- Kleining, G., & Witt, H. (2000). The qualitative heuristic approach: A methodology for discovery in psychology and the social sciences. Rediscovering the method of introspection as an example. Forum Qualitative Sozialforschung/Forum: Qualitative Social Research, 1 (1). ↵
- Burck, C. (2005). Comparing qualitative research methodologies for systemic research: The use of grounded theory, discourse analysis and narrative analysis. Journal of Family Therapy, 27 (3), 237-262. ↵
- Mogashoa, T. (2014). Understanding critical discourse analysis in qualitative research. International Journal of Humanities Social Sciences and Education, 1 (7), 104-113. ↵
- Contandriopoulos, D., Larouche, C., Breton, M., & Brousselle, A. (2018). A sociogram is worth a thousand words: proposing a method for the visual analysis of narrative data. Qualitative Research, 18 (1), 70-87. ↵
- Elliott, L. (2016, January, 16). Dangers of “damage-centered” research . The Ohio State University, College of Arts and Sciences: Appalachian Student Resources. https://u.osu.edu/appalachia/2016/01/16/dangers-of-damage-centered-research/ ↵
- Smith, L. T. (2012). Decolonizing methodologies: Research and indigenous peoples (2nd ed.). Zed Books Ltd. ↵
- PAR-L. (2010). Introduction to feminist research . [Webpage]. https://www2.unb.ca/parl/research.htm#:~:text=Methodologically%2C%20feminist%20research%20differs%20from,standpoints%20and%20experiences%20of%20women . ↵
- Mafile'o, T. (2004). Exploring Tongan Social Work: Fekau'aki (Connecting) and Fakatokilalo (Humility). Qualitative Social Work, 3 (3), 239-257. ↵
- Duke Mod U Social Science Research Institute. (2016, November 11). How to know you are coding correct: Qualitative research methods. [Video]. YouTube. https://www.youtube.com/watch?v=iL7Ww5kpnIM&feature=youtu.be ↵
- Wolf, H. R. (2010). Growing up in New York City: A generational memoir (1941-1960). American Studies Journal, 54. http://www.asjournal.org/54-2010/growing-up-in-new-york-city/ ↵
- Clarke, V., Braun, V., & Hayfield, N. (2015). Thematic analysis. In J. A. Smith (ed.) Qualitative psychology: A practical guide to research methods , (3rd ed.). 222-248. ↵
- Vaismoradi, M., Turunen, H., & Bondas, T. (2013). Content analysis and thematic analysis: Implications for conducting a qualitative descriptive study. Nursing & Health Sciences, 15 (3), 398-405. ↵
- Hsieh, H. F., & Shannon, S. E. (2005). Three approaches to qualitative content analysis. Qualitative Health Research, 15 (9), 1277-1288. ↵
- Corbin, J., & Strauss, A. (2014). Basics of qualitative research: Techniques and procedures for developing grounded theory . Sage publications. ↵
- Charmaz, K. (2014). Constructing grounded theory . Sage Publications ↵
- Gallicano, T. (2013, July 22). An example of how to perform open coding, axial coding and selective coding. [Blog post]. https://prpost.wordpress.com/2013/07/22/an-example-of-how-to-perform-open-coding-axial-coding-and-selective-coding/ ↵
- Harrington, A. (2012). The fall of the schizophrenogenic mother. The Lancet, 379 (9823), 1292-1293. ↵
- Mitchell, F. M. (2018). “Water Is Life”: Using photovoice to document American Indian perspectives on water and health. S ocial Work Research, 42 (4), 277-289. ↵
The act of breaking piece of qualitative data apart during the analysis process to discern meaning and ultimately, the results of the study.
The act of putting the deconstructed qualitative back together during the analysis process in the search for meaning and ultimately the results of the study.
Member checking involves taking your results back to participants to see if we "got it right" in our analysis. While our findings bring together many different peoples' data into one set of findings, participants should still be able to recognize their input and feel like their ideas and experiences have been captured adequately.
Rigor is the process through which we demonstrate, to the best of our ability, that our research is empirically sound and reflects a scientific approach to knowledge building.
The idea that researchers are responsible for conducting research that is ethical, honest, and following accepted research practices.
The process of research is record and described in such a way that the steps the researcher took throughout the research process are clear.
A research journal that helps the researcher to reflect on and consider their thoughts and reactions to the research process and how it may be shaping the study
Memoing is the act of recording your thoughts, reactions, quandaries as you are reviewing the data you are gathering.
An audit trail is a system of documenting in qualitative research analysis that allows you to link your final results with your original raw data. Using an audit trail, an independent researcher should be able to start with your results and trace the research process backwards to the raw data. This helps to strengthen the trustworthiness of the research.
Research that portrays groups of people or communities as flawed, surrounded by problems, or incapable of producing change.
Research methodologies that center and affirm African cultures, knowledge, beliefs, and values.
Research methods that reclaim control over indigenous ways of knowing and being.
Research methods in this tradition seek to, "remove the power imbalance between research and subject; (are) politically motivated in that (they) seeks to change social inequality; and (they) begin with the standpoints and experiences of women". [1]
Research methods using this approach aim to question, challenge and/or reject knowledge that is commonly accepted and privileged in society and elevate and empower knowledge and perspectives that are often perceived as non-normative.
A research process where you create a plan, you gather your data, you analyze your data and each step is completed before you proceed to the next.
An iterative approach means that after planning and once we begin collecting data, we begin analyzing as data as it is coming in. This early analysis of our (incomplete) data, then impacts our planning, ongoing data gathering and future analysis as it progresses.
The point where gathering more data doesn't offer any new ideas or perspectives on the issue you are studying. Reaching saturation is an indication that we can stop qualitative data collection.
These are software tools that can aid qualitative researchers in managing, organizing and manipulating/analyzing their data.
A document that we use to keep track of and define the codes that we have identified (or are using) in our qualitative data analysis.
Part of the qualitative data analysis process where we begin to interpret and assign meaning to the data.
Thematic analysis is an approach to qualitative analysis, in which the researcher attempts to identify themes or patterns across their data to better understand the topic being studied.
An approach to data analysis in which we gather our data first and then generate a theory about its meaning through our analysis.
An approach to data analysis in which the researchers begins their analysis using a theory to see if their data fits within this theoretical framework (tests the theory).
Categories that we use that are determined ahead of time, based on existing literature/knowledge.
A data matrix is a tool used by researchers to track and organize data and findings during qualitative analysis.
A visual representation of how each individual category fits with the others when using thematic analysis to analyze your qualitative data.
An approach to data analysis that seeks to identify patterns, trends, or ideas across qualitative data through processes of coding and categorization.
entity that a researcher wants to say something about at the end of her study (individual, group, or organization)
A decision-rule provides information on how the researcher determines what code should be placed on an item, especially when codes may be similar in nature.
In qualitative data, coverage refers to the amount of data that can be categorized or sorted using the code structure that we are using (or have developed) in our study. With qualitative research, our aim is to have good coverage with our code structure.
A form of qualitative analysis that aims to develop a theory or understanding of how some event or series of events occurs by closely examining participant knowledge and experience of that event(s).
starts by reading existing theories, then testing hypotheses and revising or confirming the theory
a paradigm based on the idea that social context and interaction frame our realities
when a researcher starts with a set of observations and then moves from particular experiences to a more general set of propositions about those experiences
An initial phase of coding that involves reviewing the data to determine the preliminary ideas that seem important and potential labels that reflect their significance.
Axial coding is phase of qualitative analysis in which the research will revisit the open codes and identify connections between codes, thereby beginning to group codes that share a relationship.
Selective or theoretical coding is part of a qualitative analysis process that seeks to determine how important concepts and their relationships to each other come together, providing a theory that describes the focus of the study. It often results in an overarching or unifying idea tying these concepts together.
Constant comparison reflects the motion that takes place in some qualitative analysis approaches whereby the researcher moves back and forth between the data and the emerging categories and evolving understanding they have in their results. They are continually checking what they believed to be the results against the raw data they are working with.
Trustworthiness is a quality reflected by qualitative research that is conducted in a credible way; a way that should produce confidence in its findings.
claims about the world that appear scientific but are incompatible with the values and practices of science
Photovoice is a technique that merges pictures with narrative (word or voice data that helps that interpret the meaning or significance of the visual artifact. It is often used as a tool in CBPR.
Graduate research methods in social work Copyright © 2021 by Matthew DeCarlo, Cory Cummings, Kate Agnelli is licensed under a Creative Commons Attribution-NonCommercial-ShareAlike 4.0 International License , except where otherwise noted.
Share This Book
Official websites use .gov
A .gov website belongs to an official government organization in the United States.
Secure .gov websites use HTTPS
A lock ( ) or https:// means you've safely connected to the .gov website. Share sensitive information only on official, secure websites.

Collecting and Analyzing Qualitative Data
Brent Wolff, Frank Mahoney, Anna Leena Lohiniva, and Melissa Corkum
- Choosing When to Apply Qualitative Methods
- Commonly Used Qualitative Methods in Field Investigations
- Sampling and Recruitment for Qualitative Research
- Managing, Condensing, Displaying, and Interpreting Qualitative Data
- Coding and Analysis Requirements
Qualitative research methods are a key component of field epidemiologic investigations because they can provide insight into the perceptions, values, opinions, and community norms where investigations are being conducted ( 1,2 ). Open-ended inquiry methods, the mainstay of qualitative interview techniques, are essential in formative research for exploring contextual factors and rationales for risk behaviors that do not fit neatly into predefined categories. For example, during the 2014–2015 Ebola virus disease outbreaks in parts of West Africa, understanding the cultural implications of burial practices within different communities was crucial to designing and monitoring interventions for safe burials ( Box 10.1 ). In program evaluations, qualitative methods can assist the investigator in diagnosing what went right or wrong as part of a process evaluation or in troubleshooting why a program might not be working as well as expected. When designing an intervention, qualitative methods can be useful in exploring dimensions of acceptability to increase the chances of intervention acceptance and success. When performed in conjunction with quantitative studies, qualitative methods can help the investigator confirm, challenge, or deepen the validity of conclusions than either component might have yielded alone ( 1,2 ).
Qualitative research was used extensively in response to the Ebola virus disease outbreaks in parts of West Africa to understand burial practices and to design culturally appropriate strategies to ensure safe burials. Qualitative studies were also used to monitor key aspects of the response.
In October 2014, Liberia experienced an abrupt and steady decrease in case counts and deaths in contrast with predicted disease models of an increased case count. At the time, communities were resistant to entering Ebola treatment centers, raising the possibility that patients were not being referred for care and communities might be conducting occult burials.
To assess what was happening at the community level, the Liberian Emergency Operations Center recruited epidemiologists from the US Department of Health and Human Services/Centers for Disease Control and Prevention and the African Union to investigate the problem.
Teams conducted in-depth interviews and focus group discussions with community leaders, local funeral directors, and coffin makers and learned that communities were not conducting occult burials and that the overall number of burials was less than what they had experienced in previous years. Other key findings included the willingness of funeral directors to cooperate with disease response efforts, the need for training of funeral home workers, and considerable community resistance to cremation practices. These findings prompted the Emergency Operations Center to open a burial ground for Ebola decedents, support enhanced testing of burials in the private sector, and train private-sector funeral workers regarding safe burial practices.
Source: Melissa Corkum, personal communication.
Similar to quantitative approaches, qualitative research seeks answers to specific questions by using rigorous approaches to collecting and compiling information and producing findings that can be applicable beyond the study population. The fundamental difference in approaches lies in how they translate real-life complexities of initial observations into units of analysis. Data collected in qualitative studies typically are in the form of text or visual images, which provide rich sources of insight but also tend to be bulky and time-consuming to code and analyze. Practically speaking, qualitative study designs tend to favor small, purposively selected samples ideal for case studies or in-depth analysis ( 1 ). The combination of purposive sampling and open-ended question formats deprive qualitative study designs of the power to quantify and generalize conclusions, one of the key limitations of this approach.
Qualitative scientists might argue, however, that the generalizability and precision possible through probabilistic sampling and categorical outcomes are achieved at the cost of enhanced validity, nuance, and naturalism that less structured approaches offer ( 3 ). Open-ended techniques are particularly useful for understanding subjective meanings and motivations underlying behavior. They enable investigators to be equally adept at exploring factors observed and unobserved, intentions as well as actions, internal meanings as well as external consequences, options considered but not taken, and unmeasurable as well as measurable outcomes. These methods are important when the source of or solution to a public health problem is rooted in local perceptions rather than objectively measurable characteristics selected by outside observers ( 3 ). Ultimately, such approaches have the ability to go beyond quantifying questions of how much or how many to take on questions of how or why from the perspective and in the words of the study subjects themselves ( 1,2 ).
Another key advantage of qualitative methods for field investigations is their flexibility ( 4 ). Qualitative designs not only enable but also encourage flexibility in the content and flow of questions to challenge and probe for deeper meanings or follow new leads if they lead to deeper understanding of an issue (5). It is not uncommon for topic guides to be adjusted in the course of fieldwork to investigate emerging themes relevant to answering the original study question. As discussed herein, qualitative study designs allow flexibility in sample size to accommodate the need for more or fewer interviews among particular groups to determine the root cause of an issue (see the section on Sampling and Recruitment in Qualitative Research). In the context of field investigations, such methods can be extremely useful for investigating complex or fast-moving situations where the dimensions of analysis cannot be fully anticipated.
Ultimately, the decision whether to include qualitative research in a particular field investigation depends mainly on the nature of the research question itself. Certain types of research topics lend themselves more naturally to qualitative rather than other approaches ( Table 10.1 ). These include exploratory investigations when not enough is known about a problem to formulate a hypothesis or develop a fixed set of questions and answer codes. They include research questions where intentions matter as much as actions and “why?” or “why not?” questions matter as much as precise estimation of measured outcomes. Qualitative approaches also work well when contextual influences, subjective meanings, stigma, or strong social desirability biases lower faith in the validity of responses coming from a relatively impersonal survey questionnaire interview.
The availability of personnel with training and experience in qualitative interviewing or observation is critical for obtaining the best quality data but is not absolutely required for rapid assessment in field settings. Qualitative interviewing requires a broader set of skills than survey interviewing. It is not enough to follow a topic guide like a questionnaire, in order, from top to bottom. A qualitative interviewer must exercise judgment to decide when to probe and when to move on, when to encourage, challenge, or follow relevant leads even if they are not written in the topic guide. Ability to engage with informants, connect ideas during the interview, and think on one’s feet are common characteristics of good qualitative interviewers. By far the most important qualification in conducting qualitative fieldwork is a firm grasp of the research objectives; with this qualification, a member of the research team armed with curiosity and a topic guide can learn on the job with successful results.
| Exploratory research | The relevant questions or answer options are unknown in advance | In-depth case studies Situation analyses by viewing a problem from multiple perspectives Hypothesis generation |
| Understanding the role of context | Risk exposure or care-seeking behavior is embedded in particular social or physical environments | Key barriers or enablers to effective response Competing concerns that might interfere with each other Environmental behavioral interactions |
| Understanding the role of perceptions and subjective meaning | Different perception or meaning of the same observable facts influence risk exposure or behavioral response | Why or why not questions Understanding how persons make health decisions Exploring options considered but not taken |
| Understanding context and meaning of hidden, sensitive, or illegal behaviors | Legal barriers or social desirability biases prevent candid reporting by using conventional interviewing methods | Risky sexual or drug use behaviors Quality-of-care questions Questions that require a higher degree of trust between respondent and interviewer to obtain valid answers |
| Evaluating how interventions work in practice | Evaluating What went right or, more commonly, what went wrong with a public health response Process or outcome evaluations Who benefited in what way from what perceived change in practice | ‘How’ questions Why interventions fail Unintended consequences of programs Patient–provider interactions |
Semi-Structured Interviews
Semi-structured interviews can be conducted with single participants (in-depth or individual key informants) or with groups (focus group discussions [FGDs] or key informant groups). These interviews follow a suggested topic guide rather than a fixed questionnaire format. Topic guides typically consist of a limited number ( 10– 15 ) of broad, open-ended questions followed by bulleted points to facilitate optional probing. The conversational back-and-forth nature of a semi-structured format puts the researcher and researched (the interview participants) on more equal footing than allowed by more structured formats. Respondents, the term used in the case of quantitative questionnaire interviews, become informants in the case of individual semi-structured in-depth interviews (IDIs) or participants in the case of FGDs. Freedom to probe beyond initial responses enables interviewers to actively engage with the interviewee to seek clarity, openness, and depth by challenging informants to reach below layers of self-presentation and social desirability. In this respect, interviewing is sometimes compared with peeling an onion, with the first version of events accessible to the public, including survey interviewers, and deeper inner layers accessible to those who invest the time and effort to build rapport and gain trust. (The theory of the active interview suggests that all interviews involve staged social encounters where the interviewee is constantly assessing interviewer intentions and adjusting his or her responses accordingly [ 1 ]. Consequently good rapport is important for any type of interview. Survey formats give interviewers less freedom to divert from the preset script of questions and formal probes.)
Individual In-Depth Interviews and Key-Informant Interviews
The most common forms of individual semi-structured interviews are IDIs and key informant interviews (KIIs). IDIs are conducted among informants typically selected for first-hand experience (e.g., service users, participants, survivors) relevant to the research topic. These are typically conducted as one-on-one face-to-face interviews (two-on-one if translators are needed) to maximize rapport-building and confidentiality. KIIs are similar to IDIs but focus on individual persons with special knowledge or influence (e.g., community leaders or health authorities) that give them broader perspective or deeper insight into the topic area ( Box 10.2 ). Whereas IDIs tend to focus on personal experiences, context, meaning, and implications for informants, KIIs tend to steer away from personal questions in favor of expert insights or community perspectives. IDIs enable flexible sampling strategies and represent the interviewing reference standard for confidentiality, rapport, richness, and contextual detail. However, IDIs are time-and labor-intensive to collect and analyze. Because confidentiality is not a concern in KIIs, these interviews might be conducted as individual or group interviews, as required for the topic area.
Focus Group Discussions and Group Key Informant Interviews
FGDs are semi-structured group interviews in which six to eight participants, homogeneous with respect to a shared experience, behavior, or demographic characteristic, are guided through a topic guide by a trained moderator ( 6 ). (Advice on ideal group interview size varies. The principle is to convene a group large enough to foster an open, lively discussion of the topic, and small enough to ensure all participants stay fully engaged in the process.) Over the course of discussion, the moderator is expected to pose questions, foster group participation, and probe for clarity and depth. Long a staple of market research, focus groups have become a widely used social science technique with broad applications in public health, and they are especially popular as a rapid method for assessing community norms and shared perceptions.
Focus groups have certain useful advantages during field investigations. They are highly adaptable, inexpensive to arrange and conduct, and often enjoyable for participants. Group dynamics effectively tap into collective knowledge and experience to serve as a proxy informant for the community as a whole. They are also capable of recreating a microcosm of social norms where social, moral, and emotional dimensions of topics are allowed to emerge. Skilled moderators can also exploit the tendency of small groups to seek consensus to bring out disagreements that the participants will work to resolve in a way that can lead to deeper understanding. There are also limitations on focus group methods. Lack of confidentiality during group interviews means they should not be used to explore personal experiences of a sensitive nature on ethical grounds. Participants may take it on themselves to volunteer such information, but moderators are generally encouraged to steer the conversation back to general observations to avoid putting pressure on other participants to disclose in a similar way. Similarly, FGDs are subject by design to strong social desirability biases. Qualitative study designs using focus groups sometimes add individual interviews precisely to enable participants to describe personal experiences or personal views that would be difficult or inappropriate to share in a group setting. Focus groups run the risk of producing broad but shallow analyses of issues if groups reach comfortable but superficial consensus around complex topics. This weakness can be countered by training moderators to probe effectively and challenge any consensus that sounds too simplistic or contradictory with prior knowledge. However, FGDs are surprisingly robust against the influence of strongly opinionated participants, highly adaptable, and well suited to application in study designs where systematic comparisons across different groups are called for.
Like FGDs, group KIIs rely on positive chemistry and the stimulating effects of group discussion but aim to gather expert knowledge or oversight on a particular topic rather than lived experience of embedded social actors. Group KIIs have no minimum size requirements and can involve as few as two or three participants.
Egypt’s National Infection Prevention and Control (IPC) program undertook qualitative research to gain an understanding of the contextual behaviors and motivations of healthcare workers in complying with IPC guidelines. The study was undertaken to guide the development of effective behavior change interventions in healthcare settings to improve IPC compliance.
Key informant interviews and focus group discussions were conducted in two governorates among cleaning staff, nursing staff, and physicians in different types of healthcare facilities. The findings highlighted social and cultural barriers to IPC compliance, enabling the IPC program to design responses. For example,
- Informants expressed difficulty in complying with IPC measures that forced them to act outside their normal roles in an ingrained hospital culture. Response: Role models and champions were introduced to help catalyze change.
- Informants described fatalistic attitudes that undermined energy and interest in modifying behavior. Response: Accordingly, interventions affirming institutional commitment to change while challenging fatalistic assumptions were developed.
- Informants did not perceive IPC as effective. Response: Trainings were amended to include scientific evidence justifying IPC practices.
- Informants perceived hygiene as something they took pride in and were judged on. Response: Public recognition of optimal IPC practice was introduced to tap into positive social desirability and professional pride in maintaining hygiene in the work environment.
Qualitative research identified sources of resistance to quality clinical practice in Egypt’s healthcare settings and culturally appropriate responses to overcome that resistance.
____________________ Source: Anna Leena Lohiniva, personal communication.
Visualization Methods
Visualization methods have been developed as a way to enhance participation and empower interviewees relative to researchers during group data collection ( 7 ). Visualization methods involve asking participants to engage in collective problem- solving of challenges expressed through group production of maps, diagrams, or other images. For example, participants from the community might be asked to sketch a map of their community and to highlight features of relevance to the research topic (e.g., access to health facilities or sites of risk concentrations). Body diagramming is another visualization tool in which community members are asked to depict how and where a health threat affects the human body as a way of understanding folk conceptions of health, disease, treatment, and prevention. Ensuing debate and dialogue regarding construction of images can be recorded and analyzed in conjunction with the visual image itself. Visualization exercises were initially designed to accommodate groups the size of entire communities, but they can work equally well with smaller groups corresponding to the size of FGDs or group KIIs.
Selecting a Sample of Study Participants
Fundamental differences between qualitative and quantitative approaches to research emerge most clearly in the practice of sampling and recruitment of study participants. Qualitative samples are typically small and purposive. In-depth interview informants are usually selected on the basis of unique characteristics or personal experiences that make them exemplary for the study, if not typical in other respects. Key informants are selected for their unique knowledge or influence in the study domain. Focus group mobilization often seeks participants who are typical with respect to others in the community having similar exposure or shared characteristics. Often, however, participants in qualitative studies are selected because they are exceptional rather than simply representative. Their value lies not in their generalizability but in their ability to generate insight into the key questions driving the study.
Determining Sample Size
Sample size determination for qualitative studies also follows a different logic than that used for probability sample surveys. For example, whereas some qualitative methods specify ideal ranges of participants that constitute a valid observation (e.g., focus groups), there are no rules on how many observations it takes to attain valid results. In theory, sample size in qualitative designs should be determined by the saturation principle , where interviews are conducted until additional interviews yield no additional insights into the topic of research ( 8 ). Practically speaking, designing a study with a range in number of interviews is advisable for providing a level of flexibility if additional interviews are needed to reach clear conclusions.
Recruiting Study Participants
Recruitment strategies for qualitative studies typically involve some degree of participant self-selection (e.g., advertising in public spaces for interested participants) and purposive selection (e.g., identification of key informants). Purposive selection in community settings often requires authorization from local authorities and assistance from local mobilizers before the informed consent process can begin. Clearly specifying eligibility criteria is crucial for minimizing the tendency of study mobilizers to apply their own filters regarding who reflects the community in the best light. In addition to formal eligibility criteria, character traits (e.g., articulate and interested in participating) and convenience (e.g., not too far away) are legitimate considerations for whom to include in the sample. Accommodations to personality and convenience help to ensure the small number of interviews in a typical qualitative design yields maximum value for minimum investment. This is one reason why random sampling of qualitative informants is not only unnecessary but also potentially counterproductive.
Analysis of qualitative data can be divided into four stages: data management, data condensation, data display, and drawing and verifying conclusions ( 9 ).
Managing Qualitative Data
From the outset, developing a clear organization system for qualitative data is important. Ideally, naming conventions for original data files and subsequent analysis should be recorded in a data dictionary file that includes dates, locations, defining individual or group characteristics, interviewer characteristics, and other defining features. Digital recordings of interviews or visualization products should be reviewed to ensure fidelity of analyzed data to original observations. If ethics agreements require that no names or identifying characteristics be recorded, all individual names must be removed from final transcriptions before analysis begins. If data are analyzed by using textual data analysis software, maintaining careful version control over the data files is crucial, especially when multiple coders are involved.
Condensing Qualitative Data
Condensing refers to the process of selecting, focusing, simplifying, and abstracting the data available at the time of the original observation, then transforming the condensed data into a data set that can be analyzed. In qualitative research, most of the time investment required to complete a study comes after the fieldwork is complete. A single hour of taped individual interview can take a full day to transcribe and additional time to translate if necessary. Group interviews can take even longer because of the difficulty of transcribing active group input. Each stage of data condensation involves multiple decisions that require clear rules and close supervision. A typical challenge is finding the right balance between fidelity to the rhythm and texture of original language and clarity of the translated version in the language of analysis. For example, discussions among groups with little or no education should not emerge after the transcription (and translation) process sounding like university graduates. Judgment must be exercised about which terms should be translated and which terms should be kept in vernacular because there is no appropriate term in English to capture the richness of its meaning.
Displaying Qualitative Data
After the initial condensation, qualitative analysis depends on how the data are displayed. Decisions regarding how data are summarized and laid out to facilitate comparison influence the depth and detail of the investigation’s conclusions. Displays might range from full verbatim transcripts of interviews to bulleted summaries or distilled summaries of interview notes. In a field setting, a useful and commonly used display format is an overview chart in which key themes or research questions are listed in rows in a word processer table or in a spreadsheet and individual informant or group entry characteristics are listed across columns. Overview charts are useful because they allow easy, systematic comparison of results.
Drawing and Verifying Conclusions
Analyzing qualitative data is an iterative and ideally interactive process that leads to rigorous and systematic interpretation of textual or visual data. At least four common steps are involved:
- Reading and rereading. The core of qualitative analysis is careful, systematic, and repeated reading of text to identify consistent themes and interconnections emerging from the data. The act of repeated reading inevitably yields new themes, connections, and deeper meanings from the first reading. Reading the full text of interviews multiple times before subdividing according to coded themes is key to appreciating the full context and flow of each interview before subdividing and extracting coded sections of text for separate analysis.
- Coding. A common technique in qualitative analysis involves developing codes for labeling sections of text for selective retrieval in later stages of analysis and verification. Different approaches can be used for textual coding. One approach, structural coding , follows the structure of the interview guide. Another approach, thematic coding , labels common themes that appear across interviews, whether by design of the topic guide or emerging themes assigned based on further analysis. To avoid the problem of shift and drift in codes across time or multiple coders, qualitative investigators should develop a standard codebook with written definitions and rules about when codes should start and stop. Coding is also an iterative process in which new codes that emerge from repeated reading are layered on top of existing codes. Development and refinement of the codebook is inseparably part of the analysis.
- Analyzing and writing memos. As codes are being developed and refined, answers to the original research question should begin to emerge. Coding can facilitate that process through selective text retrieval during which similarities within and between coding categories can be extracted and compared systematically. Because no p values can be derived in qualitative analyses to mark the transition from tentative to firm conclusions, standard practice is to write memos to record evolving insights and emerging patterns in the data and how they relate to the original research questions. Writing memos is intended to catalyze further thinking about the data, thus initiating new connections that can lead to further coding and deeper understanding.
- Verifying conclusions. Analysis rigor depends as much on the thoroughness of the cross-examination and attempt to find alternative conclusions as on the quality of original conclusions. Cross-examining conclusions can occur in different ways. One way is encouraging regular interaction between analysts to challenge conclusions and pose alternative explanations for the same data. Another way is quizzing the data (i.e., retrieving coded segments by using Boolean logic to systematically compare code contents where they overlap with other codes or informant characteristics). If alternative explanations for initial conclusions are more difficult to justify, confidence in those conclusions is strengthened.
Above all, qualitative data analysis requires sufficient time and immersion in the data. Computer textual software programs can facilitate selective text retrieval and quizzing the data, but discerning patterns and arriving at conclusions can be done only by the analysts. This requirement involves intensive reading and rereading, developing codebooks and coding, discussing and debating, revising codebooks, and recoding as needed until clear patterns emerge from the data. Although quality and depth of analysis is usually proportional to the time invested, a number of techniques, including some mentioned earlier, can be used to expedite analysis under field conditions.
- Detailed notes instead of full transcriptions. Assigning one or two note-takers to an interview can be considered where the time needed for full transcription and translation is not feasible. Even if plans are in place for full transcriptions after fieldwork, asking note-takers to submit organized summary notes is a useful technique for getting real-time feedback on interview content and making adjustments to topic guides or interviewer training as needed.
- Summary overview charts for thematic coding. (See discussion under “Displaying Data.”) If there is limited time for full transcription and/or systematic coding of text interviews using textual analysis software in the field, an overview chart is a useful technique for rapid manual coding.
- Thematic extract files. This is a slightly expanded version of manual thematic coding that is useful when full transcriptions of interviews are available. With use of a word processing program, files can be sectioned according to themes, or separate files can be created for each theme. Relevant extracts from transcripts or analyst notes can be copied and pasted into files or sections of files corresponding to each theme. This is particularly useful for storing appropriate quotes that can be used to illustrate thematic conclusions in final reports or manuscripts.
- Teamwork. Qualitative analysis can be performed by a single analyst, but it is usually beneficial to involve more than one. Qualitative conclusions involve subjective judgment calls. Having more than one coder or analyst working on a project enables more interactive discussion and debate before reaching consensus on conclusions.
- Systematic coding.
- Selective retrieval of coded segments.
- Verifying conclusions (“quizzing the data”).
- Working on larger data sets with multiple separate files.
- Working in teams with multiple coders to allow intercoder reliability to be measured and monitored.
The most widely used software packages (e.g., NVivo [QSR International Pty. Ltd., Melbourne, VIC, Australia] and ATLAS.ti [Scientific Software Development GmbH, Berlin, Germany]) evolved to include sophisticated analytic features covering a wide array of applications but are relatively expensive in terms of license cost and initial investment in time and training. A promising development is the advent of free or low-cost Web-based services (e.g., Dedoose [Sociocultural Research Consultants LLC, Manhattan Beach, CA]) that have many of the same analytic features on a more affordable subscription basis and that enable local research counterparts to remain engaged through the analysis phase (see Teamwork criteria). The start-up costs of computer-assisted analysis need to be weighed against their analytic benefits, which tend to decline with the volume and complexity of data to be analyzed. For rapid situational analyses or small scale qualitative studies (e.g. fewer than 30 observations as an informal rule of thumb), manual coding and analysis using word processing or spreadsheet programs is faster and sufficient to enable rigorous analysis and verification of conclusions.
Qualitative methods belong to a branch of social science inquiry that emphasizes the importance of context, subjective meanings, and motivations in understanding human behavior patterns. Qualitative approaches definitionally rely on open-ended, semistructured, non-numeric strategies for asking questions and recording responses. Conclusions are drawn from systematic visual or textual analysis involving repeated reading, coding, and organizing information into structured and emerging themes. Because textual analysis is relatively time-and skill-intensive, qualitative samples tend to be small and purposively selected to yield the maximum amount of information from the minimum amount of data collection. Although qualitative approaches cannot provide representative or generalizable findings in a statistical sense, they can offer an unparalleled level of detail, nuance, and naturalistic insight into the chosen subject of study. Qualitative methods enable investigators to “hear the voice” of the researched in a way that questionnaire methods, even with the occasional open-ended response option, cannot.
Whether or when to use qualitative methods in field epidemiology studies ultimately depends on the nature of the public health question to be answered. Qualitative approaches make sense when a study question about behavior patterns or program performance leads with why, why not , or how . Similarly, they are appropriate when the answer to the study question depends on understanding the problem from the perspective of social actors in real-life settings or when the object of study cannot be adequately captured, quantified, or categorized through a battery of closed-ended survey questions (e.g., stigma or the foundation of health beliefs). Another justification for qualitative methods occurs when the topic is especially sensitive or subject to strong social desirability biases that require developing trust with the informant and persistent probing to reach the truth. Finally, qualitative methods make sense when the study question is exploratory in nature, where this approach enables the investigator the freedom and flexibility to adjust topic guides and probe beyond the original topic guides.
Given that the conditions just described probably apply more often than not in everyday field epidemiology, it might be surprising that such approaches are not incorporated more routinely into standard epidemiologic training. Part of the answer might have to do with the subjective element in qualitative sampling and analysis that seems at odds with core scientific values of objectivity. Part of it might have to do with the skill requirements for good qualitative interviewing, which are generally more difficult to find than those required for routine survey interviewing.
For the field epidemiologist unfamiliar with qualitative study design, it is important to emphasize that obtaining important insights from applying basic approaches is possible, even without a seasoned team of qualitative researchers on hand to do the work. The flexibility of qualitative methods also tends to make them forgiving with practice and persistence. Beyond the required study approvals and ethical clearances, the basic essential requirements for collecting qualitative data in field settings start with an interviewer having a strong command of the research question, basic interactive and language skills, and a healthy sense of curiosity, armed with a simple open-ended topic guide and a tape recorder or note-taker to capture the key points of the discussion. Readily available manuals on qualitative study design, methods, and analysis can provide additional guidance to improve the quality of data collection and analysis.
- Patton MQ. Qualitative research and evaluation methods: integrating theory and practice . 4th ed. Thousand Oaks, CA: Sage; 2015.
- Hennink M, Hutter I, Bailey A. Qualitative research methods . Thousand Oaks, CA: Sage; 2010.
- Lincoln YS, Guba EG. The constructivist credo . Walnut Creek, CA: Left Coast Press; 2013.
- Mack N, Woodsong C, MacQueen KM, Guest G, Namey E. Qualitative research methods: a data collectors field guide. https://www.fhi360.org/sites/default/files/media/documents/Qualitative%20Research%20Methods%20-%20A%20Data%20Collector%27s%20Field%20Guide.pdf
- Kvale S, Brinkmann S. Interviews: learning the craft of qualitative research . Thousand Oaks, CA: Sage; 2009:230–43.
- Krueger RA, Casey MA. Focus groups: a practical guide for applied research . Thousand Oaks, CA: Sage; 2014.
- Margolis E, Pauwels L. The Sage handbook of visual research methods . Thousand Oaks, CA: Sage; 2011.
- Mason M. Sample size and saturation in PhD studies using qualitative interviews. Forum : Qualitative Social Research/Sozialforschung. 2010;11(3).
- Miles MB, Huberman AM, Saldana J. Qualitative data analysis: a methods sourcebook . 3rd ed. Thousand Oaks, CA: Sage; 2014.
- Silver C, Lewins A. Using software in qualitative research: a step-by-step guide . Thousand Oaks, CA; Sage: 2014.
< Previous Chapter 9: Optimizing Epidemiology– Laboratory Collaborations
Next Chapter 11: Developing Interventions >
The fellowship application period and host site application period are closed.
For questions about the EIS program, please contact us directly at [email protected] .
- Laboratory Leadership Service (LLS)
- Fellowships and Training Opportunities
- Division of Workforce Development
Extract insights from customer & stakeholder interviews. At Scale.
Interpretation of data in qualitative research.
Home » Interpretation of Data in Qualitative Research
Thematic Analysis serves as a cornerstone in interpreting qualitative research, revealing the underlying patterns within diverse data. This approach enables researchers to systematically identify, analyze, and present themes that emerge from qualitative datasets, transforming raw data into meaningful narratives. By dissecting the subtleties of participant responses, thematic analysis nurtures a deeper understanding of social phenomena, enriching the research experience.
Understanding how to effectively implement Thematic Analysis not only enhances data interpretation but also fosters an environment ripe for discovery. It empowers researchers to develop insights that are both relevant and actionable, illuminating topics that may not be immediately apparent. Through this process, researchers can ensure their findings are not just descriptive, but also contributory to the broader field of qualitative inquiry.
Thematic analysis serves as a foundational method for interpreting qualitative research data. This approach allows researchers to identify and analyze patterns within the data, making it easier to draw meaningful conclusions. By systematically working through the data, researchers can highlight significant themes that reflect participants' experiences and perspectives. It fosters a deeper understanding of complex issues by organizing thoughts into coherent categories.
Implementing this method involves several key steps. First, researchers familiarize themselves with the data, immersing themselves in the material to gain insight. Next, they generate initial codes, which represent the fundamental elements of the data. After that, themes are developed from the coded data, crafting a narrative that encapsulates the findings. Ultimately, the analysis concludes with a thorough review of the themes to ensure they accurately represent the data, paving the way for more informed decisions and strategies.
Importance of Thematic Analysis for Data Interpretation
Thematic analysis is essential for effective data interpretation in qualitative research. This analytical approach enables researchers to identify, analyze, and report patterns within their data. By focusing on themes, researchers can connect various pieces of information to uncover deeper meanings and insights. This method not only facilitates a comprehensive understanding of participants' experiences but also guides further investigation into emerging patterns.
Furthermore, the importance of thematic analysis lies in its flexibility and adaptability. It can be applied across diverse qualitative data sources, whether interviews, focus groups, or open-ended survey responses. This versatility enhances the richness of the analysis, allowing researchers to extract significant insights that inform their findings. Thus, mastering thematic analysis equips researchers with a powerful tool to interpret qualitative data effectively, leading to more nuanced and impactful conclusions.
Identifying Patterns and Themes
Identifying patterns and themes is a crucial step in qualitative research, as it allows researchers to decipher the underlying messages within the data. Thematic analysis serves as a method for categorizing qualitative information into distinct themes that emerge from participant responses. By carefully examining the collected data, researchers can uncover commonalities that reveal significant insights.
To effectively identify these patterns, researchers typically follow several key steps. First, familiarization with the data is essential, ensuring comprehensive understanding. Second, initial codes are generated through open coding, mapping out notable elements. Third, themes are developed by grouping similar codes, allowing for meaningful interpretations. Finally, the themes are reviewed and refined, solidifying the connections to the research questions. This systematic approach not only aids in clarity but elevates the overall quality of insights extracted from qualitative research, making the analysis both rigorous and insightful.
Ensuring Consistency and Credibility
In qualitative research, ensuring consistency and credibility is crucial for maintaining the integrity of findings. A key aspect of this process is Thematic Analysis, which helps in identifying patterns and themes within qualitative data. By rigorously applying Thematic Analysis, researchers can minimize biases and improve the reliability of their interpretations. Consistent methods enhance transparency and allow for replication, which is vital for building trust among stakeholders.
To further strengthen consistency and credibility, consider the following approaches:
Triangulation : Use multiple data sources or methods to cross-verify findings. This enhances the robustness of conclusions.
Member Checking : Involve participants in reviewing findings. This encourages accuracy in representing their perspectives.
Audit Trails : Maintain detailed records of the research process, allowing others to follow the path taken in deriving conclusions.
By implementing these strategies, researchers can foster an environment that prioritizes reliable insights and enhances the overall quality of qualitative research.
Steps in Thematic Analysis for Qualitative Data
Thematic analysis is a widely recognized approach in qualitative research, providing a systematic method for interpreting patterns within data. The initial step involves familiarizing oneself with the data by reading and re-reading the transcripts, notes, or recordings. This immersion allows researchers to understand the content deeply and identify potential themes. Following this, researchers begin generating initial codes, highlighting significant features across the data set that relate to the research questions and objectives.
Once coding is completed, the next phase involves sorting these codes into broader themes. At this stage, researchers evaluate which themes adequately capture the essence of the data while considering relationships and overlaps among them. Subsequent steps include reviewing and refining the identified themes to ensure they accurately represent the data and are distinct from one another. Ultimately, thematic analysis concludes with a detailed report that connects themes to the research questions, offering valuable insights that enhance the interpretation of qualitative data.
Familiarizing with the Data
Familiarizing with the data is a crucial step in the thematic analysis process. It involves immersing oneself in the collected qualitative data, whether it be interviews, focus groups, or textual materials. By reading and re-reading this data, researchers begin to identify patterns and themes that emerge organically. This deep engagement enables researchers to gain insights into participants' perspectives and experiences, laying the groundwork for meaningful interpretations.
To effectively familiarize oneself with the data, consider the following steps:
Initial Reading : Begin by conducting a thorough initial reading of the data. This overview helps in understanding the context and depth of responses.
Noting Initial Thoughts : As you read, jot down first impressions or notable elements that stand out. These reflections will be valuable in later stages of analysis.
Line-by-Line Coding : Break down the data into smaller segments and apply codes that capture essential ideas or themes. This technique fosters clearer categorization for thematic analysis.
Reviewing Codes : After coding, revisit the data to refine and consolidate your codes. This iterative process enhances accuracy and comprehension.
By following these steps, researchers cultivate familiarity with the data, paving the way for robust thematic analysis and richer insights in qualitative research.
Coding and Categorizing Information
Coding and categorizing information is fundamental in qualitative research, often guiding the analysis process. This step involves organizing data into meaningful categories, allowing researchers to identify patterns and themes. Thematic analysis plays a crucial role here, as it aids in discovering recurring topics within the data. By breaking down large amounts of information into manageable parts, researchers can extract insights that may go unnoticed otherwise.
To effectively code qualitative data, researchers should consider several key steps. First, familiarize yourself with the data; understanding its nuances is vital for accurate coding. Next, develop a coding scheme that reflects the themes within the data. It can be beneficial to revise this scheme iteratively, allowing for new insights to emerge as the analysis progresses. Finally, review the coded data to ensure that the resulting categories genuinely encapsulate the information, thus rendering the analysis both reliable and meaningful. This process ultimately enhances the depth of understanding and contributes to the overall quality of the research.
Conclusion: Mastering Thematic Analysis for Effective Interpretation
Mastering thematic analysis is crucial for interpreting qualitative research data effectively. This method allows researchers to identify recurrent themes within their data, which can reveal deeper insights into participants' experiences and perspectives. By rigorously analyzing those themes, researchers can draw connections that enrich their understanding of the context and significance behind the data collected.
In conclusion, embracing thematic analysis not only enhances data interpretation but also strengthens the overall research quality. This approach instills confidence in findings and ensures that the insights gained resonate with the target audience. As researchers refine their skills in thematic analysis, they pave the way for impactful conclusions that inform future studies and decisions.
Turn interviews into actionable insights
On this Page
How to Develop a Research Hypothesis Effectively
You may also like, top companies using ai in 2024.

AI Computer Program Solutions for Businesses
Top conversational artificial intelligence platforms.
Unlock Insights from Interviews 10x faster
- Request demo
- Get started for free
- Open access
- Published: 15 August 2024
Shared patient information and trust: a qualitative study of a national eHealth system
- Kristine Lundhaug 1 ,
- Arild Faxvaag 2 ,
- Randi Stokke 1 &
- Hege Kristin Andreassen 3 , 1
BMC Digital Health volume 2 , Article number: 57 ( 2024 ) Cite this article
90 Accesses
Metrics details
In Norway, as in other countries, national eHealth systems, such as the Summary Care Record (SCR), have been implemented to improve the collaboration around patients by sharing patient information between health professionals across healthcare institutions and administrative levels. Although widely implemented across the health and care services in Norway, evaluations of the SCR indicate less use than expected. There is a need for analysis that lays out the visions and expectations of the SCR and contrasts these with detailed observations of use in everyday health professional work. This study adds to the eHealth research field by exploring this reality.
This paper has a qualitative design with an ethnographic approach, including participant observation, qualitative interviews, and a document review. Qualitative individual interviews with 22 health professionals and six weeks of participant observation were conducted, and eight documents were reviewed. The field notes and the interview-transcriptions were analyzed following a stepwise-deductive induction analysis.
The document review identified the expectations and visions of the SCR, including an underlying assumption of trust in shared patient information. However, this assumption is implicit and not recognized as a crucial element for success in the documents. In our observation and interview data, we found that health professionals do not necessarily trust information in the SCR. In fact, several procedures and routines to assess the trustworthiness of SCR information were identified that complicate and disturb the expected use. In our analysis, two main themes characterize the health professionals' handling of the SCR: adapting to workflow and dealing with uncertainty .
Our study illustrates that unconditional trust in shared patient information is an implicit assumption in SCR policy documents, but in their everyday work health professionals do not necessarily unconditionally trust shared patient information. Rather, sharing patient information through technology, such as the SCR, requires of health professionals to critically assess the digital information. The information in the SCR, as all sources of information presented to health professionals, becomes an item for their constant trust-work. Our study is of value to policymakers, health information systems developers, and the field of practice both nationally and internationally.
Peer Review reports
In the early years of digital health information systems (HIS), each institution typically had its own system. This solved the problem of communication and information exchange within the institution but not the need to exchange information across institutional borders.
The clinical encounter between a patient and a health professional (HP) is the building block of everyday medicine. During the encounter, HPs must gather information about the patient's problem, assess information that has been made available, make and execute decisions, and finally document the decisions that were made and subsequently set them in motion. An increasing group of patients have needs that require a multidisciplinary approach at different levels and institutions in the health and care service. To make informed decisions, each HP will need information concerning the decisions made by other HPs. Currently, eHealth systems for information exchange and communication between hospitals, general practitioners (GP), and home care services are expanding worldwide [ 1 , 2 , 3 ].
Huge investments in eHealth systems suggest that big challenges in health and care services, such as the pressure and problems related to an aging population, long-term and complicated chronic diseases, and fragmented healthcare, can be met with technological improvements [ 2 ]. Previous studies have shown that sharing electronic documents is essential in coordinating health and care services across organizational boundaries [ 4 ]. A systematic review exploring factors influential to the implementation of eHealth has found that no single factor was identified as a key facilitator or barrier but that issues around implementation are multi-level and complex [ 4 ]. Other reviews have concluded that eHealth systems could improve access and exchange of information, improve the quality of care, and support policymaking, but underline that for these “benefits to actualize, it is critical to focus on their implementation, which requires attention to more than just the technology" ([ 5 ] p.2046). While trust is a much-researched topic in the health sciences [ 6 ], to our knowledge, research into HP trust in national eHealth systems is lacking.
This study was conducted in Norway. Currently, Norway has two national eHealth systems for sharing patient health information between and across the healthcare sector: "e-prescription" and "the summary care record" (SCR). This study focuses on the latter, SCR. The SCR is the first national digital solution for sharing patients' health information between professionals across different levels and institutions in health and care services in Norway. It is used both in the primary care sector and in hospitals. The SCR is integrated with electronic health records (EHR) and is an electronic service that contains essential health information such as critical information, a pharmaceutical summary, appointment history (hospitals), contact information to the next of kin, and the name and contact information of the GP.
White papers in Norway have for many years pointed out the need for better cooperation and information sharing across all levels of the health and care service, and in 2008, it was determined that a National SCR should be considered [ 7 ]. During 2013–2017, the SCR was implemented in all hospitals, emergency call centers, out-of-duty medical response offices, and 90% of the GP clinics [ 8 ]. The implementation of the SCR in nursing homes and home care services started in 2019, and a full national rollout of the SCR is expected within 2025 [ 9 , 10 ].
Scotland, England [ 3 ], Sweden [ 11 ], and Norway [ 12 ] are among the countries that have implemented nationwide EHRs. A study conducted in Norway shows that eHealth systems, such as the SCR, have been used considerably less than expected by the health authorities before the implementation [ 13 ]. Further, it has been highlighted that the perception of success could differ from those who implemented the technology to those who used it [ 13 ]. One of the arguments for establishing the SCR was to reduce medication errors; to obtain this effect, sharing information, such as the pharmaceutical summary in the SCR, is considered crucial [ 14 ]. However, the problem is complex since HPs perceive obtaining the medication list as fragmented, complex, risky, time-consuming, and causing uncertainty [ 15 ]. This is mainly related to the critical phase of a patient's transition between levels of care [ 15 ].
Even though the Norwegian SCR is intended to be used by nurses, medical doctors (MD), and other HPs, studies have focused on MDs use of the SCR [ 12 ]. Limited research has been done on everyday use of the SCR across professions and levels of care. Our ethnographical approach adds to an interdisciplinary research field on eHealth by including multiple professions: nurses, a physiotherapist, and MDs, and from both primary and specialist health care.
Numerous studies have explored patient trust in HPs, doctor-patient relations, or public trust in health information exchange. Studies on measuring trust in the health system are growing but focus mainly on the relationship among MDs, nurses, and patients and not on relations between humans and technology [ 6 ]. A previous study on the SCR found that trustworthiness in information being shared is an important aspect of MDs use and experience with the SCR [ 12 ]. The study also emphasized that what kind of data sources that is trusted or preferred "is a much-less-explored topic" (12, p. 8) when it comes to shared health information. A recent synthetic review over the last fifty years of trust research in health care emphasizes that "trust plays a critical role in facilitating health care delivery" (16, p. 126) and found that the literature on trust was mostly on patient trust in clinicians [ 16 ]. To our knowledge, there have been few studies on the trust assessment of information in HP workflow and trust assessment of national eHealth systems that share patient information.
Theoretical framework
This article presents an analysis of technology in practice in multidisciplinary and cross-institutional collaborations, anchored in core concepts from Science and Technology Studies (STS) that emphasize the interactions between social and technical elements.
STS is an interdisciplinary field exploring social construction and technology and their interaction. To explore the visions and expectations of a national eHealth system and be able to contrast these with observations of how the system is experienced and used in practice, we lean our analysis on the concepts of "scenario" [ 17 ] and "script" [ 18 ]. These analytical entrances help us unpack the sociotechnical practices and visions embedded in the SCR and thus pave the way for an in-depth understanding of a practice that otherwise might be fleeting and difficult to grasp.
Scenario and script
New technologies are never produced or introduced in a neutral way. Rather, they come with scenarios for the universe the technology is entering. Callon [ 17 ] has illustrated the notion of scenario in his study of the development of an electric car in the early 1970s. In the development of the electric car, the developers and designers have constructed scenarios to shape and imagine the future in which the car would exist. Outlining these scenarios can show how social, economic, and political considerations are built into technology [ 17 ]. This is how we used the notion of scenario to analyze the goals, values, interests, and possibilities that were written, implicit or explicit, in documents about the SCR.
Akrich [ 18 ] has developed the notion of script as a tool to conceptualize how technology designers can inscribe values into technology. The analogy of a film script makes us aware of how there exist defined expectations towards who the actors should be, these actors’ roles and responsibilities, the distribution of tasks between them, and the different actors' needs and interests. The presumptions in a script are not only about the individual character of the various actors, but also about the environment in which the technology will be used and their visions about the world. The analogy to the film metaphor is useful, Akrich [ 18 ] argues, because it shows that technological scripts, like film scripts, are not static but leave a margin of freedom to the actor. To use the film metaphor on our study, we interpret the human actors to be the HPs, and the non-human actor is the SCR that comes with a technological script, inscribed by human actors like developers, programmers and vendors, but played out on scenes where these human actors are not present. There are numerous negotiations and renegotiations between the HPs and the SCR. The HPs use the freedom to interpret, negotiate and renegotiate the script and their roles in it, as well as the roles of the SCR itself. Along with the notion of the script, Akrich and Latour [ 19 ] have developed an extended vocabulary, which can be useful to describe the negotiation and renegotiation between actors. The script is dynamic and can adjust and change; it rescripts. Technology can have a strong or weak script, which refers to the flexibility in the use of the technology. "A strong script suggests a certain kind of use, while a weaker script suggests a larger degree of flexibility" ([ 20 ] p.390). As an analytical tool, script sensitized us to how human actors (HPs) negotiate and adapt the technology (SCR) to their work and how everyday practice adjusts in meeting the technology (SCR).
Hence, this study aims to use a combination of the concepts scenario and script as a lens to review documents on national eHealth systems, and contrast these to our data on how HPs use and experience a national eHealth system in their work. More specifically, we ask the following research questions: What visions and expectations are written into the Norwegian SCR script? How do HPs use and experience the SCR in everyday work?
This study has a qualitative design with an ethnographic approach, including participant observation, qualitative interviews, and a document review. Drawing on Charmaz [ 21 ], the definition of ethnography was "stretched" to involve supplementary data such as documents and interviews and not only participant observations.
Study context and data collection
This study was conducted at a hospital, a home care service, an intermediate unit, and a service allocation unit. They were all located in the same municipality in Norway. The municipality is characterized as a large municipality with more than 20,000 residents [ 22 ]. A purposeful sampling approach was used to recruit the hospital, municipality, units, and participants for this study. In this context, purposeful sampling strategically selects information-rich participants and cases relevant to the research questions [ 23 ]. The municipality was strategically chosen because it had implemented the SCR.
The field work in the intermediate unit lasted for two weeks, in February–March 2021. During that time, individual interviews with five nurses and four MDs from this unit were conducted, in addition to daily observations. Three-week participant observations were conducted in the emergency unit in August–September 2021. During that time, five individual interviews with MDs and two individual interviews with nurses were conducted. The emergency unit at the hospital was strategically selected since the SCR was described as an important tool in an emergency setting [ 24 ]. In the home care service, one-week of participant observation and four individual interviews with nurses were conducted in September 2021. Two individual interviews with HPs in the service allocation unit were conducted over the telephone in December 2021. To summarize, the data collection consists of six weeks of participant observation and 22 individual interviews, as illustrated in Table 1 . The duration of the interviews ranged from 17 to 80 min, with most interviews having a duration of 30 min. The reason for this variation in length is related to the workflow of the interviewees, as they were interviewed during workhours it varied how unpredictable and busy their schedule was and how much time they could set aside for an interview.
Content of observational studies and individual interviews
Observation is a method that "focuses on what people do, while interviews focus on what they say (they do)" (25, p.56). Observation studies can be suitable for exploring and getting insights into interaction and different aspects of a workplace by observing the setting, activities, and actors in their practices [ 25 ] and can better the understanding of the context of the study [ 23 ]. This study used participant observation to gain a deeper understanding of sharing patient information between and across primary and specialist health and care services and how a national eHealth system was used. During the participant observation, the first author followed the HPs around the units. This includes participating in daily and weekly meetings. Most of the participant observation was conducted in the HPs workspaces, which consisted of a desk with a computer, to get an insight into how and when the HPs gathered information about the patients. The first author took field notes during the participant observations to help recall the events in different situations.
Individual interviews were conducted as focused interviews. Focused interviews can be suitable for work-related studies when the interviews occur during work hours, and "the researcher can't expect to have in-depth interviews that last for an hour or longer un-disturbed" (25, p.102). Tjora [ 25 ] argues that focused interviews can be useful when the topic is limited; trust can be gained early in the interview and when the topics to be discussed are not very sensitive or difficult. The focused interviews took place during the participant observations in the different units. Therefore, the interview was conducted at the participants' workplace during work hours, and the location was either a meeting room or an office. The interview guide started with warm-up questions, such as "how long have you worked as a HP?", "what is your position here?" Next, questions such as "how familiar are you with the SCR?" were posed, followed by questions concerning HPs’ experiences with the SCR. The interview guide was developed for this study, which was part of a PhD project in health sciences. The English version of the interview guide is saved as Supplementary file 1.
Data analysis of individual interviews and participant observation
The field notes and the transcription was analyzed by a stepwise-deductive induction analysis (SDI) [ 25 ]. The analysis begins inductively and subsequently draws on existing theory through the analytical phase. The first step of the analysis was inductive empirical close coding, which is inspired by grounded theory [ 21 ]. The coding was grounded in the empirical data and corresponded closely to the detailed description of concrete situations (field notes) or close to the participants' statements (individual interviews). This process prevents the codes from being drawn from theories or research questions and ensures that the codes are grounded in empirical data [ 25 ]. The first author transcribed all the interviews verbatim and performed the empirical inductive coding in the NVivo software, which resulted in approximately 700 empirical-based codes. Some of the field notes were not coded but provided contextual understanding for the authors. The next step was grouping the codes with internal thematic connections relevant to the research questions into code groups, resulting in nine code groups. Two of the code groups were relevant for this article: seeking and sharing information through the SCR and the non-users of the SCR. These code groups were merged and were labeled HPs use and non-use of the SCR. The code groups were further explored, and theory was applied to support the analysis for understanding the empirical material. This was an ongoing back and forth process between the notion of script and the empirical data. The two themes identified through the analysis are adapting to workflow and dealing with uncertainty , as illustrated in Table 2 . During the analysis, uncertainty emerged as a theme. We then further explored uncertainty and found that HPs dealt with uncertainty by doing trust-work.
Document review
The necessity of conducting a document review arose during the analysis of the individual interviews and participant observations. To search for future scenarios and the explicit and implicit visions about the SCR, we conducted a document review. The document review was inspired by a “following the document-issue” approach [ 26 ], the “document-issue” in our case being mentioning’s of the SCR. Following the document-issue means “analysing where it [SCR] emerges in the first place and how it becomes an issue, including which kind of issue" (26, p. 115). The documents were selected based on this approach, which meant we started with the Norwegian "Coordination reform,” a white paper in which the SCR was first mentioned [ 7 ]. Then, we "followed the issue" by selecting white papers relevant to the SCR's development (see Table 1 ) to explore the future scenarios laid out for the SCR. We also included practical documents, such as the website "What is the Summary Care Record?" [ 8 ] and "Summary care record. User guide for best practice" [ 27 ] to explore how these script the SCR. The document review consisted of six policy and strategic documents and two practical documents (see Table 1 ). Our theoretical approach, STS, means that we interpret documents as a form of technology that is never completely neutral. "They come from somewhere and they are integral to the very issues and controversies that unfold in society" (26, p.3). Documents were imported into NVivo software, scrutinized, and coded through the theoretical lens of scenarios and script. The coding resulted in 49 codes focusing on the implicit or explicit visions of the SCR, and three themes were identified through the document review: solving the problem of coordination and information sharing , the red icon: a national alert system , and the idea of a seamless information system.
In this section, we present our main findings. First, we present the visions and expectations of the SCR identified in the document review. Next, we explain how these expectations are experienced and lived out among the HPs per the analysis of participant observations and individual interviews.
Findings from the document review
Three themes were identified through the documents review: solving the problem of coordination and information sharing , the red icon: a national alert system , and the idea of a seamless information system .
Solving the problem of coordination and information sharing
The policy documents describe the healthcare sector as fragmented and consisting of siloed systems with problems related to coordination, information sharing, and access to necessary information, such as medication lists and critical patient information, in emergencies [ 7 , 24 , 28 ]. The patient health information is stored in equally siloed systems, reflecting the healthcare sector institutions (GPs, the municipalities' health and care services, hospitals, and private specialists) who base their choice of EHR systems on their local needs [ 24 ]. This inhibits access and information gathering across health institutions in complex patient trajectories [ 24 ]. Lack of coordination and information sharing between health and care services is a risk to patient safety [ 7 , 24 , 28 ]. The need for better coordination and information sharing across all levels of the health and care service is presented in numerous white papers in Norway. Published in 2009, the white paper "The coordination reform" recognizes that coordination within the health and care services had been a problem for many years and that the health and care sector needed to develop better coordination; this is where the SCR (then called the national core journal) was mentioned for the first time in a white paper [ 7 ]. Published in 2012, the white paper "One citizen-one Journal" [ 24 ] emphasizes the need to modernize the ICT platform and work for a standard solution for the entire health and care sector; subsequently, the SCR was established. The first national eHealth strategy in Norway was published in 2017 [ 29 ]. The national eHealth strategy was established to create a common direction for digitalization nationally and to contribute to achieving political goals in the health and care sector. The national eHealth strategy builds on the white paper "One citizen-one Journal" [ 24 ]. The document review show that the political goal is to establish stronger national coordination of digitalization work in the health and care sector [ 30 , 31 ]. National eHealth solutions, including the SCR, are described as the "cornerstone of the digital interaction structure" and as essential for coherent health and care services [ 30 ]. The SCR is presented as an important part of the solution to fix the coordination problems described in the policy and strategic documents.
The red icon: a national alert system
Expectations of the SCR to function as a national alert system and potentially be lifesaving in emergencies, were described in the documents [ 8 ]. Furthermore, the documents indicate that the SCR will be an essential tool for HPs providing quick access to patients’ critical health information, regardless of where the patient is receiving treatment. According to the practical user guide [ 27 ], HPs are expected to click on a SCR icon in their local EHR system to access the patient's SCR. This is the case in all health and care services that have implemented the SCR, and the SCR icon is identical in all EHR systems. The icon appears in colors blue or red. The SCR icon color is a symbol for alerting HPs if the patient has any critical information stored just by looking at the color of the SCR icon, before opening the SCR. If the icon is red, this signal that MDs have registered critical information about the patient (severe allergies, implants, special disorders), while a blue icon signals that the patient does not have any critical information registered in the SCR. Only MDs are allowed to enter critical information [ 27 ]. Citizens can also register certain information themselves, such as primary contact information, information about being an organ donor, disease history, or special needs in connection with diminished sight, hearing, or the need for a translator [ 8 , 27 ].
The idea of a seamless information system
The document review revealed that the SCR's vision is that the HIS will compile current, trustworthy, essential information about patients available across institutional levels. The SCR was established to increase patient safety by giving HPs easy access to updated information such as medication lists, allergies, and other critical information [ 8 , 24 , 28 ]. The documents express an expectation that the SCR will increase patient safety, giving HPs updated information about the patient in acute situations. This includes the patient's medication list when the HPs lack up-to-date information about the patient in their local journal EHR systems [ 24 , 27 , 31 ]. The SCR is described as helping HPs gather information about the patient in one place, ensuring the HP does not waste time logging into different systems. Furthermore, the SCR is expected to prevent the patient from repeating their medical history each time they meet a new HP [ 24 ]. According to the documents, most of the information in the SCR will automatically be extracted from national registers. This includes the prescription intermediary; contact information to the patient’s next of kin (name, address, telephone numbers); the patient’s GP; and admission history to the specialist health service [ 8 ].
The documents describe a health and care service that needs a national eHealth system as a solution to problems with coordination and information sharing. There is an expectation that the SCR will function as an alert system in an emergency setting and act as a “seamless system” of information sharing across the health and care services. These expectations and visions constitute the scenario the SCR is entering.
Findings from the analysis of observation and interview data
In this section, we present our analysis of HPs’ negotiations and experiences in daily use of the SCR. Two main themes were developed through the analysis: adapting to workflow and dealing with uncertainty (see Table 2 ).
Adapting to workflow
In two of the sites where observations and interviews were conducted, the SCR was part of the MDs information-gathering routine when a new patient was admitted. MDs in the emergency unit checked the SCR on every patient and preferably before the medical examination of patients. MDs in the intermediate unit did not have the same routine or the need to check the SCR before examining every patient, as they often knew their patients from previous admissions.
When MDs gathered information about a patient, regardless of context, they often started in their local EHR system and read through the admission report. Then they checked the SCR by clicking on the icon of the SCR that is an integrated part of their local EHR. Typical information MDs gathered from the SCR included: critical information, whether the patient was married, had kids, the next of kin, the GP, age, and the pharmaceutical summary. We observed, and were told, that the MDs checked the SCR regardless of the SCR icon's color. As one MD in the intermediate unit said, "I would never trust that there wasn't any information there." If the MDs in the emergency unit did not have the chance to check the SCR before the patient's medical examination, they checked it as soon as possible. Their first priority was to check if the patient had any critical information, and the pharmaceutical summary was second. They often experienced that critical information was stored in their local EHR system and not in the SCR. Only a few MDs had ever registered critical information themselves in the patient's SCR. "I think doctors should register critical information more often, since I have experienced that the information has been useful," said one MD in the emergency unit. Some of the MDs reflected on the concept of “critical information” and how and by who such information should be registered.
The MDs in the emergency unit experienced that the SCR made a difference in emergencies by providing information about medical allergies and diagnoses of the patients. They also found it helpful when the patient was a tourist, since they had no previous information about the patient in their local EHR system. Through the SCR, the MDs could see where the patient has previously been admitted (hospitals), and they could contact that hospital. As one MD in the emergency unit said, " If a patient is unknown to us or unconscious, the SCR is the go-to."
For the nurses in the emergency unit, the SCR was not part of the information-gathering routine. The nurses occasionally used their local EHR, but they typically used the "folder," which was a physical paper folder containing the patient's ID band and ID tags, a paper manually filled out by nurses during the patient’s examination, and a medication sheet manually filled out by MDs. The nurses explained that if they saw that the icon was red, they did not check the SCR themselves, rather they made sure to let the MD know.
The nurses in the intermediate unit had experienced that when patients were admitted from the hospital there was often a note from the hospital saying: "check the SCR.” When the nurses checked, the SCR contained critical information about the patient. Hence, nurses at the intermediate unit found the information in the SCR valuable in emergencies. As a nurse expressed in an interview:
It was at night, and we received a patient from the emergency room. The patient did not have any papers from the emergency room. We had no information except the patient’s name and social security number. We then admitted the patient to our local EHR system and got access to SCR through that. We then saw the necessary medical information until the doctor came the next day. SCR was the only place we could look for information because the patient had nothing with him but himself. –Nurse (intermediate unit)
The SCR was part of the information-gathering routine for the MDs at the intermediate unit, but it had not become a routine for the nurses. The nurses in the intermediate unit felt that the hospital staff was unsure whether the intermediate unit had routines for checking the SCR as a part of their information-gathering routines, since the hospital staff often explicitly wrote "check the SCR" in their discharge summaries.
The pharmaceutical summary was the primary use of the SCR for the MDs, and it could be time-consuming to gather information for the medication list to a patient.
I mostly use it (SCR) to check medicines. Many of our patients are quite sick and have a lot of medication, and they often don't know what they're taking themselves. If you tell them, some patients know the medicine's name, but if not, it can be quite hopeless. In that way, the SCR is helpful, so I don't know how we would have worked without it. It would have been cumbersome. –MD (emergency unit)
Though MDs at the units involved in our study had adopted the SCR into their workflow, there were only a few nurses in the intermediate unit that used the SCR. The nurses and the physiotherapist in the service allocative unit, the home care service, and the emergency unit did not use the SCR. The reasons why these HPs did not use the SCR varied. Some did not know what the SCR was, and others did not know if they had access to it. Some had heard about SCR from their colleges. As a nurse in the intermediate unit said, "I have to admit, I don't really know what the SCR is." The HPs reflected on, both during the interviews and observations, the purpose of the SCR since they had already obtained the discharge report and medication list from elsewhere. These HPs had access to the SCR but described the SCR as a tool that the MDs used, and they did not find a reason why they had to use it as well. The HPs emphasized that they get their information elsewhere, like their local EHR system, and did not find the SCR as a useful source of information. "I've only looked at it, but I've had no need for it," said a physiotherapist in the service allocation unit.
During the observation study, a conversation about the SCR emerged, and some nurses started discussing the SCR. Primarily, the discussions centered on whether or not they had access. One of the nurses pointed out they had to have a chip in their id-card to put in the keyboard to access the SCR. During the conversation, several of the nurses expressed that they did not bother to go to the IT service, located in another building in the municipality, to get the chip in their id-card that was required before they could get access to the SCR.
Dealing with uncertainty
The time a HP spends on gathering information varies, and HP have several sources of information. Typical information sources include previously discharged reports, the SCR, their local EHR, the admission report, the patient itself, and next of kin. The high number of sources of information imply uncertainty could play out among HPs in cases where there is discrepancy between different sources.
There are so many places to gather information. There is double and triple and quadruple journaling. The medication list is enough to drive you crazy. There is one medication list written on paper in the hospital, one in the SCR, one in the general practitioner system, and one medication list in the system that the homecare nurses use. There can easily be five different places for a completely average old patient. When a patient goes back and forth from the hospital, there are often mistakes in the medication list. –MD (intermediate unit)
Some HPs felt like the SCR was just another place they had to check when gathering information about a patient. The uncertainty that the HPs experienced was embedded in the complex system of multiple sources of information that they had to navigate through.
The MDs in the emergency and intermediate unit emphasized that the complete medication history in the SCR made a difference in obtaining a comprehensive picture of their patient's medical history. However, the pharmaceutical summary in the SCR also brought up uncertainty. Medication management was a primary concern and there was frustration around the uncertainty in the multiple lists. The MDs were frustrated over how time-consuming it was to ensure the medication list was current and correct. During the observational study, some MDs mentioned that it felt like they were detectives trying to get the right puzzle pieces to solve the "case" of getting the medication list up-to-date. The MDs had to use at least two or three sources in the medication reconciliation. The information sources are the patient, the next of kin, the home care service, the medication list from the hospital, previous discharge reports, information in their local EHR system, and the pharmaceutical summary in the SCR.
The MDs spent a lot of time on medication reconciliation. The uncertainty in the medication list could last for days. One MD in the intermediate unit expressed, "It can take several days to be sure that what is written there is correct." The MDs emphasized that there are too many sources of information in medication reconciliation, and the uncertainty plays out when different sources give different information about the patient's medications. If a patient was admitted from the home care services or nursing home, it was "common knowledge" among the HPs at the hospital that the pharmaceutical summary in the SCR would be incorrect.
What the patient physically consumes of medication is only known by the home care service, or the patient itself, the SCR can come close, and sometimes it is entirely identical. Sometimes there can be a discrepancy there as well. The home care service writes in their local EHR systems and not in SCR. We've only got one more place in a way, but it's a slightly better place than many of the others. –MD (intermediate unit)
According to the MDs, the updated and correct medication list would not be found in the SCR when a patient was admitted from a nursing home or had home care services. In such cases, they depended on receiving the medication list or an admission report from the nursing home or home care service. They expressed that getting an overview of the patient's medication use was complex.
Though the information is automatically extracted from national registers, HPs don't necessarily trust the information relayed through the SCR. When a MD is new in the emergency unit, they offer a training course that includes using the SCR. During this training course, the MDs "were told that they can't trust the medication list in the SCR if the home care service controls the medications to the patients" said one MD at the emergency unit. In these cases, they were encouraged to contact the home care services by telephone.
The idea behind the SCR is that one gathers information from various health organizations and also towards general practitioners, home care services, and nursing homes is very good, but not optimal. There are several pitfalls, meaning you must take it with a pinch of salt. One cannot blindly trust the SCR. –MD (emergency unit)
The MDs had other sources of information they trusted more than the SCR, such as the information in their local EHR system, the admission report, previous discharge reports and spoken information from home care nurses.
To summarize our findings, the HPs experienced uncertainties and altered workflows in the wake of the implementation of the SCR. How HPs dealt with these challenges in their daily work, and these new ways of working have been interpreted as a kind of trust-work. Trust-work can be understood as a way of dealing with uncertainty, in line with other researchers who see trust in relation to uncertainty and risk [ 32 ].
The purpose of this study was to gain better understanding of the visions and expectations of the SCR and of how HPs descript and rescript the SCR in their daily professional life.
The policy and strategic documents show the visions and expectations of the scenario for the SCR, and the practical user guides gives us information on the designer's user manual: the script of the SCR. The political goal of the SCR is a solution to solve the problems of information sharing faced by the health and care service. In the daily workflows of Norwegian health care institutions, the SCR is considered just another tool for information gathering; however, it needs to be checked and validated by human actors, hence creating more work.
Considering our findings from the empirical study, we have observed an assumption that is only slightly mentioned: information sharing requires that HPs who use the information have a high degree of trust in the information being shared. In the consultation note establishing the national SCR [ 28 ], the focus is on the MDs lack of trust in the pharmaceutical summary [ 28 ]. The document Roadmap for development and implementation of national eHealth solutions [ 30 ] mentions that shared information must be up-to-date and complete as well as the possibilities for establishing a trust model for data and document sharing regarding access control to which HPs gets access to patient health information across different levels in the health and care service [ 30 ].
HPs are critically evaluating information and it is a core aspect of HPs practice. This aspect is not problematized through the documents, but we argue it is an underlying assumption. Trust in others to interpret the information gathered from technology is essential for high-quality care [ 33 ]. The vision of the SCRs script can only work if all users trust all the actors involved, both people and the technology. For the SCR to function as planned, HPs who enter information in the SCR must trust that those who retrieve the information understand and interpret the information correctly. In addition, HPs must also have confidence in the system that makes the information available to those who need it. The HPs who retrieve information must, in turn, have confidence that those who entered the information are competent and that the system can be trusted, continuously updated, and the information always available. This assumption of complete trust in other actors is not explicitly described in the SCR vision but lies as an unspoken premise. Our analysis shows that this becomes problematic when HPs rescript the SCR. HPs do not entirely trust shared information. On the contrary, HPs include critical assessment of information in all stages of their work. Previous studies on using eHealth system found that HPs have more trust in shared information if they receive information from colleagues they already know [ 34 ]. The information being shared in the SCR is not necessarily entered by colleagues that the HPs know.
Our findings showed that the SCR was scripted as an alert system for HPs by the SCR having a symbolic color system. However, the alert system had little to no function for the HPs. We found that HPs checked the SCR regardless of the symbolic color because they did not trust it. Our findings are consistent with other Norwegian studies, that MDs do not trust the coloring system of the SCR and that "a blue icon did not equal a lack of critical information" (12, p.8). Our findings indicate that MDs, in spite of frequent use, did not trust the pharmaceutical summary entirely. Rather, they experienced it could raise more questions than answers when the MDs were trying to update the medication list, and it led to additional work.
Though the SCR's vision and scripting express expectations that it should provide easy access to updated information gathered in one place, the HPs experiences were ambivalent. The SCR held a dual role for MDs, as it could ease the information gathering, but also complicate and introduce more uncertainties. This does not mean that the national eHealth system SCR does not have a function or is considered useless. The SCR contributes to getting patient information out of the siloed system, as intended. HPs find that the information in the SCR has made a difference.
The SCR has a strong script: the information is mainly automatically updated, and there is little room for free text. This gives HPs little room for flexibility in using the SCR. Our findings reveal challenging aspects of the vision of seamless shared information within the SCR. Based in our findings, we claim that a seamless information system [ 35 ] may be impossible to achieve due to HPs constant and ongoing trust-work in their everyday practice. In an already complex system of information, the SCR holds a dual role; it is a valuable source of information gathering but simultaneously an add-on; a new source of uncertainty. HPs must always filter and distil as much information as they can for every patient they meet. The ongoing trust-work includes constant critical assessment of any information they gather about a patient. This is a core aspect of a HPs work. In our study, the HPs were constantly checking the SCR, regardless of the symbolic color system, and integrating this checking in the totality of the information trust-work that they do every day. In their ongoing trust-work, HPs will relate to multiple other HPs and other sources of information. They will ask for confirmation and assess information all the time. Vos et al. [ 36 ] suggest that HPs must develop multifaceted trust for a more coordinated and collaborative use of the EHR system. To achieve multifaced trust, "health professionals need to be able to retrieve, understand and trust each other's information" (36, p.10). Trust involves assessing not only patient information but also the sender of the information and the SCR as a HIS. Trust in HISs, like trust in other humans and other written sources, will, and should, never be unconditional.
On the contrary, our health care system relies on HPs continuous critical assessment of information, the sources of information, and the systems containing the information. This trust-work will always be an integral part of any HPs workflow. Expectations of shared information systems to reduce the uncertainty HPs face when in front of a new patient must take this into consideration. Information trust-work is, and must be, at the core of HP performance. HIS can facilitate but never replace the critical assessment of information that all HPs need to perform when treating a patient. We argue that critical trust-work is an essential and integral part of all HP practice. Regardless of the quality, size, and design of HISs that share patient information, there might always be issues related to HPs ability to trust the information in the systems. Indeed, assessing and double-checking information is part of health professionalism. Hence, the expectations of the system to solve the problem of coordination and information sharing, to function as a perfect alarm system, and to work seamlessly might never be met. However, this does not mean that national eHealth systems cannot improve healthcare quality. They will, or are, to some extent, already good enough to be a viable part of the provision of healthcare service communication. Still, as our study highlights, future scenarios should include expectations of trust-work related to national HIS and not overlook this core aspect of high-quality professional healthcare.
Some limitations should be acknowledged in this study that could have affected the interpretation of the results. One researcher conducted all the individual interviews, participant observation, and the empirical inductive coding alone. A methodological strength could have been if a second researcher had done some of the data collection or coded the empirical data. However, the research team had regular meetings where the grouping of codes and the analysis were thoroughly discussed between the authors. The researcher producing the data was new to health care settings when entering the field, and this qualitative fieldwork can thus be described as a study in an unfamiliar culture; the internal terminology was hard to understand since the HPs used internal jargon and foreign words [ 25 ]. This can be seen as a limitation but also a strength since it allowed the researcher to ask open questions and maybe see situations differently than the HPs, as in our analysis where the HPs trust-work became important.
The data collection was conducted during COVID-19, which affected the participant observation since the researcher had to keep a two-meter distance from HPs. This affected where and how the participant observation could be carried out in the home care service, the intermediate unit, and the emergency unit. There was not always enough room for the researcher to observe; therefore, the researcher had to adjust where the observation could happen in the different units. Due the COVID-19, two individual interviews had to be conducted over the phone. Phone interviews have limitations since we could not see each other's facial expressions and body language.
The document review was a small part of the data collection compared to the participant observation and individual interviews. Other policy documents, Official Norwegian Reports, or other practical documents could have been included in the document review. Still, the selection of which documents were included was narrowed down due to limitations in the scope of the research project. A limitation of the document review was that it was carried out with the lens of searching for future scenarios and explicit and implicit visions about the SCR; this can be a limitation since the researchers searched explicitly through the lens and, therefore, lacked the overall nuanced perspective.
This study has explored the visions and expectations that constitute the scenario for the national eHealth system SCR through a document review and studied how HPs descript and rescript the SCR in their everyday work. While the visions and expectations of the national eHealth system SCR assume that HPs will unconditionally trust the system and the information shared, we found that this is not the case. Our study illuminate how the SCR script is de-scripted and re-scripted in ways that demand of human actors, HPs, to double check the trustworthiness of SCR information in various ways. Through the de-scripting and re-scripting of the SCR, HPs include new tasks of critical assessment of information from the SCR in all stages of their work. Sharing patient information through technology requires trust-work by the HPs, especially when the information is being shared with HPs outside the institutions from which the patient information originates. Our study thus implies that trust-work deserves more attention in the interdisciplinary field of eHealth, especially regarding technology that enables shared patient information.
Availability of data and materials
The datasets generated during and/or analysed during the current study are not publicly available due to ethical restrictions regarding data protection issues and the study-specific consent text and procedure, but anonymized data are available from the corresponding author upon reasonable request.
Abbreviations
Health information system
- Health professional
Summary Care Record
Electronic health record
Medical doctor
Science and technology studies
Stepwisedeductive induction analysis
General practitioner
Fragidis LL, Chatzoglou PD. Implementation of a nationwide electronic health record (EHR): The international experience in 13 countries. Int J Health Care Qual Assur. 2018;31(2):116–30. https://doi.org/10.1108/IJHCQA-09-2016-0136 .
Article PubMed Google Scholar
Garrety K, McLoughlin I, Dalley A, Wilson R, Yu P. National electronic health record systems as `wicked projects’: The Australian experience. Inform Polity: An Int J Govern Democracy Inform Age. 2016;21(4):367–81. https://doi.org/10.3233/IP-160389 .
Greenhalgh T, Morris L, Wyatt JC, Thomas G, Gunning K. Introducing a nationally shared electronic patient record: Case study comparison of Scotland, England, Wales and Northern Ireland. Int J Med Inform. 2013;82(5):e125–38. https://doi.org/10.1016/j.ijmedinf.2013.01.002 .
Ross J, Stevenson F, Lau R, Murray E. Factors that influence the implementation of e-health: a systematic review of systematic reviews (an update). Implement Sci. 2016;11(1):146.
Article PubMed PubMed Central Google Scholar
Scheibner J, Sleigh J, Ienca M, Vayena E. Benefits, challenges, and contributors to success for national eHealth systems implementation: a scoping review. J Am Med Inform Assoc. 2021;28(9):2039–49. https://doi.org/10.1093/jamia/ocab096 .
Ozawa S, Sripad P. How do you measure trust in the health system? A systematic review of the literature. Soc Sci Med. 2013;91:10–4.
St.Meld.nr.47 (2008–2009). Samhandlingsreformen. Rett behandling - på rett sted- til rett tid (The Coordination Reform. Proper Treatment-At the Right Place and Time) Oslo, Norway: Ministry of Health and Care Services 2009 [cited 2022 November 12]. Available from: https://www.regjeringen.no/no/dokumenter/stmeld-nr-47-2008-2009-/id567201/ .
Norsk Helsenett (Norwegian Health Network). Hva er kjernejournal (what is the SCR): Norsk Helsenett, ; 2022 [cited 2022 December 22]. Available from: https://www.nhn.no/tjenester/kjernejournal/hva-er-kjernejournal .
Direktoratet for e-helse (The Directorate of e-health). Kjernejournal til sykehjem og hjemmetjenester (Program pasientens legemiddelliste) (SCR to nursing home and home care services) 2020 [updated june 16 2020; cited 2022 December 27]. Available from: https://www.ehelse.no/prosjekt/kjernejournal-til-sykehjem-og-hjemmetjenester .
Direktoratet for e-helse (The Directorate of e-health). Plan for realisering av Nasjonal e-helsestrategi (Plan for realization of national e-health strategy);2023 [cited 2023 January 19]. Available from: https://www.ehelse.no/strategi/nasjonal-e-helsestrategi-for-helse-og-omsorgssektoren/_/attachment/inline/1305a1d3-23a5-45ce-9b06-39e770509597:52d85fffdbbd20633361e41d41bf23ba8f593fde/Plan%20for%20realisering%20av%20Nasjonal%20e-helsestrategi.pdf .
Sellberg N, Eltes J. The Swedish Patient Portal and Its Relation to the National Reference Architecture and the Overall eHealth Infrastructure. In: Aanestad M, Grisot M, Hanseth O, Vassilakopoulou P, editors. Information Infrastructures within European Health Care: Working with the Installed Base. Springer Copyright; 2017. p. 225–44. https://doi.org/10.1007/978-3-319-51020-0_14 .
Dyb K, Warth LL. The Norwegian National Summary Care Record: a qualitative analysis of doctors’ use of and trust in shared patient information. BMC Health Serv Res. 2018;18(1):252. https://doi.org/10.1186/s12913-018-3069-y .
Warth LL, Dyb K. eHealth initiatives; the relationship between project work and institutional practice. BMC Health Serv Res. 2019;19(1):520. https://doi.org/10.1186/s12913-019-4346-0 .
Dyb K, Warth LL. Implementing eHealth Technologies: The Need for Changed Work Practices to Reduce Medication Errors. Studies inHealth Technology Informatics. 2019;262:83–6. https://doi.org/10.3233/SHTI190022 .
Article Google Scholar
Manskow US, Kristiansen TT. Challenges Faced by Health Professionals in Obtaining Correct Medication Information in the Absence of a Shared Digital Medication List. Pharmacy. 2021;9(1):46. https://doi.org/10.3390/pharmacy9010046 .
Taylor LA, Nong P, Platt J. Fifty Years of Trust Research in Health Care: A Synthetic Review. Milbank Q. 2023;101(1):126–78. https://doi.org/10.1111/1468-0009.12598 .
Callon M. Society in the Making: The Study of Technology as a Tool for Sociological Analysis. In: Bijker WE, Hughes TP, Pinch TJ, editors. In The Social Construction of Technical Systems: New Directions in the Sociology and History of Technology. Cambridge, Mass. and London: MIT Press; 1987. p. 83–103.
Google Scholar
Akrich M. The De-Scription of technical objects. In: Bijker W, Law J, editors. Shaping Technology, Building Society: Studies on Sociotechnical Changes. Cambridge: MIT Press; 1992. p. 205–24.
Akrich M, Latour B. A summary of a Convenient Vocabulary for the Semiotics of Human and Nonhuman Assemblies. In: Bijker W, Law J, editors. Shaping Technology, Building Society: Studies of Sociotechnical Change. Cambridge, Massachusetts: MIT Press; 1992. p. 259–64.
Aune M. Users versus utilities: the domestication of an energy controlling technology. In: Jamison A, Rohracher H, editors. Technol Stud Sustain Dev. 2002(39).
Charmaz K. Constructing grounded theory. 2nd ed. London: Sage; 2014.
Kringlebotten M, Langørgen A. Gruppering av kommuner etter folkemengde og økonomiske rammebetingelser 2020/48. Statistisk sentralbyrå Statistics Norway; Descember 21 2022. Report No. 2020;2020:48.
Patton MQ. Qualitative Research & Evaluation Methods. 4th ed. United States of America: SAGE Publications, Inc.; 2015.
Meld.St.9 (2012–2013). Èn innbygger- èn journal (One citizent- one journal) Oslo, Norway; 2012 [cited 2022 November 04]. Available from: https://www.regjeringen.no/no/dokumenter/meld-st-9-20122013/id708609/?ch=1 .
Tjora AH. Qualitative research as stepwise-deductive induction. Abingdon, Oxon: Routledge; 2018.
Book Google Scholar
Asdal K, Reinertsen H. Doing document analysis. A Practice-oriented Method. United Kingdom: SAGE Publication Ltd; 2022.
Norsk helsenett. Kjernejournal. Veiledning i god prakis i bruk av kjernejournal. (Summary Care Record. Userguide of best practice; 2021. Available from: Veiledning i god praksis for bruk av kjernejournal.pdf. (nhn.no).
Helse- og omsorgsdepartementet. Høringsnotat. Etablering av nasjonal kjernejournal; 2011 [cited 2023 January 10]. Available from: https://www.regjeringen.no/no/dokumenter/etablering-av-nasjonal-kjernejournal/id651187/?expand=horingsnotater .
Direktoratet for e-helse (The Directorate of e-health). Nasjonal e-helsestrategi og mål 2017-2022 (national e-strategy and goal 2017-2022); 2017 [cited 2022 November 04.]. Available from: https://www.ehelse.no/publikasjoner/nasjonal-e-helsestrategi-og-mal-2017-2022 .
Direktoratet for e-helse (The Directorate of e-health). Veikart for utvikling og innføring av nasjonale e-helseløsninger 2021-2026 (Roadmap for developement and implementations of national eHealth solutions 2021-2026); 2022 [cited 2022 December 15]. Available from: https://www.ehelse.no/publikasjoner/veikart-for-utvikling-og-innforing-av-nasjonale-e-helselosninger-2021-2026-versjon-22.3 .
Direktoratet for e-helse (The Directorate of e-health). Plan for e-helse 2019-2022, Vedlegg til Nasjonal e-helsestrategi (2017-2022); 2019. [cited 2022 December 15]. Available from: https://www.ehelse.no/publikasjoner/plan-for-e-helse-2019-2022 .
Frederiksen M. Trust in the face of uncertainty: a qualitative study of intersubjective trust and risk. Int Rev Sociol. 2014;24(1):130–44. https://doi.org/10.1080/03906701.2014.894335 .
Raj M, Wilk AS, Platt JE. Dynamics of Physicians’ Trust in Fellow Health Care Providers and the Role of Health Information Technology. Med Care Res Rev. 2021;78(4):338–49. https://doi.org/10.1177/1077558719892349 .
Zwaanswijk M, Verheij RA, Wiesman FJ, Friele RD. Benefits and problems of electronic information exchange as perceived by health care professionals: an interview study. BMC Health Serv Res. 2011;11(1):256. https://doi.org/10.1186/1472-6963-11-256 .
Aanestad M, Olaussen I. IKT og samhandling i helsesektoren: digitale lappetepper eller sømløs integrasjon? Trondheim: Tapir akademisk forlag; 2010. ISBN: 978-82-519-2646-1.
Vos JFJ, Boonstra A, Kooistra A, Seelen M, van Offenbeek M. The influence of electronic health record use on collaboration among medical specialties. BMC Health Serv Res. 2020;20(1):676. https://doi.org/10.1186/s12913-020-05542-6 .
Download references
Acknowledgements
Thanks to all participants who willingly took part in the study.
Open access funding provided by Norwegian University of Science and Technology The first author is a doctoral candidate employed at NTNU Norwegian University of Science and Technology. No external funding was received for this study.
Author information
Authors and affiliations.
Department of Health Sciences in Gjøvik, Faculty of Medicine and Health Sciences,, NTNU, Centre for Care Research East, Norwegian University of Science and Technology (NTNU), Teknologiveien 22, Gjøvik, NO-2815, Norway
Kristine Lundhaug, Randi Stokke & Hege Kristin Andreassen
Department of Movement Science and Neuromedicine, Faculty of Medicine and Health Sciences, NTNU, Norwegian University of Science and Technology (NTNU), Faculty of Medicine and Health Sciences, Trondheim, N-7491, Norway
Arild Faxvaag
UiT The Arctic University of Norway (UiT), Faculty of Health Sciences, Institute of Health and Care Sciences, PO Box 6050 Langnes, Tromsø, N-9037, Norway
Hege Kristin Andreassen
You can also search for this author in PubMed Google Scholar
Contributions
KL: conceptualization, methodology, formal analysis, investigation, writing original draft preparations. AF: conceptualization, methodology, analysis, review, editing and supervision. RS: conceptualization, methodology, analysis, review, editing and supervision. HKA: conceptualization, methodology, analysis, review, editing and supervision. All authors have read and agreed to the published version of the manuscript.
Corresponding author
Correspondence to Kristine Lundhaug .
Ethics declarations
Ethics approval and consent to participate.
The Regional Committee for Medical and Health Research Ethics approved the exemption from the duty of confidentiality (Ref: 141144), and the Norwegian Center for Research Data (Ref: 919576) approved the study before the beginning of the data collection process. The health and welfare director in the municipality approved that the municipality could participate in the research project. After approval, they facilitated contact between the researcher and the different units. The units were contacted, informed about the study, and decided whether to participate. The hospital's head of emergency medical care was contacted and informed about the study and approved participation. The study is registered at the data protection supervisor at the hospital. All methods were carried out in accordance with relevant guidelines and the declaration of Helsinki. Written informed consent was obtained from all the participants. The participants were informed of their right to withdraw from the study without stating a reason. They were assured that confidentiality would be maintained concerning the transcribed data (anonymized systematically) and in any publications resulting from the study. All the participants were asked to participate and informed about the research project by the first author, and they all agreed to audio-record the individual interviews.
Consent for publication
Not applicable.
Competing interests
The authors declare no competing interests.
Additional information
Publisher’s note.
Springer Nature remains neutral with regard to jurisdictional claims in published maps and institutional affiliations.
Supplementary Information
Supplementary material 1., rights and permissions.
Open Access This article is licensed under a Creative Commons Attribution 4.0 International License, which permits use, sharing, adaptation, distribution and reproduction in any medium or format, as long as you give appropriate credit to the original author(s) and the source, provide a link to the Creative Commons licence, and indicate if changes were made. The images or other third party material in this article are included in the article's Creative Commons licence, unless indicated otherwise in a credit line to the material. If material is not included in the article's Creative Commons licence and your intended use is not permitted by statutory regulation or exceeds the permitted use, you will need to obtain permission directly from the copyright holder. To view a copy of this licence, visit http://creativecommons.org/licenses/by/4.0/ .
Reprints and permissions
About this article
Cite this article.
Lundhaug, K., Faxvaag, A., Stokke, R. et al. Shared patient information and trust: a qualitative study of a national eHealth system. BMC Digit Health 2 , 57 (2024). https://doi.org/10.1186/s44247-024-00108-6
Download citation
Received : 15 December 2023
Accepted : 05 June 2024
Published : 15 August 2024
DOI : https://doi.org/10.1186/s44247-024-00108-6
Share this article
Anyone you share the following link with will be able to read this content:
Sorry, a shareable link is not currently available for this article.
Provided by the Springer Nature SharedIt content-sharing initiative
- National eHealth system
- Summary care record
- Ethnographic approach
BMC Digital Health
ISSN: 2731-684X
- Submission enquiries: [email protected]
- General enquiries: [email protected]
IMAGES
COMMENTS
This question is particularly relevant to researchers new to the field and practice of qualitative research and instructors and mentors who regularly introduce students to qualitative research practices. In this article, we seek to offer what we view as a useful starting point for learning how to do qualitative analysis. We begin by discussing ...
Data analysis in qualitative research is an iterative and complex process. The focus of analysis is to bring out tacit meanings that people attach to their actions and responses related to a phenomenon. ... As already explained, the amount of data text or field notes from observations and other sources in qualitative research can become ...
Qualitative data analysis is a systematic process of examining non-numerical data to extract meaning, patterns, and insights. ... Observations and field notes are another useful sort of qualitative data. You can immerse yourself in the research environment through direct observation, carefully documenting behaviors, interactions, and contextual ...
Step 1: Gather your qualitative data and conduct research (Conduct qualitative research) The first step of qualitative research is to do data collection. Put simply, data collection is gathering all of your data for analysis. A common situation is when qualitative data is spread across various sources.
For data analysis, field-notes and audio-recordings are transcribed into protocols and transcripts, and coded using qualitative data management software. Criteria such as checklists, reflexivity, sampling strategies, piloting, co-coding, member-checking and stakeholder involvement can be used to enhance and assess the quality of the research ...
As faculty who regularly teach introductory qualitative research methods course, one of the most substantial hurdles we found is for the students to comprehend there are various approaches to qualitative research, and different sets of data collection and data analysis methods (Gonzalez & Forister, 2020).
QDA Method #1: Qualitative Content Analysis. Content analysis is possibly the most common and straightforward QDA method. At the simplest level, content analysis is used to evaluate patterns within a piece of content (for example, words, phrases or images) or across multiple pieces of content or sources of communication. For example, a collection of newspaper articles or political speeches.
The SAGE Handbook of. tive Data AnalysisUwe FlickMapping the FieldData analys. s is the central step in qualitative research. Whatever the data are, it is their analysis that, in a de. isive way, forms the outcomes of the research. Sometimes, data collection is limited to recording and docu-menting naturally occurring ph.
Qualitative data analysis is an important part of research and building greater understanding across fields for a number of reasons. First, cases for qualitative data analysis can be selected purposefully according to whether they typify certain characteristics or contextual locations. In other words, qualitative data permits deep immersion into a topic, phenomenon, or area of interest.
The wide range of approaches to data analysis in qualitative research can seem daunting even for experienced researchers. This handbook is the first to provide a state-of-the art overview of the whole field of QDA; from general analytic strategies used in qualitative research, to approaches specific to particular types of qualitative data, including talk, text, sounds, images and virtual data.
Some have depicted qualitative analysis as craftsmanship, others as an art, and still others as a process of detective work (Patton, 2002).In any case, the qualitative data analyst is constantly on the hunt for concepts and themes that, when taken together, will provide the best explanation of "what's going on" in an inquiry.
Doing qualitative research is not easy and may require a complete rethink of how research is conducted, particularly for researchers who are more familiar with quantitative approaches. There are many ways of conducting qualitative research, and this paper has covered some of the practical issues regarding data collection, analysis, and management.
Qualitative Data Analysis is a fundamental process in social and behavioral research, providing invaluable insights into the rich tapestry of human experiences. In this presentation, we delve into ...
This chapter provides an overview of selected qualitative data analysis strategies with a particular focus on codes and coding. Preparatory strategies for a qualitative research study and data management are first outlined. Six coding methods are then profiled using comparable interview data: process coding, in vivo coding, descriptive coding ...
One leader in the field of qualitative research in education, Sharan Merriam, notes that "there is almost no consistency across writers in how [the philosophical] ... The goal of qualitative data analysis is to uncover emerg - ing themes, patterns, concepts, insights, and understandings (Patton, 2002). Qualitative studies
Qualitative data analysis is. concerned with transforming raw data by searching, evaluating, recogni sing, cod ing, mapping, exploring and describing patterns, trends, themes an d categories in ...
Qualitative research methodology has been applied with increasing frequency in various fields, including in healthcare research, where quantitative research methodology has traditionally dominated, with an empirically driven approach involving statistical analysis. Drawing upon artifacts and verbal data collected from in-depth interviews or ...
These aren't mentioned to confuse or overwhelm you, but instead to suggest that qualitative research is a broad field with many options. ... Coding is a part of the qualitative data analysis process where we begin to interpret and assign meaning to the data. It represents one of the first steps as we begin to filter the data through our own ...
Qualitative research methods are a key component of field epidemiologic investigations because they can provide insight into the perceptions, values, opinions, and community norms where investigations are being conducted ().Open-ended inquiry methods, the mainstay of qualitative interview techniques, are essential in formative research for exploring contextual factors and rationales for risk ...
Data analysis is seen as an important and active process for identifying and assembling the content of academic works, core ideas, or connotationbased components. Perhaps the data analysis is the ...
Contents. Collecting Qualitative Data: A Field Manual for Applied Research provides a very practical, step-by-step guide to collecting and managing qualitative data. The data collection chapters focus on the three most often used forms of qualitative data collection: participant observation, in-depth interviews, and focus groups.
Event Analysis/Microanalysis: Frederick Erickson (1992). Ethnographic microanalysis of interaction. In M. LeCompte, et. al. (Eds), The handbook of qualitative research in education (chapter 5). San Diego: Academic Press. Analytic Induction: Jack Katz (1983). A theory of qualitative methodology. In R. M. Emerson (Ed.), Contemporary field research.
Field notes are widely recommended in qualitative research as a means of documenting needed contextual information. With growing use of data sharing, secondary analysis, and metasynthesis, field notes ensure rich context persists beyond the original research team.
After collecting the data, field research may require more work because researchers need to transcribe their interviews. This process is not necessary when analyzing ... (2009). Document analysis as a qualitative research method. Qualitative Research Journal, 9 (2), 27-40. Braun, V., & Clarke, V. (2006). Using thematic analysis in psychology ...
Steps in Thematic Analysis for Qualitative Data. Thematic analysis is a widely recognized approach in qualitative research, providing a systematic method for interpreting patterns within data. The initial step involves familiarizing oneself with the data by reading and re-reading the transcripts, notes, or recordings.
This tutorial is on using NVivo qualitative data analysis software to do team work / team coding in NVivo involving 2 or more people.It will cover various strategies for tracking team members' work in NVivo and comparing coding, including generating inter-rater reliability measures.
The researcher producing the data was new to health care settings when entering the field, and this qualitative fieldwork can thus be described as a study in an unfamiliar culture; the internal terminology was hard to understand since the HPs used internal jargon and foreign words . This can be seen as a limitation but also a strength since it ...
Qualitative analysis. Cleaned transcripts were analyzed using thematic analysis as described by Braun and Clarke (Braun & Clarke, Citation 2006). This involved the initial familiarization of the data, identifying initial codes followed by sorting codes into potential themes in consultation with the authors.
Patients often ask, "why me?" but questions arise regarding what this statement means, how, when and why patients ask, how they answer and why. Interviews were conducted as part of several qualitative research studies exploring how patients view and cope with various conditions, including HIV, cancer, Huntington's disease and infertility. A secondary qualitative analysis was performed ...
In the first of a series of "how-to" essays on conducting qualitative data analysis, Ron Chenail points out the challenges of determining units to analyze qualitatively when dealing with text.