- Utility Menu

User Research Center
User research analysis guide, by meg mcmahon.
Analyzing the notes from a user research study is an essential part of answering the research questions that prompted the study.
During the analysis, you or your team decide what insights are generated from the notes taken about the research studies. The insights should relate to the research questions posed at the beginning of the study or point to future research.
Before Analysis
Become familiar with the study.
Read over the research questions, script, background information on the project, and any notes moderators took during interviews.
Decide on analysis type
There are two types of analysis that the URC team uses frequently, an affinity diagramming session and thematic coding.
- Affinity diagramming: this is a process in which all of the notes are separated into individual sticky notes (virtual or physical) and grouped by question or participant at first. Then the analyzers take an even number of groups and sort them individually and then together to find themes. We at the URC use Miro or Dovetail to virtually facilitate this process.
- Thematic coding: this is a process where the notes or a transcript are marked up using codes. Codes are like tags or hashtags. They are bits of metadata that you use to describe other data. After the codes are created the analyzers go through and draw insights from the coded information. We at the URC use Dovetail for this type of analysis.
Decide on who should help with analysis
Often it is a good idea to include stakeholders, as well as yourself, in the analysis process for two primary reasons. One, the stakeholders are able to be a subject matter expert on the system, process, or workflow you are evaluating and two, by participating in the analysis process they are more likely to feel ownership over the final findings and recommendations.
Analysis Basics
Keep a scratch document.
While analyzing your data, it can be helpful to have a scratch document (a document separate from the main notes document) open to the side. You can use this scratch document to:
- Write down quotes from notes that are especially powerful or meaningful.
- Write down any initial insights you have. An insight informs the research questions or furthers your research goals in some way.
Give insights specific names
Insights are created from the themes or codes created during affinity diagramming or thematic coding. Look at the connections between themes or codes, what are larger insights you can draw from them?
Give each insight a name and be as specific as possible. Insights should help your stakeholders understand their research questions.
- DO: use a strong, clear insight: Participants collaboratively search with a collection specialist as a part of the search process. This was noted to build researchers' special collections research skills.
- DON’T: use a hard to understand, non-specific insight: collaborative search
Review the data with other analyzers
After reviewing the data on your own, discuss what you think of the first themes. Why are they important? What pattern do they surface? How do they relate to the research questions?
Back up insights with quotes
Quote or paraphrase ideas directly from the participants that relate to insights add more impact in the future report.
Look for research gaps
After having insights figured out the next step is to review the insights for any research gaps. Can you answer the research questions in your research plan? If not, what additional research is needed? Or are there other themes that don’t directly relate to the research questions which point to a future follow up study?
Prioritize insights most closely related to research questions
As a user researcher your job is to answer the research questions that started the study. If there is an insight that is only tangentially related to the research questions, it is okay to prioritize insights that are more directly related to the research questions when writing the report.
Affinity diagramming
Take the time to set up session.
Affinity diagramming takes time to set up, but it is important to have every note grouped either by participant or by question.
Create top level themes and sub themes
Start to sort the notes into themes. It is okay to create multiple levels of themes if the data lends itself to this kind of grouping. This is helpful for reports to group like insights together for readability.
Themes are not insights
Themes are not insights, they are building blocks for insights. When you are grouping themes it is okay to keep them more vague than you would an insight.
Collapse themes together if necessary
Often when affinity diagramming you may find similar themes within different questions. It is okay to collapse those themes together under a unifying heading. Themes (and insights) don’t need to be based on only a single question.
Avoid creating a "group" of unrelated notes
There are times in affinity diagramming where there are notes that don’t relate easily to any other notes for the study. It is okay to have orphan notes, notes that don’t relate to any theme. If the finding is important enough, it is okay for the orphan note to be its own theme.
Thematic coding
Codes (tags) are not insights.
Codes (tags) are not insights, they are building blocks for insights. When you are adding codes to the notes or transcripts it is okay to keep them more vague than you would an insight.
Use nested coding
When coding you may need to use nested codes. For example, say you’ve created a tag labeled “Coffee”. Now, if you are talking about how people like their coffee served you may make it a two word code/tag like “Coffee Served”.
If you want to specify that someone likes the coffee “black”, you can add a third word. However, considering “black” is a word that now describes “Coffee Served”, it would be best to create a nested tag which should look something like this: “Coffee Served: Black”.
This makes the tag structure easy to use again. For example, if you have to tag a comment later where someone mentions they like the coffee with cream and sugar, it’s easy to add that as “Coffee Served: Cream & Sugar”.
Repeat codes if necessary
Your codes should inform your research questions and you should repeat codes as necessary. If someone talks about the same thing at various times throughout the interview, code each of those instances with the same code.
Blog posts by month
- August 2024 (1)
- July 2024 (1)
- June 2024 (1)
- May 2024 (1)
- February 2024 (2)
Skip navigation
World Leaders in Research-Based User Experience
UX Research Cheat Sheet

February 12, 2017 2017-02-12
- Email article
- Share on LinkedIn
- Share on Twitter
User-experience research methods are great at producing data and insights, while ongoing activities help get the right things done. Alongside R&D, ongoing UX activities can make everyone’s efforts more effective and valuable. At every stage in the design process, different UX methods can keep product-development efforts on the right track, in agreement with true user needs and not imaginary ones.
In This Article:
When to conduct user research.
One of the questions we get the most is, “When should I do user research on my project?” There are three different answers:
- Do user research at whatever stage you’re in right now . The earlier the research, the more impact the findings will have on your product, and by definition, the earliest you can do something on your current project (absent a time machine) is today.
- Do user research at all the stages . As we show below, there’s something useful to learn in every single stage of any reasonable project plan, and each research step will increase the value of your product by more than the cost of the research.
- Do most user research early in the project (when it’ll have the most impact), but conserve some budget for a smaller amount of supplementary research later in the project. This advice applies in the common case that you can’t get budget for all the research steps that would be useful.
The chart below describes UX methods and activities available in various project stages.

Each project is different, so the stages are not always neatly compartmentalized. The end of one cycle is the beginning of the next.
The important thing is not to execute a giant list of activities in rigid order, but to start somewhere and learn more and more as you go along.
| • Field study • Diary study • User interview • Stakeholder interview • Requirements & constraints gathering | |
| • Competitive analysis • Design review • Persona building • Task analysis • Journey mapping • Prototype feedback & testing (clickable or paper prototypes) • Write user stories • Card sorting | |
| • Qualitative usability testing (in-person or remote) • Benchmark testing • Accessibility evaluation | |
| • Survey • Analytics review • Search-log analysis • Usability-bug review • Frequently-asked-questions (FAQ) review | |
When deciding where to start or what to focus on first, use some of these top UX methods. Some methods may be more appropriate than others, depending on time constraints, system maturity, type of product or service, and the current top concerns. It’s a good idea to use different or alternating methods each product cycle because they are aimed at different goals and types of insight. The chart below shows how often UX practitioners reported engaging in these methods in our survey on UX careers.

If you can do only one activity and aim to improve an existing system, do qualitative (think-aloud) usability testing , which is the most effective method to improve usability . If you are unable to test with users, analyze as much user data as you can. Data (obtained, for instance, from call logs, searches, or analytics) is not a great substitute for people, however, because data usually tells you what , but you often need to know why . So use the questions your data brings up to continue to push for usability testing.
The discovery stage is when you try to illuminate what you don’t know and better understand what people need. It’s especially important to do discovery activities before making a new product or feature, so you can find out whether it makes sense to do the project at all .
An important goal at this stage is to validate and discard assumptions, and then bring the data and insights to the team. Ideally this research should be done before effort is wasted on building the wrong things or on building things for the wrong people, but it can also be used to get back on track when you’re working with an existing product or service.
Good things to do during discovery:
- Conduct field studies and interview users : Go where the users are, watch, ask, and listen. Observe people in context interacting with the system or solving the problems you’re trying to provide solutions for.
- Run diary studies to understand your users’ information needs and behaviors.
- Interview stakeholders to gather and understand business requirements and constraints.
- Interview sales, support, and training staff. What are the most frequent problems and questions they hear from users? What are the worst problems people have? What makes people angry?
- Listen to sales and support calls. What do people ask about? What do they have problems understanding? How do the sales and support staff explain and help? What is the vocabulary mismatch between users and staff?
- Do competitive testing . Find the strengths and weaknesses in your competitors’ products. Discover what users like best.
Exploration methods are for understanding the problem space and design scope and addressing user needs appropriately.
- Compare features against competitors.
- Do design reviews.
- Use research to build user personas and write user stories.
- Analyze user tasks to find ways to save people time and effort.
- Show stakeholders the user journey and where the risky areas are for losing customers along the way. Decide together what an ideal user journey would look like.
- Explore design possibilities by imagining many different approaches, brainstorming, and testing the best ideas in order to identify best-of-breed design components to retain.
- Obtain feedback on early-stage task flows by walking through designs with stakeholders and subject-matter experts. Ask for written reactions and questions (silent brainstorming), to avoid groupthink and to enable people who might not speak up in a group to tell you what concerns them.
- Iterate designs by testing paper prototypes with target users, and then test interactive prototypes by watching people use them. Don’t gather opinions. Instead, note how well designs work to help people complete tasks and avoid errors. Let people show you where the problem areas are, then redesign and test again.
- Use card sorting to find out how people group your information, to help inform your navigation and information organization scheme.
Testing and validation methods are for checking designs during development and beyond, to make sure systems work well for the people who use them.
- Do qualitative usability testing . Test early and often with a diverse range of people, alone and in groups. Conduct an accessibility evaluation to ensure universal access.
- Ask people to self-report their interactions and any interesting incidents while using the system over time, for example with diary studies .
- Audit training classes and note the topics, questions people ask, and answers given. Test instructions and help systems.
- Talk with user groups.
- Staff social-media accounts and talk with users online. Monitor social media for kudos and complaints.
- Analyze user-forum posts. User forums are sources for important questions to address and answers that solve problems. Bring that learning back to the design and development team.
- Do benchmark testing: If you’re planning a major redesign or measuring improvement, test to determine time on task, task completion, and error rates of your current system, so you can gauge progress over time.
Listen throughout the research and design cycle to help understand existing problems and to look for new issues. Analyze gathered data and monitor incoming information for patterns and trends.
- Survey customers and prospective users.
- Monitor analytics and metrics to discover trends and anomalies and to gauge your progress.
- Analyze search queries: What do people look for and what do they call it? Search logs are often overlooked, but they contain important information.
- Make it easy to send in comments, bug reports, and questions. Analyze incoming feedback channels periodically for top usability issues and trouble areas. Look for clues about what people can’t find, their misunderstandings, and any unintended effects.
- Collect frequently asked questions and try to solve the problems they represent.
- Run booths at conferences that your customers and users attend so that they can volunteer information and talk with you directly.
- Give talks and demos: capture questions and concerns.
Ongoing and strategic activities can help you get ahead of problems and make systemic improvements.
- Find allies . It takes a coordinated effort to achieve design improvement. You’ll need collaborators and champions.
- Talk with experts . Learn from others’ successes and mistakes. Get advice from people with more experience.
- Follow ethical guidelines . The UXPA Code of Professional Conduct is a good starting point.
- Involve stakeholders . Don’t just ask for opinions; get people onboard and contributing, even in small ways. Share your findings, invite them to observe and take notes during research sessions.
- Hunt for data sources . Be a UX detective. Who has the information you need, and how can you gather it?
- Determine UX metrics. Find ways to measure how well the system is working for its users.
- Follow Tog's principles of interaction design .
- Use evidence-based design guidelines , especially when you can’t conduct your own research. Usability heuristics are high-level principles to follow.
- Design for universal access . Accessibility can’t be tacked onto the end or tested in during QA. Access is becoming a legal imperative, and expert help is available. Accessibility improvements make systems easier for everyone.
- Give users control . Provide the controls people need. Choice but not infinite choice.
- Prevent errors . Whenever an error occurs, consider how it might be eliminated through design change. What may appear to be user errors are often system-design faults. Prevent errors by understanding how they occur and design to lessen their impact.
- Improve error messages . For remaining errors, don’t just report system state. Say what happened from a user standpoint and explain what to do in terms that are easy for users to understand.
- Provide helpful defaults . Be prescriptive with the default settings, because many people expect you to make the hard choices for them. Allow users to change the ones they might need or want to change.
- Check for inconsistencies . Work-alike is important for learnability. People tend to interpret differences as meaningful, so make use of that in your design intentionally rather than introducing arbitrary differences. Adhere to the principle of least astonishment . Meet expectations instead.
- Map features to needs . User research can be tied to features to show where requirements come from. Such a mapping can help preserve design rationale for the next round or the next team.
- When designing software, ensure that installation and updating is easy . Make installation quick and unobtrusive. Allow people to control updating if they want to.
- When designing devices, plan for repair and recycling . Sustainability and reuse are more important than ever. Design for conservation.
- Avoid waste . Reduce and eliminate nonessential packaging and disposable parts. Avoid wasting people’s time, also. Streamline.
- Consider system usability in different cultural contexts . You are not your user. Plan how to ensure that your systems work for people in other countries . Translation is only part of the challenge.
- Look for perverse incentives . Perverse incentives lead to negative unintended consequences. How can people game the system or exploit it? How might you be able to address that? Consider how a malicious user might use the system in unintended ways or to harm others.
- Consider social implications . How will the system be used in groups of people, by groups of people, or against groups of people? Which problems could emerge from that group activity?
- Protect personal information . Personal information is like money. You can spend it unwisely only once. Many want to rob the bank. Plan how to keep personal information secure over time. Avoid collecting information that isn’t required, and destroy older data routinely.
- Keep data safe . Limit access to both research data and the data entrusted to the company by customers. Advocate for encryption of data at rest and secure transport. A data breach is a terrible user experience.
- Deliver both good and bad news . It’s human nature to be reluctant to tell people what they don’t want to hear, but it’s essential that UX raise the tough issues. The future of the product, or even the company, may depend on decisionmakers knowing what you know or suspect.
- Track usability over time . Use indicators such as number and types of support issues, error rates and task completion in usability testing, and customer satisfaction ratings, to show the effectiveness of design improvements.
- Include diverse users . People can be very different culturally and physically. They also have a range of abilities and language skills. Personas are not enough to prevent serious problems, so be sure your testing includes as wide a variety of people as you can.
- Track usability bugs . If usability bugs don’t have a place in the bug database, start your own database to track important issues.
- Pay attention to user sentiment . Social media is a great place for monitoring user problems, successes, frustrations, and word-of-mouth advertising. When competitors emerge, social media posts may be the first indication.
- Reduce the need for training . Training is often a workaround for difficult user interfaces, and it’s expensive. Use training and help topics to look for areas ripe for design changes.
- Communicate future directions . Customers and users depend on what they are able to do and what they know how to do with the products and services they use. Change can be good, even when disruptive, but surprise changes are often poorly received because they can break things that people are already doing. Whenever possible, ask, tell, test with, and listen to the customers and users you have. Consult with them rather than just announcing changes. Discuss major changes early, so what you hear can help you do a better job, and what they hear can help them prepare for the changes needed.
- Recruit people for future research and testing . Actively encourage people to join your pool of volunteer testers. Offer incentives for participation and make signing up easy to do via your website, your newsletter, and other points of contact.
Use this cheat-sheet to choose appropriate UX methods and activities for your projects and to get the most out of those efforts. It’s not necessary to do everything on every project, but it’s often helpful to use a mix of methods and tend to some ongoing needs during each iteration.
Free Downloads
Related courses, discovery: building the right thing.
Conduct successful discovery phases to ensure you build the best solution
User Research Methods: From Strategy to Requirements to Design
Pick the best UX research method for each stage in the design process
Personas: Turn User Data Into User-Centered Design
Create, maintain, and utilize personas throughout the UX design process
Related Topics
- Research Methods Research Methods
- Design Process
Learn More:
Please accept marketing cookies to view the embedded video. https://www.youtube.com/watch?v=7_sFVYfatXY

Competitive Reviews vs. Competitive Research
Therese Fessenden · 4 min

15 User Research Methods to Know Beyond Usability Testing
Samhita Tankala · 3 min

Always Pilot Test User Research Studies
Kim Salazar · 3 min
Related Articles:
Project Management for User Research: The Plan
Susan Farrell · 7 min
Open-Ended vs. Closed Questions in User Research
Maria Rosala · 5 min
Formative vs. Summative Evaluations
Alita Joyce · 5 min
UX Research Methods: Glossary
Raluca Budiu · 12 min
What a UX Career Looks Like Today
Rachel Krause and Maria Rosala · 5 min
Pilot Testing: Getting It Right (Before) the First Time
Amy Schade · 5 min
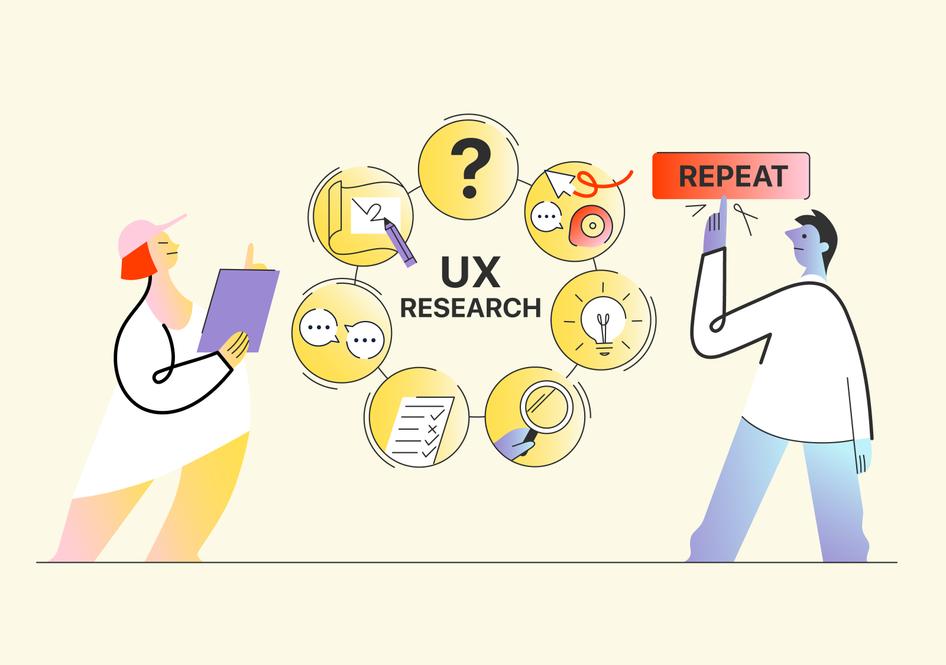
A Guide to User Research Analysis

When designers perform user interviews, field observations, or usability tests, they gather tons of notes and data to help inform design decisions and recommendations. But how do they make sense of so much qualitative data? Talking to customers is great, but most people walk away feeling overwhelmed by the sense of more information than they know what to do with. Learning how to properly analyze UX research helps turn raw data into insights and action.
What Is User Research Analysis?
User research analysis is a vital part of any research process because it is the very act of making sense of what was learned so that informed recommendations can be made on behalf of customers or users.
As researchers conduct analysis, they’re spending time categorizing, classifying, and organizing the data they’ve gathered to directly inform what they’ll share as outcomes of the research and the key findings.
Why Should Researchers Spend Time on Analysis?
Our natural instinct is to believe we can remember everything we heard or saw in an interview. But following impulsive decisions made from raw notes and data can be misleading and dangerous. Recommendations based on a single data point can lead a team down the path of solving the wrong problem.
Further, doing so is simply reacting to data, not making sense of it. This can cause companies to focus on incremental improvements only and miss important opportunities to serve customers in more meaningful, innovative ways.
A great example of this is when we see teams sharing research findings like, “6 out of 10 people had difficulty signing in to our application.” On the surface, a reasonable recommendation could be to redesign the sign-in form. However, proper research analysis and finding the meaning behind what that data represents is when the real magic happens. Perhaps the reason people had trouble signing in was due to forgotten passwords. In this case, redesigning the sign in form wouldn’t necessarily solve this problem.
Performing the necessary analysis of user research data is an act of asking “why” the “6 out of 10 people had difficulty signing into the application.” Analysis transforms the research from raw data into insights and meaning.
Consider what Slack did with their sign-in process. Slack allows a user to sign in by manually typing their password or having a “magic link” sent to their email which the person simply needs to click from their inbox. They get signed in to their Slack team and get started.

Slack offers a magic link instead of asking users to type their password.

Slack emails a magic link within seconds that saves the user typing their password.
This decision wasn’t an accident; it came from a deep understanding of a customer pain point. That deep understanding came from making sense of user research data and not simply jumping to a conclusion. Slack’s example demonstrates the power of spending time in analyzing user research data to go beyond reacting to a single observation and instead understanding why those observations occurred.
When to Do Research Analysis
Before the research begins.
Great analysis starts before research even begins. This happens by creating well-defined goals for the project, research, and product. Creating clear goals allows researchers to collect data in predefined themes to answer questions about how to meet those goals. This also allows them to create a set of tags (sometimes known as “codes”) to assign to notes and data as they conduct their research, speeding up analysis dramatically.
Before any research session begins, craft clear goals and questions that need to be answered by the research. Then brainstorm a list of tags or descriptors for each goal that will help identify notes and data that align to the goals of the research.
During the Research
Researchers often tag or code data they gather in real time. This can be done multiple ways using spreadsheets, document highlighting or even a specialized research tool like Aurelius.
When taking notes in a spreadsheet, tags can be added to individual notes in an adjacent column and later turned into a “ rainbow spreadsheet .”
For teams physically located in the same space, an affinity diagram with sticky notes on the wall works well. Here, each note can be added to an individual sticky note with top level tags or themes grouped physically together.

A student stands in front of an affinity exercise on a whiteboard. Photo via Wikimedia
There are also software tools like Aurelius that help researchers tag and organize notes as they’re taken which also makes for quick viewing and analysis of those tags later.

View of analyzing notes and tags in Aurelius.
It’s also useful for teams to have a short debrief after each research participant or session to discuss what they learned. This keeps knowledge fresh, allows the team members to summarize what they’ve learned up to that point, and often exposes new themes or tags to use in collecting data from the remaining research sessions.
When the Research Is Done
This is where most of the analysis happens. At this point researchers are reviewing all the notes they’ve taken to really figure out what patterns and insights exist. Most researchers will have a good idea of which tags, groups, and themes to focus on, especially if they’ve done a debrief after each session. It then becomes a matter of determining why those patterns and themes exist in order to create new knowledge and insight about their customers.
How to Analyze User Research
Tag notes and data as you collect it.
Tagging notes and data as they’re collected is a process of connecting those tags to research questions and the research questions back to the project or research goals. This way you can be confident in the tags and themes being created in real time. Here’s how to make the connection between tags, research questions and project goals.
Imagine the research goals for the project are:
- Increase the number of people signing up for our product free trial
- Increase the number of people going from free trial to a paid account
- Educate trial customers about the value of our product prior to signing up for a paid account
From there, research questions can be formed such as:
- “Does the website communicate the right message to share the value of a free trial?”
- “Is it easy for a new customer to sign up?”
- “Are new customers easily able to start a free trial and begin using the product?”
From those questions, we can extract topics and themes. Since we’re researching the free trial, sign up process and general usability of that process, they become clear choices for tags. Also, since the research is meant to answer a question about whether or not potential customers understand the value of our product and free trial, this too provides a clear topic and tag we can use. So, useful tags based on those questions would be:
- #free-trial
- #value-prop
- #signup-reason
- #signup-process
- #onboarding
As the team conducts the research, they can tag notes and observations according to those themes that align to the high level goals and questions for the project. All of this highly increases the ease and effectiveness of research analysis later.
Analysis After Each Session
A common user research practice is for the team to debrief after each interview, usability test, or field study to discuss what was learned or observed. Doing this while also reviewing the notes and observations helps researchers hear the same information from a new perspective.
Let’s imagine the team found the following patterns while conducting their research:
- Potential customers visited the product page, free trial sign-up page, and went back to the product page several times prior to starting a free trial.
- Some people had multiple browsers open with competitor sites pulled up while signing up for the free trial.
- Potential customers mentioned waiting for the “right time” to start their free trial on several occasions.
This may help the researchers create new tags (or codes) for remaining sessions, such as:
- #right-time
- #competitor-review
- #feature-comparison
Using these new tags adds another dimension to analysis and provides deeper meaning to patterns the team is finding. You can see how the combination of these tags and themes already begin to paint a picture of customer needs without any detailed notes!
Here are some good tips for knowing when to tag or code a note:
- It aligns directly to a project/research goal.
- The participant specifically said or implied that something is very important.
- Repetition – a thing is said or heard multiple times.
- Patterns – when certain observations are related or important to other tags and themes already established in the project goals or research.
Steps for Analyzing Research Once It’s Done
Once all the research is done, it’s time to dig in to find patterns and frequency across all the data gathered .
Step 1 – Review the notes, transcripts, and data for any relevant phrases, statements, and concepts that align to the research goals and questions.
Step 2 – Tag and code any remaining data that represents key activities, actions, concepts, statements, ideas and needs or desires from the customers who participated in the research.
Step 3 – Review those tags and codes to find relationships between them. A useful tip for this is to pay close attention to tags that have notes with multiple other tags. This often indicates a relationship between themes. Create new tags and groups where appropriate to review more specific subsets of the data. Continue this process until meaningful themes are exposed. Once that happens, ask questions like:
- Why do these patterns or themes exist?
- Why did participants say this so many times?
- Does the data help answer the research questions?
- Does the data inform ways to meet the research goals?
- Does one tag group or theme relate to another? How? Why?
Sharing Key Insights from User Research
A key insight should answer one or more of your research questions and directly inform how to meet one or more of the established business goals. When sharing key insights, be sure to make a clear connection between one of the business goals, research questions and why the key insight is relevant to both. The most effective way of turning research into action is by helping teams make a connection between key insights and business outcomes.
3 Parts to a Key Insight
There are three parts to creating a key insight from user research :
- Statement of what you learned
- Tags that describe the insight (often used from the analysis, but can also be new tags entirely)
- Supporting notes, data, and evidence that give further context to the key insight and support the statement of what was learned
A key insight from the example project might be:
“Prospective customers are worried they might not have enough time to review our product during the free trial.” #right-time #signup-process #free-trial
This represents the pattern observed of customers mentioning the “right time” to sign up for a free trial and comparing the product to competitors. It also goes beyond sharing the quantitative data that those things occurred and offers a qualitative explanation of why they happened. All of this leads to clearer recommendations and the ability for other teams to take action on the research findings.
Creating key insights from the research in this way allows for the most effective sharing and reuse later. By providing supporting notes to each insight, stakeholders and others consuming the research findings can learn more detail about each key insight if they so choose.
Next Steps for User Research Analysis
Conducting detailed analysis of user research data helps teams clearly share what was learned to provide more actionable recommendations in design and product development.
Here are some tips for making user research analysis faster and easier on upcoming projects:
- Begin the user research by creating well defined questions and goals.
- Create tags based on each goal.
- Tag research notes and data as it’s collected to speed up analysis later.
- Debrief after each research session.
- Review the data once research is finished to find patterns, frequency, and themes.
- Make statements about each pattern or theme that was uncovered, describing what it means and why it’s important (aka: create key insights).
- Share the key insights!
- An Analytics-First Approach to UX, Part 1
- Putting Big Data in Context
- 4 Quick Tips for Getting the Most out of Google Analytics
Analytics is more than just a numbers game. It's a way of tracking and analyzing user behavior over time. In this article, we explore this intersection of user experience and data, so that budding designers can add productive web analytics to their process.
UX Booth is trusted by over 100,000 user experience professionals. Start your subscription today for free.
UX Research Process: A Step-By-Step Framework
11 min read

What is the UX research process? Why is it important? What are its stages?
These are only some of the questions that the article tackles. It also outlines a 9-step guide on how to conduct UX research for product managers and UX designers.
Let’s dive in!
- The UX research process is a sequence of steps to collect and analyze data on user interactions with the product to better understand their needs and preferences .
- It’s essential to build user-friendly products that satisfy their needs and offer a positive customer experience . It also helps teams empathize with users and foster customer-centric organizational cultures.
- The UX research process consists of 4 main stages, Discovery , Exploring, Testing, and Listening, which follow the development process and during which it becomes increasingly more specific.
- Each UX research project should start with goal setting and formulating research questions. In other words, decide what problem you want to solve.
- Next, choose the research audience. That’s whose problems you want to solve,
- Based on goals and audience, select a range of research techniques, like surveys , interviews, or user behavior tracking .
- To recruit research participants, reach out to your existing users or tap into the pool of participants that your analytics tool may offer.
- Talking of tools … choosing the right ones for your project is the next step. You may need a solution to collect feedback, track product usage , and create wireframes and prototypes .
- The next step involves data analysis. This includes data from your analytics tools (e.g. trends or funnel analysis ), customer feedback, or session recordings.
- Having extracted insights from the data, share them with other teams and key stakeholders to sync your efforts and ensure alignment with business goals.
- Improving UX may require a major redesign . However, you can achieve a lot with onboarding UI patterns that guide users through the product and help them achieve their goals.
- After implementing changes, test their impact and iterate to further enhance the design.
- Want to see how Userpilot can help UX researchers? Book the demo!
What is the UX research process?
The UX research process is a methodical sequence of steps that helps product teams understand user needs , behaviors, and preferences .
UX research uses different research methods like user behavior analysis and feedback to validate ideas and solutions in real-life conditions.
Why is an effective user research process crucial?
An effective UX research process is essential for several reasons.
First, you can’t build a product that meets user expectations if you don’t understand their needs, behaviors, and motivations.
Second, UX research provides valuable insights that can guide product design, ensuring that the final product is user-friendly and intuitive to use. This often translates into higher user satisfaction and retention .
Moreover, user research can identify potential obstacles and pain points and enables the design team to address these issues proactively.
Finally, it teaches teams to look at the product design process through their eyes, and so it fosters a customer-centric design culture within the organization,
Overall, UX research is the foundation for designing and building a successful and competitive product in the market.
What are the 4 phases of the UX project process?
The 4 main stages of UX research are Discovery, Exploring, Testing, and Listening.
Let’s have a closer look at each of them and the user research methods that you can use for them.

Discovery phase
The aim of the discovery phase is to give you a general understanding of user needs and the context in which you’re building the product. It enables you to find out what you don’t know and provides a focus for the rest of the research process.
Common discovery techniques include:
- Field studies
- Diary studies
- User interviews
- Stakeholder interviews
- Requirements and constraints gathering
Exploring phase
In the exploring phase, you try to gain a better understanding of user problems and the scope of the design process. During this stage, teams brainstorm different design approaches and test early-stage ideas.
Techniques that can help you during the Exploring phase include:
- Competitive analysis
- Design review
- Persona building
- Task analysis
- Journey mapping
- Prototype feedback and testing (clickable or paper prototypes)
- User stories
- Card sorting
Testing phase
The testing phase involves more granular tests and experiments to ensure that the design in development is intuitive and easy to use for users with different needs and expectations.
What research methods can you use during this phase?
- Qualitative usability testing (in-person or remote)
- Benchmark testing
- Accessibility evaluation
Listening phase
The purpose of the listening phase is to collect insights on how well the product is satisfying existing user problems. It also enables teams to discover new opportunities to further enhance the product.
During listening, teams use a range of qualitative and quantitative methods, like:
- Product analytics reviews
- Search-log analysis
- Usability-bug reviews
- Frequently-asked-questions (FAQ) reviews
9 steps for conducting UX research to gain valuable insights
With the theory covered, let’s look at how to conduct user research, step-by-step.
1. Define the objectives for your research project
Start by setting the goals for the research project.
For example, your objective may be to find out why users drop off in the user journey and identify ways to retain them. Or you could look for improvements to the onboarding process to help users adopt the features that are relevant to their goals.
Having clear goals will give the project the necessary focus, help you align your team, choose the right research methods, allocate resources efficiently, and recruit the right users.
2. Identify the target audience to be researched
If you’re in SaaS, your user base is not likely to be homogenous. This means that not all of your users will necessarily face the same challenges or pain points. Consequently, they may not be able to provide the insights you’re after.
How do you choose the right target audience then?
Use your product analytics tools or customer feedback to identify the relevant segments or user cohorts.
For example, if you see users dropping off at a particular stage of the funnel , group them together and look for common characteristics. This could be users from a specific demographic group or with a particular job role. Zero in on those.
3. Select the right UX research methods
We have briefly touched on research methods earlier. Let’s have a closer look at a few common ones that you can use at multiple stages of the project.
User experience surveys
User surveys are one of the most popular research methods.
There are a few good reasons for that.
First, they’re easy to run at scale. You can easily trigger them inside the app or deliver them online to thousands of users at once.
Second, they allow you to collect both quantitative and qualitative data . It’s a common practice to start surveys with a closed-ended question and follow up with an open-ended one.
For example, you could start by asking users to rate how easy it is to perform a task or use a feature on a Likert scale, and then justify their response in the next one.
In this way, you’ll be able to gauge what user sentiment is and understand why they’re feeling like that.
Finally, you can target specific user segments with your surveys to ensure the validity of your research.

User interviews/focus groups
User interviews and focus groups are even more effective for collecting qualitative feedback from your users. That’s because you can follow up on user responses in real time and further explore the ideas that they bring up.
That’s if you have the right interviewing skills. Users are often unable to articulate their reasons clearly or simply don’t know why they act in a particular way.
For example, if you ask users what criteria contribute to a good user experience, they may not be able to say. However, if you ask them to tell you about the last time they had a great user experience and what made it stand out, you may get more actionable insights from them.
To reap the benefits that user interviews offer, prepare carefully, for example using a template like the one below. In this way, you will make sure you use the interview time well.

User behavior data
As all user interactions with SaaS products are digital, they’re easy to track.
You can collect data on literally every user click , tap, scroll, or hover. Apart from individual user actions, you can also bundle them up into custom events, and track them as one.
Such data is invaluable for UX researchers as it is objective and can help you identify patterns in user behavior that you may need to address.
For example, you can analyze feature usage data for particular user segments to identify the features that churned users don’t use. You can then drill down into their usage patterns to understand why they don’t use them.

Usability testing
The aim of usability tests is to determine how easy it is to use the product.
You can do this by giving users a task to complete and watching how they get on with it.
Let’s imagine you’re testing a new onboarding checklist.
You give it to users to complete and offer a reward for completing it as an incentive. Then you could record how they go about finishing the tasks and analyze it for insights.

Popular usability testing techniques are:
- Guerilla testing – you ‘ambush’ users in a public place, like a cafe, and ask them to experiment with the product
- Five-second test – you show the user a part of the product, like a feature, for 5 seconds and then interview them to see if they could understand the purpose of the feature, how they felt about its design or what was their general impression of the product or brand.
- First-click testing – a technique that evaluates how intuitive the product is: do they know where to click first when they need to complete a task?
- Eye tracking – by tracking the visual interactions with the page or product dashboard , you can test different layouts and designs for distractions that prevent users from finding the right features or UI elements.
4. Recruit participants for gathering research findings
If you’ve got an existing product, you can recruit testers from your user base.
Just target the specific user segment with a modal and invite them to take part in an experiment. You can also reach out to users who took part in your fake door tests and give them an opportunity to play around with the feature.
For brand-new products, you can recruit participants via tools like Hotjar. The application gives you access to a pool of 200k+ users from different backgrounds.

5. Choose a tool for conducting user research
Based on the research method you’ve chosen, pick the right tool for your study.
Here are a few options worth considering:
- Miro, Adobe XD, Webflow, and Figma for wireframing and prototyping
- Hotjar, and Userpilot for analytics
- Optimizely and Userpilot for experimentation
- Typeform, Userpilot, and SurveyMonkey for feedback collection
When choosing the tool, consider its own UX design and how easy it is to use. Also, pay attention to their integrations so that you can easily embed them in your workflow.
6. Analyze the research data to gather insights
How you analyze collected data during your research sessions depends on your goals.
Let’s look at a few common types of analysis and the insights they can offer.
Trend analysis
Trend analysis involves visualizing and analyzing changes in a metric over a period of time.
What other insights can trend analysis offer to UX researchers?
- Trend analysis can help you identify shifts or changes in user behavior over time, allowing them to adapt designs and interfaces to better match evolving user preferences.
- You can track adoption rates of specific features to understand what aspects of the product are gaining traction with users.
- By tracking trends in user satisfaction scores or feedback, you can gauge the success of design changes or product updates.
- Trend analysis can reveal if usability metrics like task completion rates are improving or declining so that you can tweak the UI accordingly.

User feedback analysis
As mentioned, customer feedback is invaluable when it comes to understanding user behaviors and their preferences.
How do you do it efficiently?
Quantitative analysis is not a problem. If your tool doesn’t offer a dashboard with key metrics, you can fairly easily analyze and visualize the data for trends in a spreadsheet.
Qualitative analysis is a bit more challenging. Or at least it used to be until recently.
Thanks to AI, you can now analyze huge numbers of open-ended user responses for trends and patterns. Many feedback solutions , like Userpilot, also allow you to tag and group them to facilitate analysis.

Funnel analysis
Funnel analysis looks into user conversions at the main touchpoints and milestones in the user journey.
For example, you could track how users progress from signup to conversion to paid customers, or from visiting your e-commerce site to making a purchase.
It’s an intuitive technique that allows even non-technical teams to identify bottlenecks that prevent users from progressing or slow them down.
It’s enough to look at the chart to spot the stages where users experience friction because that’s where they drop off. If you can’t see this straight away, a quick look at how long it takes users to convert will reveal the friction points.

Session recordings
Session recordings are an excellent tool for in-depth analysis of user interactions with UI elements on the page.
As the name suggests, you use software like Truestory, Hotjar, or Heap to record everything that the user does on the screen.
Thanks to that, you can identify usability issues in the design. For example, users may not be able to find a feature that’s relevant to their use case, rage-click on an unclickable element, or don’t scroll far enough to access crucial information.
7. Share research insights with key stakeholders
Sharing your user experience research findings with stakeholders is an important part of the process.
For starters, it improves their ability to make informed decisions about product features, design changes, and the overall product strategy.
Moreover, sharing UX research results helps you bridge the gap between the design team and the key decision-makers and ensure that design decisions are aligned with business goals.
Finally, it creates a shared understanding between all teams involved in the product development process and improves collaboration.
8. Implement findings and optimize the user experience
There’s no point in conducting UX research if you don’t act on the insights!
How do you implement them?
As always, it depends on the nature of the problem.
Let’s imagine your users struggle to find the right features in the menu because it’s too cluttered. A simple solution would be to simplify the menu and personalize it for users with different user cases using data from welcome surveys.
Another example:
If users keep getting stuck on a particular task, you could trigger contextual UI patterns , like tooltips or hotspots, to guide them through.

9. Iterate and improve key performance metrics
When you test the UX design changes before rolling them out for all users, you increase the chances that they will move the needle in the right direction.
However, it doesn’t mean things can’t be better.
As users engage with the design, keep tracking their behavior, collecting feedback, and interviewing to identify further areas for optimization.
Then, implement the changes, and test again.
Rinse and repeat.
UX research process can help you make your product more intuitive and inclusive for users. By responding to their pain points and challenges and catering to their needs, you also boost their satisfaction and loyalty. This translates into better business performance.
If you’d like to see how Userpilot can help you with UX research, book the demo!
Leave a comment Cancel reply
Save my name, email, and website in this browser for the next time I comment.

Get The Insights!
The fastest way to learn about Product Growth,Management & Trends.
The coolest way to learn about Product Growth, Management & Trends. Delivered fresh to your inbox, weekly.
The fastest way to learn about Product Growth, Management & Trends.
You might also be interested in ...
Quantitative data analysis: everything you need to know.
Aazar Ali Shad
Amplitude Tracking: How Does It Work and Are There Better Alternatives?
Saffa Faisal
Clari Autocapture: An In-Depth Look + A Better Alternative
What Is User Research, and What Is Its Purpose?
User research, or UX research, is an absolutely vital part of the user experience design process.
Typically done at the start of a project, it encompasses different types of research methodologies to gather valuable data and feedback. When conducting user research, you’ll engage with and observe your target users, getting to know their needs, behaviors, and pain points in relation to the product or service you’re designing.
Ultimately, user research means the difference between designing based on guesswork and assumptions, and actually creating something that solves a real user problem. In other words: Do not skip the research phase!
If you’re new to user research, fear not. We’re going to explain exactly what UX research is and why it’s so important. We’ll also show you how to plan your user research and introduce you to some key user research methods .
We’ve divided this rather comprehensive guide into the following sections. Feel free to skip ahead using the menu below:
- What is user research?
- What is the purpose of user research?
- How to plan your user research.
- An introduction to different research methods—and when to use them.
Ready? Let’s jump in.
1. What is user research?
User experience research is the systematic investigation of your users in order to gather insights that will inform the design process. With the help of various user research techniques, you’ll set out to understand your users’ needs, attitudes, pain points, and behaviors (processes like task analyses look at how users actually navigate the product experience —not just how they should or how they say they do).
Typically done at the start of a project—but also extremely valuable throughout—it encompasses different types of research methodology to gather both qualitative and quantitative data in relation to your product or service.
Before we continue, let’s consider the difference between qualitative and quantitative data .
Qualitative vs. Quantitative data: What’s the difference?
Qualitative UX research results in descriptive data which looks more at how people think and feel. It helps to find your users’ opinions, problems, reasons, and motivations. You can learn all about in-depth in this video by professional UX designer Maureen Herben:
Quantitative UX research , on the other hand, generally produces numerical data that can be measured and analyzed, looking more at the statistics. Quantitative data is used to quantify the opinions and behaviors of your users.
User research rarely relies on just one form of data collection and often uses both qualitative and quantitative research methods together to form a bigger picture. The data can be applied to an existing product to gain insight to help improve the product experiences, or it can be applied to an entirely new product or service, providing a baseline for UX, design, and development.
From the data gathered during your user research phase, you should be able to understand the following areas within the context of your product or service:
- Who your users are
- What their needs are
- What they want
- How they currently do things
- How they’d like to do them
As you consider the why of user research, remember that it’s easier than you might realize to overlook entire groups of users. It’s important to ensure that you’re conducting inclusive UX research and that starts in the earliest stages!
2. What is the purpose of user research?
The purpose of user research is to put your design project into context. It helps you understand the problem you’re trying to solve; it tells you who your users are, in what context they’ll be using your product or service, and ultimately, what they need from you, the designer! UX research ensures that you are designing with the user in mind, which is key if you want to create a successful product.
Throughout the design process, your UX research will aid you in many ways. It’ll help you identify problems and challenges, validate or invalidate your assumptions, find patterns and commonalities across your target user groups, and shed plenty of light on your users’ needs, goals, and mental models.
Why is this so important? Let’s find out.
Why is it so important to conduct user research?
Without UX research, you are essentially basing your designs on assumptions. If you don’t take the time to engage with real users, it’s virtually impossible to know what needs and pain-points your design should address.
Here’s why conducting user research is absolutely crucial:
User research helps you to design better products!
There’s a misconception that it’s ok to just do a bit of research and testing at the end of your project. The truth is that you need UX research first, followed by usability testing and iteration throughout.
This is because research makes the design better. The end goal is to create products and services that people want to use. The mantra in UX design is that some user research is always better than none .
It’s likely at some point in your UX career that you will come across the first challenge of any UX designer—convincing a client or your team to include user research in a project.
User research keeps user stories at the center of your design process.
All too often, the user research phase is seen as optional or merely “nice-to-have”—but in reality, it’s crucial from both a design and a business perspective. This brings us to our next point…
User research saves time and money!
If you (or your client) decide to skip the research phase altogether, the chances are you’ll end up spending time and money developing a product that, when launched, has loads of usability issues and design flaws, or simply doesn’t meet a real user need. Through UX research, you’ll uncover such issues early on—saving time, money, and lots of frustration!
The research phase ensures you’re designing with real insights and facts — not guesswork! Imagine you release a product that has the potential to fill a gap in the market but, due to a lack of user research, is full of bugs and usability issues. At best, you’ll have a lot of unnecessary work to do to get the product up to scratch. At worst, the brand’s reputation will suffer.
UX research gives the product a competitive edge. Research shows you how your product will perform in a real-world context, highlighting any issues that need to be ironed out before you go ahead and develop it.
User research can be done on a budget
There are ways that you can conduct faster and less costly user research , utilizing Guerrilla research outlined later on in this article (also handy if budget and time are an issue). Even the smallest amount of user research will save time and money in the long run.
The second challenge is how often businesses think they know their users without having done any research. You’ll be surprised at how often a client will tell you that user research is not necessary because they know their users!
In a 2005 survey completed by Bain, a large global management consulting firm, they found some startling results. 80% of businesses thought they knew best about what they were delivering. Only 8% of those businesses’ customers agreed.
The survey may be getting old, but the principle and misperception still persist.
In some cases, businesses genuinely do know their customers and there may be previous data on hand to utilize. However, more often than not, ‘knowing the users’ comes down to personal assumptions and opinions.
“It’s only natural to assume that everyone uses the Web the same way we do, and—like everyone else—we tend to think that our own behavior is much more orderly and sensible than it really is.” (Don’t Make Me Think ‘Revisited’, Steve Krug, 2014.) A must on every UX Designer’s bookshelf!
What we think a user wants is not the same as what a user thinks they want. Without research, we inadvertently make decisions for ourselves instead of for our target audience. To summarize, the purpose of user research is to help us design to fulfill the user’s actual needs, rather than our own assumptions of their needs.
In a nutshell, UX research informs and opens up the realm of design possibilities. It saves time and money, ensures a competitive edge, and helps you to be a more effective, efficient, user-centric designer.
3. How to plan your user research
When planning your user research , it’s good to have a mix of both qualitative and quantitative data to draw from so you don’t run into issues from the value-action gap, which can at times make qualitative data unreliable.
The value-action gap is a well-known psychology principle outlining that people genuinely don’t do what they say they would do, and is commonly referred to as what people say vs. what people do.
More than 60% of participants said they were “likely” or “very likely” to buy a kitchen appliance in the next 3 months. 8 months later, only 12% had. How Customers Think, Gerald Zaltman, 2003
When planning your user research, you need to do more than just User Focus Groups—observation of your users really is the key. You need to watch what your users do.
Part of being a great user researcher is to be an expert at setting up the right questions and getting unbiased answers from your users.
To do this we need to think like the user.
Put yourself in your user’s shoes without your own preconceptions and assumptions on how it should work and what it should be. For this, we need empathy (and good listening skills) allowing you to observe and challenge assumptions of what you already think you know about your users.
Be open to some surprises!
4. When to use different user research methods
There’s a variety of different qualitative and quantitative research methods out there. If you’ve been doing the CareerFoundry UX Design course , you may have already covered some of the list below in your course.
It isn’t an exhaustive list, but covers some of the more popular methods of research. Our student team lead runs through many of them in the video below.
Qualitative Methods:
- Guerrilla testing: Fast and low-cost testing methods such as on-the-street videos, field observations, reviews of paper sketches, or online tools for remote usability testing.
- Interviews: One-on-one interviews that follow a preset selection of questions prompting the user to describe their interactions, thoughts, and feelings in relation to a product or service, or even the environment of the product/service.
- Focus groups: Participatory groups that are led through a discussion and activities to gather data on a particular product or service. If you’ve ever watched Mad Men you’ll be familiar with the Ponds’ cold cream Focus Group !
- Field Studies: Heading into the user’s environment and observing while taking notes (and photographs or videos if possible).
- In-lab testing: Observations of users completing particular tasks in a controlled environment. Users are often asked to describe out loud their actions, thoughts, and feelings and are videoed for later analysis
- Card sorting : Used to help understand Information Architecture and naming conventions better. Can be really handy to sort large amounts of content into logical groupings for users.
Quantitative Methods:
- User surveys: Questionnaires with a structured format, targeting your specific user personas. These can be a great way to get a large amount of data. Surveymonkey is a popular online tool.
- First click testing: A test set up to analyse what a user would click on first in order to complete their intended task. This can be done with paper prototypes, interactive wireframes or an existing website.
- Eye tracking: Measures the gaze of the eye, allowing the observer to ‘see’ what the user sees. This can be an expensive test and heatmapping is a good cheaper alternative.
- Heatmapping: Visual mapping of data showing how users click and scroll through your prototype or website. The most well-known online tool to integrate would be Crazyegg.
- Web analytics: Data that is gathered from a website or prototype it is integrated with, allowing you to see the demographics of users, page views, and funnels of how users move through your site and where they drop off. The most well-known online tool to integrate would be Google Analytics .
- A/B testing: Comparing two versions of a web page to see which one converts users more. This is a great way to test button placements, colors, banners, and other elements in your UI.
Further reading
Now you know what user research is and why it’s so important. If you’re looking for a way to get trained in this particular discipline, there’s good news—owing to demand and popularity, there’s a growing number of UX research bootcamps out there.
If you’d like to learn more about UX research, you may find the following articles useful:
- What Does A UX Researcher Actually Do? The Ultimate Career Guide
- How to Conduct User Research Like a Professional
- How to Build a UX Research Portfolio (Step-by-Step Guide)
User research is the process of understanding the needs, behaviors, and attitudes of users to inform the design and development of products or services. It involves collecting and analyzing data about users through various methods such as surveys, interviews, and usability testing.
2. How to conduct user research?
User research can be conducted through various methods such as surveys, interviews, observations, and usability testing. The method chosen depends on the research goals and the resources available. Typically, user research involves defining research objectives, recruiting participants, creating research protocols, conducting research activities, analyzing data, and reporting findings.
3. Is user research the same as UX?
User research is a part of the broader UX (User Experience) field, but they are not the same. UX encompasses a wide range of activities such as design, testing, and evaluation, while user research specifically focuses on understanding user needs and behaviors to inform UX decisions.
4. What makes good user research?
Good user research is characterized by clear research goals, well-defined research protocols, appropriate sampling methods, unbiased data collection, and rigorous data analysis. It also involves effective communication of research findings to stakeholders, as well as using the findings to inform design and development decisions.
5. Is user research a good career?
User research is a growing field with many opportunities for career growth and development. With the increasing importance of user-centered design, there is a high demand for skilled user researchers in various industries such as tech, healthcare, and finance. A career in user research can be fulfilling for those interested in understanding human behavior and designing products that meet user needs.
Are you an agency specialized in UX, digital marketing, or growth? Join our Partner Program
Learn / Guides / UX research guide
Back to guides
A 7-step adaptable UX research process
Every team knows how important great UX research is for satisfying and converting users. But with so many tasks to juggle, research can get pushed to the bottom of the workflow.
You conduct research—but only in response to stakeholder requests, user complaints, or a major new web or product launch. By then, it’s too late for your research to shape your design. The result? Scrappy research and a missed opportunity to forge your product around user needs.
Last updated
Reading time.
Be proactive rather than reactive by implementing a solid user experience (UX) research process from the start. Stay tuned to learn how to structure a flexible, 7-step research process that will guide your product development and design thinking to help you generate customer delight.
Boost your UX research with Hotjar
Design confidently with Hotjar’s rich, data-informed user experience insights
Why a strong UX research process is key
The UX research process acts as the foundation for all other stages of UX design and product development.
Mar P., product researcher at Hotjar, says: “The main goal of UX research is to create a product that works for your users and your business. It's about understanding real user problems so the team can work on solutions and move away from assumptions that can lead to bad product decisions. ”
Without a strong UX research process, you’ll end up with frustrated users, low conversion and customer loyalty rates, high error and churn rates, and costly redesigns. In short, if you rely on guesswork rather than research , users suffer—and so do your business objectives and team.
What are the benefits of great UX research?
Great UX research helps you make confident UX decisions.
It lets you validate your assumptions and weed out unpromising ideas before you waste resources on them, and ensures your product is designed to delight users from the start.
Ongoing UX research is crucial to cultivating empathy for users throughout your organization . User experience data helps you solve problems and continually optimize your platform or product to meet user needs, and gives you the insights you need to get stakeholder buy-in on fixes and redesigns.
UX research is critical in validating that a team’s concepts are on the right track. It fosters alignment between an idea and the reality of what users actually want and need. UX research also allows teams to ‘fail early’ and adapt before large sums of time and money are spent.
The UX research process
Clearly, research is critical to UX design and development success.
So it can’t just happen sporadically to put out customer or stakeholder fires, or when you happen to find yourself with extra time—which, let's be honest, never happens .
Instead, engage in a structured UX research process to prioritize research and infuse all stages of UX design with data insights.
But remember: a structured process doesn’t mean a rigid process. There’s no one-size-fits-all solution to UX research: the best processes are flexible, adaptable, and tailored to the unique needs of your users, team, and business.
Use our guide to establish a solid UX research process—tweaking it throughout to fit your workflow, company culture, and customer types.
You want your UX research to inform decisions, rather than post-rationalize decisions that have already been made without customer input. That’s why you need to define a research process.
7 steps for user research with impact
Our step-by-step guide to UX research is based on lean UX design principles, meaning continuous iteration, testing, and user feedback are central.
Lean UX is based on an agile cycle with three phases:
Think: brainstorming and reflecting on areas for improvement
Make: creating new designs or features to solve user problems
Check: testing assumptions and verifying designs with real customers
UX research is a non-linear process—research doesn’t end when design and development begin. The best research centers on continuous discovery at every stage, and involves circling back and forth between those stages.
These 7 steps will get you well on your way:
1. Clarify your goals
Clear goals will help you define the process, efficiently distribute resources, get stakeholders on board, and maximize the user insights you uncover .
Start by formulating hypotheses and topics of interest based on the potential problems and opportunities you want to learn more about. These might emerge from previous research, new opportunities you’ve identified, or from creative brainstorming.
Then, define the key UX research questions you want to answer . These might center on user behavior (why are customers abandoning carts?), on different UX design options (which new CTA option performs best?), or on customer goals (which new features would most improve the user experience?).
Pro tip : design user questions that are focused but flexible enough to allow for free discovery. Don’t go in armed with too many assumptions and don’t ask leading questions. Make sure you leave space to discover new information from your users that might not have occurred to you. Set up Hotjar’s Feedback widget to collect open-ended feedback from users to start.
Next, make sure you contextualize UX research goals in line with larger organizational objectives and success metrics: how will decreasing cart abandonment impact conversions and revenue, for example?
Finally, explain to key stakeholders what you’re doing—and why—to get their support and maximize the reach of your research.
It’s important to set research goals around current problems. For instance, if we need to offer an advanced search function for an ecommerce website, the goal will be to find the best solution for our users that’s easy to implement from the development perspective.
2. Define your research methods
Once you’ve set goals and designed user questions, decide what kinds of research you’ll do and the type of data you want to collect.
Use a variety of methods to cover all the bases and fill potential gaps. These will depend on your user and business needs, and the resources you have available.
Make sure you include both attitudinal and behavioral UX research methods .
Behavioral research is about observing how users act. Heatmaps, A/B testing, user recordings, and eye-tracking are all important sources you can use to understand user behavior data.
Attitudinal research tells you how users are thinking and feeling . This often involves asking them directly through surveys, focus groups, customer interviews, concept testing, and card sorting.
If you rely on only one of these, you’ll be missing out on the big picture. Combining behavioral and attitudinal research fills in the gaps between what users say and what they actually do , which don’t always align.
Seek to also explore a mix of qualitative and quantitative UX data.
Quantitative studies put a number on user behavior. Analyzing the number of users who scrolled past your CTA or clicked in frustration where they couldn’t find a button will help you spot patterns in clickthroughs, conversions, user engagement, and retention.
Qualitative data uncovers the reasons behind these patterns. They’re opportunities to learn what your users really think and help you understand their needs more deeply.
Remember: Hotjar’s tools combine behavioral and attitudinal research methods through a blend of quantitative and qualitative data. Use Hotjar Surveys and Feedback widgets to collect voice-of-customer (VoC) feedback, and Heatmaps and Session Recordings to round out the picture with behavioral insights.

3. Dive into discovery
Once you’ve set up research questions and UX analysis methods, the next step is to jump into the discovery phase, where the spotlight should be on speaking to your customers and understanding what they need to convert.
Seek to develop a deep understanding of your users, the problems they experience, and what will help them with their jobs to be done.
User interviews are a great way to start—video tools like UserInterview can really help when paired with Hotjar's brilliant interview tips .
Check out our in-depth guide to UX research tools that can help streamline the process.
You should also:
Observe customers using other similar sites (lab studies are great, but you can also use session recordings to see how users behave in their own environment)
Deploy Hotjar Feedback widgets to learn what users are thinking while they browse and understand blocks in navigation
Use surveys to ask users questions about their current and ideal experience
Run competitive analyses and conduct market research to understand the UX offered by other companies and identify areas of improvement and exploration
Make sure to ask customers open-ended questions about their experiences and what they’d like to see, as well as targeted questions around navigating particular product pages or features. For example, are they finding all the information they need to confidently complete the checkout process? You might discover that your users like to check out reviews before making a final decision, so making reviews more accessible could help UX and conversions alike.
4. Dig deeper and explore
Use the insights from the discovery phase as a starting point, then get more specific and home in on answering your specific UX research questions and really understanding your users at a granular level.
Map out customer journeys and develop user personas and stories to clarify and communicate the information you’ve learned.
You should also use your discoveries to inform preliminary idea development, design sketches, and wireframes and prototypes.
Maybe you’re losing customers at the checkout stage, and discovery phase feedback has suggested it could be because you don’t have a ‘guest checkout’ option, forcing users to sign up for a full account, which creates friction if they’re browsing your site on mobile.
Start by validating the guest checkout idea with your users, then design and test different iterations through prototypes, mockups, and card sorting experiments.
5. Iterate and test
Once you have a working model of your website or product redesign, focus on testing the user experience to refine it.
Here's how:
Start with usability testing to ensure that your website hierarchies, user flow, and search filters make sense. Run A/B and multivariate testing to see which designs users respond to best, and use heatmaps to see exactly where they're clicking and scrolling.
Make sure you also evaluate accessibility: is the guest checkout option easy to find? Is it visible to users across different devices, and with different vision needs?
Next, go deeper: seek to build a complete picture of the UX and how it facilitates and blocks users from getting their needs met.
Observe users in action. Use Hotjar Heatmaps to identify click and scroll patterns and Session Recordings to track the entire user journey. This helps the UX team see what their customers see, which is crucial at this testing stage when you’re often too close to the design to understand the experience from the outside.
Look at the page elements customers are engaging with, and which ones they’re scrolling past. Filter session recordings by rage clicks to see where users may be clicking in frustration expecting a button or action. Pay special attention to dissatisfied customers or users who didn’t complete key conversion actions, and understand what their journey looks like.
Complement this understanding of user behavior with qualitative interviews and survey methods that will help you understand their motivations and product experience (PX).
6. Evaluate and communicate research findings
By now, you’ve collected many research insights. Organize your data using categories and tags, focusing on user pain points . Look for key patterns and recurring issues—and once you’ve identified them, ask users more questions if needed.
Make your research insights searchable, manipulable, and easily accessible by everyone on the team.
Then, engage in cross-functional communication outside the core UX team. Make sure you keep different departments informed and involved with your UX research process.
Create UX analysis reports and engage stakeholders with comprehensive UX and user storytelling and strong product narratives. But make sure you also share key nuggets of user data along the way, so your research insights filter throughout the whole organization.
Pro tip : use Hotjar Highlights to easily share user recording clips, screenshots, heatmap snippets, and VoC quotes throughout your company. You can also use the Slack integration to automatically keep different departments up to date!

7. Put your research into action
The UX research data you gather is a potential goldmine. It can help you prioritize brilliantly and boost user satisfaction, engagement, and retention. But only if you turn those insights into action .
You need to put the data to work in making key UX design decisions.
Use your UX research insights to prioritize fixes and product updates . Focus on urgent issues that are affecting key metrics and blocking users from meeting their needs.
Heatmaps and session recordings can help you quickly spot low-hanging fruit. You might find you could drastically improve conversions by positioning your CTA differently or making your signup form more streamlined and intuitive.
For larger design opportunities that will require significant resources, UX research data can help you to justify the cost to stakeholders.
I follow the process of finding patterns in the data, pulling at least one insight from each identified pattern, and then creating at least one design recommendation or design principle for each insight. When you are designing you can easily refer back to your identified design principles and requirements to help guide your decision making and have data-supported designs when it’s time for handoff.
Building the UX research process into your design culture
UX research isn’t a one-time activity to be forgotten about once you begin designing and developing.
The UX research process should happen continuously, influencing all other aspects of UX design and product development. Ongoing research, testing, and user conversations are all part of confident, user-led design thinking.
Prioritizing brilliant UX research will improve your design culture, boost conversions, and keep users engaged and delighted.
FAQs on the UX research process:
Is ux research important.
UX research is hugely important in data-informed UX design. The UX research process acts as the foundation for all other stages of UX design and development.
Great UX research gives you confidence in your UX decisions, lets you test your assumptions and weed out unpromising ideas before you waste resources on them, and ensures your product is designed to delight users from the start.
UX research is crucial to cultivating empathy for users throughout your organization . It helps you to problem-solve and continually optimize your platform or product to meet user needs, and gives you the evidence you need to get stakeholder buy-in on fixes and redesigns.
Should I do attitudinal or behavioral UX research?
Use both attitudinal and behavioral UX research methods.
Behavioral research is about observing how users act. Heatmaps, A/B testing, user recordings, and eye-tracking are all important sources of user behavior data.
If you rely on only one of these, you’ll be missing a big part of the picture. Combining behavioral and attitudinal research methods fills in the gaps between what users say and what they actually do , which don’t always align.
What’s the best UX research process?
There’s no one-size-fits-all solution to UX research. The best processes are flexible and tailored to the unique needs of your users, team, and business.
We recommend a 7-step, adaptable UX research process:
Clarify your goals
Define your research methods
Dive into discovery
Dig deeper and explore
Iterate and test
Evaluate and communicate your research findings
Put your research into action
UX research guide
Previous chapter
UX research questions
Next chapter
Subscribe to stay in the loop!
Ux research data analysis: a step-by-step.

Prefer to read in Ebook format?
We will send you this complete Ebook to facilitate your reading.

UX Research Data Analysis is crucial for any research process. Collecting information will have no purpose if your team won't analyze it properly to gather insights and support decision-making. Therefore, remember that no matter what kind of research you're conducting,…
Sending the ebook
You will receive the ebook directly in your email a few minutes after confirming your request in the form below.
Ebook sending confirmed!
You will receive the ebook directly to your email in a few minutes.
Attention! Please check your spam folder if you cannot find the email in your main box .
Once you find the email in spam, move it to your main box and add the email [email protected] to your contact list, thus preventing other emails from the spam folder.
UX Research Data Analysis is crucial for any research process. Collecting information will have no purpose if your team won’t analyze it properly to gather insights and support decision-making.
Therefore, remember that no matter what kind of research you’re conducting, one of the most critical researcher’s responsibilities is performing data analysis to gather insights and provide recommendations! Keep reading to learn how.
Why should you analyze data?
Making decisions supported only by raw data is a big mistake for any project, including UX Design projects.
At best, skipping analysis will make the design team deliver an incomplete or inefficient solution for users. At the very worst, not analyzing the data can make the design team solve the wrong problem and not even know who their real users are.
Therefore, analyzing data is a fundamental process that drives a project in the right direction, considering users’ needs and gathering insights that help develop better solutions.
A common mistake regarding analysis is jumping to decisions based only on statistical numbers. For example, 60% of users leave the website while on the check-out page.
An impulsive decision regarding this information would possibly be a full-page redesign. But, the problem of users leaving may be related to payment options and methods.
In this case, the redesign would never solve the problem, and that rush decision would probably make the company waste time and money .
This simple example clarifies why analyzing data is important to avoid bad decisions that can harm product development.
Reading tip: UX Research – A Key Role In Product Design
Don’t leave data analysis for last

When we talk about UX Research data analysis, a lot of people may think: Okay, we’ll do this work in the end, once we have all data in hand.
However, this strategy is not efficient because, by the end of the process, you will have too much data to analyze , plus all the details and observations that were made during the research.
Therefore, analyze data while it’s fresh out of the oven.
For example, by the end of each interview, take a few minutes to organize ideas and write everything down.
Also, don’t forget to take notes during the interviews; you might have valuable insights that can be lost if you don’t follow your line of thought immediately.
Doing this process as you go makes the final analysis much more organized and easy to make.
How to run analysis during interviews?
Always pay attention and take notes about what users say; the words they choose, their facial expressions, body language, and overall behavior. Every detail counts to fully comprehend their reactions, how they feel, and how they think.
If possible, consider doing the interviews in pairs, so while one person interviews the user, the other observes and takes notes.
These simple steps will make the final analysis much faster once all the insights and observations are documented.
A UX Research process can take weeks or months. So, imagine all the effort to remember small details if you don’t write them right after the interviews are over.
What should you do once the interviews are over?
After the interviews, reserve some time to summarize and organize data and observations.
You can spread the notes over a table and cluster them; look for connections and patterns.
After this, discuss with the team the results and your notes . Then, once you are all together, try to gather everyone’s insights.
This process will provide some important pre-results for the final analysis, which we’ll go through next.
Conducting a UX Research data analysis
Data analysis is the process of turning raw data into relevant information that supports business decisions.
Take a look at a few methods and tools that will help you a lot in this process. There are five fundamental steps to performing a throughout data analysis:

- Defining analysis objectives;
- Organizing data;
- Investigation;
- Clusterization;
- Results and insights identification.
Defining analysis objectives
Analysis objectives are related to the UX Research objectives.
So, keep in mind the reasons why you’ve run a UX Research in the first place, for example:
- What are the user’s needs?
- Which user profile is more likely to use our product?
- On which page is the bounce rate more significant and why?
- What improvements should we make to increase the conversion rate?
- How to make our product more attractive than our competitors’?
These questions help you understand how to conduct the data analysis.
Without a clear objective, the data analysis becomes shallow and useless for the project.
Therefore, the very first step for efficient data analysis is to define the objectives and the answers you are looking for.
Organizing data
In almost every research, you will collect every kind of data, including those that are not relevant to the project.
This way, organizing and filtering information are important to separate useful from useless data.
Moreover, organizing is also about laying out the data so it can be easily found . For example, if a particular webpage has a higher priority, organize data according to which webpage they are about.
This way, you can easily access all data related to the home page or check-out page, for example.
Organizing data is crucial to support efficient data analyses and improve visualization, allowing everyone to better comprehend the numbers and their relevance.
Reading tip: UX Survey – How To Collect Trustful Data
Investigation
The Investigation phase is perhaps where a cognitive effort from researchers is most needed in the whole data analysis process.
The main goal of this phase is to identify words, ideas, or expressions that show up more often in users’ answers and are more likely to be aligned with the analysis objective.
However, an investigation is not about looking for words and their synonymous. Instead, you must know what the words and expressions mean to the users in their own context.
People are different from each other, and groups of people tend to express themselves in a very particular way. So, expressions and words can have different meanings depending on the group of users you are analyzing.
This way, avoid rewriting users’ answers with your own words . Instead, transcribe them exactly the same. Every change or variation in words or expressions can damage the investigation phase and data analysis.
Clusterization
The next step is about creating clusters to label the answers according to what was identified in the investigation phase.
Clusters help the team understand which subjects are a priority and which ones are not.
For example, if a cluster labeled “Interface Performance” was created and you realize that more than half of the users’ answers fit into it, probably the team should prioritize this subject and look for issues regarding interface performance.
Designers organize and analyze large numbers of ideas by categorizing them into clusters.
Results and insights identification
First of all, results and insights are different things.
Results are related to the facts that were found, investigated, and clustered during the analysis process. On the other hand, insights relate to understanding what has caused those results.
This difference exists because users’ answers do not always drive to the root of the problem . Instead, it’s a designer’s job to look deeper and search for insights.
Remember : users are usually unable to identify the root of their problems.
Therefore, the data analysis process pushes the team to see through the results; discuss and find insights, and align findings with the research objectives.
Actually, workshops are a powerful tool to help the team discuss the results and gather insights.
Promote more than one round of discussion to ensure that the insights found are truly the most relevant.
If possible, do a break between one round and another so the team members can clear their minds.
Different research methods, different analysis

The above step-by-step is a general and standard process that works with any research method, qualitative or quantitative.
However, each of these methods has its singularities and you should know how to deal with them accordingly.
Quantitative research data analysis
Quantitative research collects and analyzes numerical data. This method aims to gather quantifiable data and works with statistics and probability, such as:
- the success rate of a specific task;
- how long a user takes to complete a task;
- the bounce rate of a webpage;
- user’s demographic profile.
The quantitative analysis tells a story about how people use and interact with a product while providing specific information about users and their context.
Of course, you can only fully comprehend a user’s story once you analyze both quantitative and qualitative results.
Qualitative research data analysis
Unlike quantitative research, qualitative research works with abstract concepts like human behavior. So you’ll need more time to evaluate their results since they describe ideas, opinions, and experiences.
When you have to analyze qualitative results, ask yourself:
- What do the users like the most about the product?
- What do they like the least?
- Which features are more valuable?
- Why do some users react differently from others?
- Did they have an emotional response? When?
- Are they satisfied with the product? Why?
The qualitative research data analysis provides you with in-depth insights regarding user experience.
Moreover, with the differences between the two methods, it is clear that UX Research must count on quantitative and qualitative results. Complement approaches will provide you with more information, better insights, and outcomes.
Thematic Analysis
As seen above, organizing data and clusterization are two important steps when analyzing data.
At first, these two activities may look simple, but depending on the amount of data, available time, and team expertise, they can become more complex to accomplish.
In this sense, Thematic Analysis is an efficient method that can help you organize data.
Themes and codes
Thematic Analysis works on the identification of themes through codes.
According to Nielsen Norman Group :
- Themes are a description of a belief, practice, need, or another phenomenon that is discovered from the data;
- Codes are words or phrases that act as labels for a segment of text, like a keyword or a hashtag.
In the Thematic Analysis process, codes have a description to help the researcher understand if that’s the segment of text they are looking for.
Codes can either be descriptive or interpretative:
- Descriptive codes describe what the data is about;
- Interpretative codes are an analytical reading of the data, adding the researcher’s interpretive lens to it.
It’s important to understand these definitions to implement Thematic Analysis.
Reading tip: Problem Investigation In UX Design
How does Thematic Analysis work?
The Thematic Analysis has the following workflow:

- Gather all the data;
- Read all the data;
- Code the text;
- Create new codes that encapsulate potential themes;
- Take a break;
- Evaluate the themes.
1) Gather all the data
First of all, you should gather all the raw data regarding the interviews, surveys and any other research method applied.
You must also transcribe audio and video files, so you have in hand all the material in text format. This will make the process easier.
2) Read all the data
The second step of the process is having everyone on the same page. For this, workshops can be a great tool to make the whole team engage with the data you have.
During the workshop session, ask team members to highlight everything they think it’s important.
An interesting technique is giving each member one transcript at a time, instead of making every person read all study entries at once.
This way, when one person finishes reading their transcripts, they can pass them along to another colleague and get a new one. This continues until everyone has read through all transcripts and entries.
3) Code the text
Coding the text means creating categories for the highlighted sections from the previous step. At this stage, it’s essential to have in mind the research objectives, put them up on a wall if necessary.
There are two ways to code the text:
- During the reading phase;
- After the reading phase.
1) Coding while your reading is the traditional approach; as you highlight segments of the data, like sentences or paragraphs, you already code them.
To avoid creating multiple codes for the same type of issue, especially if more people will be coding the text, keep a record of all the codes used and specify what they are . This way, you can refer to this list when coding other sections of text.
2) You will cut up the highlighted sections—physically or digitally—and group all the similar highlighted segments. Then give a code to these clusters.
At the end of this process, you should have data grouped by topics and codes for each topic.
4) Create new codes that encapsulate potential themes
Once you have the first codes in hand, the next step regards finding codes that relate to each other and underlying themes among them.
Then, you will refine and replace the first codes created in the previous phase for ones that better fit the answers and consider more relevant themes.
So at this phase, reflect on the following:
- What is happening in each group?
- Are these codes related? How?
- Are these codes relevant to my research questions?
Analyze the text within each grouping and look for relationships between the data.
5) Take a break
Thematic Analysis involves a huge intellectual load . After a long time reading, creating, and reviewing codes, you should take a break from that.
Clearing the mind is crucial to avoiding mistakes and allows us to conduct analysis more efficiently.
6) Evaluate the themes
The Thematic Analysis’ last step regards reviewing the created codes and themes. At this point, you should open the discussion to more team members, in case you haven’t done it yet.
So, promote an in-depth analysis to ensure that the themes are relevant and if they help the research toward its objectives. Evaluating and reviewing the themes is what helps eliminate bias or wrong interpretations.
Ask yourself:
- Are the themes supported by data?
- Did you find any information that doesn’t support your themes?
- Does everyone agree with the themes you have found in the data after analyzing it separately?
Reading tip: Desk Research – How To Conduct Secondary Research Efficiently
Data analysis and contradictory results

The UX Research process has different approaches to collecting data, considering different points of view in order to gather valid results.
Thus, the usual expectation of the research team is to find that even different methods will point to the same results or insights.
But there are situations where different methods lead the team to contradictory results. In this case, what should you do?
Again, Nielsen Norman Group has an example regarding this situation:
A company developed a new version of a product that their employees use every day to work with. The project team identified that the productivity rate has increased since the launch of that new version.
However, when researchers ran qualitative research to collect users’ feedback, they found that employees were not satisfied with the new product’s version.
This situation sounds contradictory, doesn’t it? A the same time that the productivity rate has increased, users are complaining about the update.
Before closing the case and deciding the results are wrong, the research team has to verify if something went wrong.
Check the methodology
When in contradictory situations, the research team must review the whole process to verify if there is something wrong.
Reviewing the process, the data collected and the results are important to ensure there are no inconsistencies.
You should review the following elements:
- Respondents : Did the same respondents answer both qualitative and quantitative research? Different people may lead to different answers to the same questions;
- Tasks : Are user testing tasks consistent? Every user had the same time to know and interact with the new interface?
- Logistics : Where was the user testing conducted? Does the place interfere with the productivity rate?
- Data analysis : Is there statistical significance? Was the difference in productivity rate considerable?
Everything is okay with the methodology
If the methodology is correct, then maybe new research is required.
In the example above, new research is necessary to understand why users are not satisfied with the product despite the fact that their productivity has increased.
Finding contradictory results is part of the work and happens more often than one might expect.
What are the insights and recommendations?

The data analysis final product is a presentation containing insights and recommendations to solve user problems and their needs.
Insight is a description of the research analysis based on the themes and clusters which will support business decisions.
Therefore, insights are different than research results. For example, finding that 60% of users leave the app on the check-out page as we saw earlier, is not an insight.
In this case, the insight could be:
Users feel uncomfortable with the few payment methods available. Moreover, as this information is only communicated on the check-out page, the exit rate becomes higher.
In addition, it is also important that researchers provide recommendations to solve the problems.
Stakeholders may feel frustrated to receive a complete data analysis and insights without any recommendation about the next steps.
Therefore, before presenting the insights, gather the team and discuss recommendations to solve the problems; show them in your presentation and be prepared for questions and feedback.
We hope this article could show you how important UX Research data analysis is and how it can be conducted to provide good insights and recommendations.
- A Guide to User Research Analysis
- How to Analyze Qualitative Data from UX Research: Thematic Analysis
- Interpreting Contradictory UX Research Findings
- Research Analysis
- A Guide To UX Data Analysis For Actionable Insights
- User Research: How to Collect, Organize & Share Qualitative Data
- UX research methods - a comprehensive guide
- Analyzing and synthesizing user research data
Don't forget to like and share if you enjoyed this content! This small gesture helps us a lot! Feel free to continue browsing, and if you'd like to stay up-to-date, sign up for our newsletter !

Usability Test: How To Prepare And Conduct One?

Tree Testing: How Easily Can Users Find The Information They Need?

User Interview: Keys to Gather Insightful Information

Career in Product Design: Self-Awareness to Transform Your Journey and Growth

Career in UX: How to Develop Emotional Resilience

Designer 360: The Epic Path To Be Successful In Design
We are proud to have people from our community hired every month by great companies, in countries such as Brazil, USA, UK, Ireland, Germany, Netherlands, Spain, Portugal, Austria, Czech Rep., New Zealand, and Canada.
Privacy Overview
Integrations
What's new?
In-Product Prompts
Participant Management
Interview Studies
Prototype Testing
Card Sorting
Tree Testing
Live Website Testing
Automated Reports
Templates Gallery
Choose from our library of pre-built mazes to copy, customize, and share with your own users
Browse all templates
Financial Services
Tech & Software
Product Designers
Product Managers
User Researchers
By use case
Concept & Idea Validation
Wireframe & Usability Test
Content & Copy Testing
Feedback & Satisfaction
Content Hub
Educational resources for product, research and design teams
Explore all resources
Question Bank
Maze Research Success Hub
Guides & Reports
Help Center
Future of User Research Report
The Optimal Path Podcast

Design & Product
May 14, 2024
The 8 stages of an effective UX workflow: How to create your own
A UX workflow is vital to organize your team and standardize your product development process. Here’s our breakdown of the eight stages you need to include.

Armin Tanovic
A reliable UX workflow helps UX teams minimize mistakes, save resources, and create user-centric products by outlining a clear, consistent, step-by-step UX design process for creating impactful products.
In this article, we’ll explain why UX workflows are so crucial for creating experiences your users will love, and guide you through the eight steps of creating your own streamlined UX workflow.
Streamline your UX workflow with Maze
Conduct user testing, instantly analyze results, recruit participants, and hand off results in an instant—all in one, intuitive platform

Why do you need a UX workflow in UX design?
A UX workflow provides your team with a systematic process for creating intuitive user experiences and completing UX design projects. With an effective UX workflow, you can organize your team, establish UX design objectives, and see the process through—from determining project scope to hand-off.
Some of the main benefits of establishing a UX workflow are:
- Enhanced collaboration: A clear UX workflow process outlines design processes, making it easier for team members to effectively communicate, establish roles, and delegate tasks
- Streamlined and efficient processes: A robust UX workflow makes it easier to move through the design process while reducing cost, shortening the project timeline, and saving resources
- Reduced risk of project failure: A comprehensive process will involve UX research and digital product reiteration, allowing your team to detect and identify issues early on
- Better UX that satisfies your users: You’ll have the structure you need to thoroughly research user needs and implement them in your product design and development process —resulting in a more intuitive user experience, user interface, and increased user satisfaction
Let’s look at how you can build a comprehensive UX workflow that will help you delight your users and win over your stakeholders .
The 8 stages for building a structured UX workflow
From design thinking to agile development, it only takes one Google to discover there’s a whole range of different UX frameworks and workflows out there. While UX workflow steps can and will differ, there are eight distinct phases that every UX workflow should have in common—even if their naming and order varies slightly.
- Design & prototyping
Whatever naming or order your process takes, an effective UX workflow helps structure and standardize how you turn ideas into fully-functional designs.
Defining the process itself will look different depending on unique factors within your organization. To begin planning yours, here are some main considerations:
- Stakeholder objectives: Your UX workflow, and research operations as a whole, should align UX research with business objectives
- Available resources: Work with what you have—to be effective, a UX workflow should be realistic , so ensure it’s designed around your available UX resources
- Product complexity: UX workflows differ depending on the complexity of your product—meaning some are relatively simple and others are more complex
We’ve outlined the key stages of a UX workflow with the help of industry expert Haley Stracher , UX/UI Designer and CEO of Iris Design Collaborative . Throughout these stages, we include a rolling example that demonstrates each stage in action with a UX research, design, and development scenario.
1. Needs, goals, and project scope definition
UX research and design is about solving user problems. But before you can focus on your users, you’ll need to align your efforts with broader business goals. In this initial step, you’re defining stakeholder needs, your project’s goals, and its scope. This makes organizing your project easy while ensuring all team players are on the same page.
This phase of the UX workflow is about understanding the landscape in which your UX workflow will exist. You’ll be planning, coordinating, and pulling together information from team members, stakeholders, and professionals from other departments.
Sounds like a lot on your plate? No stress.
Here’s a checklist of some of the main information you need to define and document during your UX workflow’s initial planning phase:
☑️ Business objectives: Document wider business and stakeholder goals and crucial key performance indicators (KPIs) for defining project success ☑️ Stakeholders and team members: List who will be participating in the project, including stakeholders, team members, and colleagues in other departments ☑️ Project scope: Define deliverables, timelines, budget, and project boundaries to organize your project and ensure everyone is on the same page
This first step of your UX workflow can also give you a head start in defining your user needs. If you have a UX research repository , pull out relevant insights that can inform the process, and combine feedback with your UX research in the next step of the process.
When outlining scope, Haley emphasizes balancing wider business objectives and user needs:
“Balancing stakeholder needs and user needs can be very challenging. For example, you may not want to ‘annoy’ or ‘overwhelm’ your users with certain features, however, they’re necessary for data collection or stakeholder needs to fundraise. So, it’s important to integrate these tastefully and find a happy medium between the two.”
📋 Follow the example
You’re a product manager for a learning management system called Learn&Go . After speaking to stakeholders, you’re told many users abandon the platform shortly after signing up.
Your business objective is to increase retention . During this first stage of your UX workflow, you create a document listing stakeholders, your UX team, budget, and timeline.
2. UX research process design and methodologies
Another key consideration for your UX workflow is how you’ll go about uncovering insights—your UX research process and methodologies. You need to consider your resources and how you can organize them to conduct UX research.
A good UX workflow includes UX research studies throughout the product design and development process. User research is crucial for understanding user pain points and needs, and developing products users love. That’s why adequate UX research is a must—it enables you to build a UX workflow that has the resources to consistently deliver great products.
There are many research methods to include in your UX workflow—from user interviews and UX surveys , to card sorting and tree testing , usability tests to prototype testing . You can also look at product analytics for information on product engagement and usage. These methods can and will be used at different stages of the UX design process, and help ensure you’re making decisions based on user feedback and data.
Haley states that UX research is crucial for building user personas, understanding users, and ultimately creating a platform users will love:
“UX research plays a huge role in mapping out user journeys. Market research and persona research are critical to understanding the positioning of your platform as well as integrating psychology into the UX flows, so your persona feels welcomed into the platform.”
At this stage of your UX workflow, you’re looking to employ research methods that uncover the most pressing problems or blockers users encounter. This will inform you going forward in how to meet broader business objectives.
Where are users most dissatisfied? Do they find the onboarding process confusing? Is navigating your website almost as frustrating as the problem they’re seeking to solve in the first place?
To understand why users are dropping off after signing up, you’ve decided to conduct UX surveys—using a UX research platform like Maze—to reach a large number of users at once.
You ask a mix of closed-ended and open-ended research questions like:
- How satisfied are you with Learn&Go?
- What are some ways we could improve the Learn&Go platform?
- Are you able to find what you’re looking for on Learn&Go?
- What would you change, if anything, about Learn&Go’s onboarding process?
With the creation and distribution of this survey, your initial research is underway.
3. Data analysis and insights identification
Next up in any UX workflow is data analysis. By this point, you’ve conducted initial UX research and need to uncover the insights your data has collected. The exact steps for UX research data analysis depends on the type of research you’ve conducted, and the type of data you’ve collected.
If you’ve collected quantitative data, you’ll be analyzing data using quantitative methods like mathematical interpretation and statistics. If the data you’ve got is qualitative, thematic analysis and affinity mapping will be more useful. Regardless of which you choose, knowing how you’ll approach each type of data is crucial for a streamlined UX workflow.
After analysis, you can use these insights to create and define:
- User personas: Fictional character bios that reflect a market segment of your potential users. A complete user persona will have clearly defined personality traits, motivation, demographic information, and frustrations.
- Empathy maps: A collaborative visualization tool depicting what the user says, feels, does, and thinks about a product experience.
- Journey maps: Also known as user journey flows, these UX diagrams depict the steps users take when engaging with a product. They include clearly-defined touchpoints reflecting goals, feelings, and pain points.
- User product problems: Refers to specific issues users encounter while engaging with your product. You’ll dedicate the rest of your design process to solving a single user problem.
Analysis is time-consuming. While you can do it manually, a UX research tool will streamline the process of turning raw, unusable data into actionable insights that inform your every design decision. With Maze, you can conduct interviews and instantly analyze the results for user sentiment and rich, descriptive feedback.
With the help of Maze’s automated reporting and AI analysis capabilities , you’ve rapidly analyzed results for both survey questions. The insights are eye-opening— over 67% of interviewed users find your platform difficult to navigate and can’t find course information easily . Out of the open-ended answers, you’ve noticed a trend in users wishing for a centralized area where they can review their performance .
It’s a perfect solution: a personalized profile dashboard would make user navigation more intuitive.
Time to go back to the drawing board!
4. User flow, wireframe, and prototype development
With the insights you’ve gained from analyzing your UX research data, you’re ready to begin designing UIs or specific product features. Completing this step in your UX workflow depends on how far you are in the product development process.
It’s during this stage of a UX workflow that you create designs based on your research. You want to outline your design process, including timelines and teams. This is difficult to predict, as different projects require different actions. Some key considerations for the design stage of your UX workflow include:
- Team: Who’s involved in the project? Who is responsible for what? Which roles are involved in your UX design process?
- Design process: What is your process for turning insights into products? When will you next test your designs?
- Decision-makers: Who makes the key design decisions? Who has the final say on design aspects?
- Documenting: How will you document your research and design efforts? What key documents do you need for the design process?
Some of the deliverables you can expect to develop at this stage include:
- User flows: Diagrams mapping out steps users would take to navigate through your product to meet their specific objective. Typically, design teams create user flows after they’ve validated a product or feature concept through research.
- Wireframes: A wireframe is a low-fidelity sketch of your product with basic design elements and patterns. Typically created at the beginning of the design process, it includes layout elements such as information architecture, content, interactive links, and navigation.
- Prototypes: A prototype is the simulation of your design. Types of prototype can be low-, mid-, or high-fidelity, depending on how closely it will resemble the final product. Prototypes can be interactive and simulate user interactions by linking components and UIs together.
Together with your design team, you begin creating user flows and wireframes for personalized profile dashboards. You don’t make them too detailed in the beginning—you include basic information like enrolled courses, homework, a search bar, and progress bars. Now, it’s time to take it to users for a test run.
5. Test and test again
We previously highlighted that UX research is a crucial elements throughout the entire UX workflow. In the initial phases, it serves to help define your target audience and user problems. In later phases, it helps you validate ideas and gain feedback on your mockups and prototypes. You’ll use this feedback to refine your design until it perfectly matches user needs.
Testing your designs before they go into full development ensures you’re not developing designs nobody wants to use. It’s one of the crucial benefits of investing in UX research , and a key part of any effective UX workflow.
You can use many UX research methods to test whether your design is headed in the right direction, but usability testing methods are typically your go-to for testing design prototypes and wireframes. You can also conduct user interviews and surveys, as these help generate qualitative data to complement the quantitative data you uncover with usability testing.
💡 Testing tip: Can’t decide between two design elements or UIs in your journey, wireframe, or prototype? A/B usability testing lets you test two variations of the same design and then pursue the one your users prefer.
With your new low-fidelity prototype ready for testing, you conduct a usability test. You ask users to find the courses they’re enrolled in from the dashboard. They’re able to find some of them, but not all of them.
Many of your testers are enrolled in several courses, but the dashboard only has enough space to display three at a time and there’s no clear way to access the rest. Users need a clear overview of their courses and a way to click through to see all courses. One user in an interview also mentions pre-filled search suggestions based on recent course activity. You add this to your feature request backlog to come back to.
6. Design iteration and final touches
This is where your UX workflow might flit back and forth between designing and testing. Creating stellar products and user experiences requires constant testing, iterating, testing, analysis, iterating again.
Think of this as a smaller, cyclical process within the larger UX workflow. Ensure your UX workflow includes a specific process for iterating your designs based on user feedback. This might be lean UX or the double diamond —there’s a whole range of UX frameworks out there.
The process of designing, testing, and iterating is the core principle of lean UX. This approach acknowledges that first product mockups will always fail to deliver user needs. Instead, design teams create a prototype, focus on getting feedback, and then make changes based on insights.

After you’ve identified specific friction points through further testing, you can implement potential solutions into your design. For user flows or wireframes, this might be changing the information architecture to fit users’ intuitions and expectations (known as mental models ).
Data-backed iterations drive your design forward from low-fidelity basic user flows to high-fidelity, interactive prototypes.
Once you’ve got your insights, it’s crucial to structure and categorize them efficiently, to ensure nothing is missed. Techniques like affinity diagrams can help organize your data, and you can utilize software like Dovetail or project management platforms to keep track of every piece of data.
I use analytics to first understand and dissect the feedback, from there I create tickets in a project management platform for each piece of feedback and then prioritize!
Haley Stracher , UX/UI Designer and CEO of Iris Design Collaborative
After feedback from testing, you go turn your low-fidelity prototype and into an adaptive design element. The dashboard becomes larger or smaller depending on the information presented—and a horizontal scroll feature appears when a user is enrolled in more than six courses. You also add a button to ‘See all courses’ so users can easily access a complete page with all course information.
At this point, you also include a functional search bar. Your prototype is gradually looking more and more finished. You send out your developed prototype for testing and discover users have issues with the order of search results. You iterate the search function, perfecting it until users are happy.
7. Design hand-off and development
This is the final stage in your UX workflow. It’s where you establish how you’ll handle distributing findings with other departments. Sometimes this is to inform them of your work, or it may be because they’re the next step in the process—the development team, for example.
The hand-off is a finishing stage, but preparation starts earlier within the design workflow . When you establish how you’ll be documenting your research, insights, and designs—as we discussed in Step 2—you’re doing it to facilitate this stage of the UX workflow.
Here’s a checklist of some deliverables you need to develop for this stage of the UX workflow:
☑️ Design documentation and notes: A PDF document of the design, explaining key elements, making it understandable for developers ☑️ Mockups, wireframes, and prototypes: Showing the general layout and functionality of the design ☑️ User flow diagrams: To help developers understand the sequence and path users will take through the finalized product ☑️ Asset files: Containing all the visual assets you’ve collected through the workflow like logos, icons, images, and more ☑️ Accessibility guidelines: To help developers understand and apply accessibility standards throughout the development process ☑️ Project hand-off document: A detailed summary explaining the project scope as well as any contextual information designers need to know for a smooth development process
Keep in mind that each developer team may have different needs depending on your organizational policies and product. Keep in contact with your development team throughout your UX workflow and ask what they’ll need for a smooth hand-off to minimize delays.
You should also conduct visual design hygiene to ensure your assets, files, and designs are neat, making them easy for your development team to use. Some visual design hygiene best practices are:
- Grouping and naming your files based on UI functions
- Using a standard naming protocol for files
- Deleting all unused layers in your design
- Only hand off files that developers will need
Haley emphasizes design hand-off as a collaborative effort between developers and designers:
“Design hand-off is a collaborative effort. There’s a lot of progress with Figma and other UI/UX design systems to improve hand-off, but typically detailed and thorough notes, as well as screen-by-screen interaction, are the best way to show developers the exact interaction. It’s also essential to have regular scheduled meetings with development teams to ensure everyone’s understanding, then following up through project management tickets for each item you’ve sent to developers.”
Congratulations! After five rounds of usability testing, you’ve perfected the Learn&Go dashboard. You’re ready to hand off your design to the development team for launch. You’ve included comprehensive documentation and an in-depth report to summarize the design and make the process smoother. All that’s left now is for the development team to bring the design to life.
They seamlessly develop and deploy the solution you’ve created, and the optimized design is live in Learn&Go.
8. Post-launch analysis and reporting
Okay, we told a white-lie. This is the final part of any good UX workflow: analyzing and reporting on your success—both in terms of user satisfaction, and the goals you set before commencing your UX research project.
You won’t be able to assess success straight away. You need to let enough time pass for users to adjust to new designs, and even more time before you can begin assessing business and UX research impact . Nonetheless, preparing a standardized approach to monitoring the success of your UX projects is a key part of your UX workflow.
Once your update dashboard has been live for a month, you connect with users to discuss their thoughts on it. Ideally, you connect with the same users you surveyed previously. Tools like Maze Panel and Reach enable you to build your own participant management system to facilitate just that.
You ask them similar questions to the ones you did at the very beginning of this process. You then compare them to previous answers and find they have significantly fewer issues when it comes to navigating the Learn&Go platform.
Six months after the dashboard redesign, you check in on retention metrics to find that user retention has increased by 10%. This is a huge win—congrats!
Breeze through your UX research workflow with Maze
Having an effective UX workflow ensures your UX research projects follow a standardized, structured approach. It’s the difference between messy, disorganized research projects and seamless studies that help you create better products and user experiences.
Throughout a UX workflow, you’ll need to conduct multiple rounds of UX research. That’s where a tool like Maze helps, by streamlining your workflow so you can create better designs faster.
Maze is a leading user research platform that enables you to understand what your users really think and feel about your designs. With Maze, you can conduct moderated and unmoderated testing and instantly analyze data for insights. It saves you both time and effort throughout your UX workflow while helping you make data-backed design decisions every step of the way.
Frequently asked questions about UX workflows
What are the five levels of the UX research process?
To obtain better insights and ultimately build user-centric designs, UX researchers frequently use a five-step UX research process:
How do I create a UX workflow?
Creating a UX workflow requires defining your approach to each stage of the UX research, design, and development process. This includes outlining your organization’s approach to:
- Needs, goals, and project scope definition
- UX research process design and methodologies
- Data analysis and insight identification
- User flow, wireframe, and prototype development
- Testing, testing, and more testing
- Design iteration and final touches
- Design hand off and development
- Post-launch analysis and reporting
What is a UX design workflow diagram?
A UX design workflow diagram visually represents the steps to complete a user experience design project. It typically includes various stages of the design process and tasks associated with each stage.
- Usability testing
Run remote usability tests on any digital product to deep dive into your key user flows
- Product analytics
Learn how users are behaving on your website in real time and uncover points of frustration
- Research repository
A tool for collaborative analysis of qualitative data and for building your research repository and database.
- Trymata Blog
How-to articles, expert tips, and the latest news in user testing & user experience
- Knowledge Hub
Detailed explainers of Trymata’s features & plans, and UX research terms & topics
- Plans & Pricing
Get paid to test
- User Experience (UX) testing
- User Interface (UI) testing
- Ecommerce testing
- Remote usability testing
- Plans & Pricing
- Customer Stories
How do you want to use Trymata?
Conduct user testing, desktop usability video.
You’re on a business trip in Oakland, CA. You've been working late in downtown and now you're looking for a place nearby to grab a late dinner. You decided to check Zomato to try and find somewhere to eat. (Don't begin searching yet).
- Look around on the home page. Does anything seem interesting to you?
- How would you go about finding a place to eat near you in Downtown Oakland? You want something kind of quick, open late, not too expensive, and with a good rating.
- What do the reviews say about the restaurant you've chosen?
- What was the most important factor for you in choosing this spot?
- You're currently close to the 19th St Bart station, and it's 9PM. How would you get to this restaurant? Do you think you'll be able to make it before closing time?
- Your friend recommended you to check out a place called Belly while you're in Oakland. Try to find where it is, when it's open, and what kind of food options they have.
- Now go to any restaurant's page and try to leave a review (don't actually submit it).
What was the worst thing about your experience?
It was hard to find the bart station. The collections not being able to be sorted was a bit of a bummer
What other aspects of the experience could be improved?
Feedback from the owners would be nice
What did you like about the website?
The flow was good, lots of bright photos
What other comments do you have for the owner of the website?
I like that you can sort by what you are looking for and i like the idea of collections
You're going on a vacation to Italy next month, and you want to learn some basic Italian for getting around while there. You decided to try Duolingo.
- Please begin by downloading the app to your device.
- Choose Italian and get started with the first lesson (stop once you reach the first question).
- Now go all the way through the rest of the first lesson, describing your thoughts as you go.
- Get your profile set up, then view your account page. What information and options are there? Do you feel that these are useful? Why or why not?
- After a week in Italy, you're going to spend a few days in Austria. How would you take German lessons on Duolingo?
- What other languages does the app offer? Do any of them interest you?
I felt like there could have been a little more of an instructional component to the lesson.
It would be cool if there were some feature that could allow two learners studying the same language to take lessons together. I imagine that their screens would be synced and they could go through lessons together and chat along the way.
Overall, the app was very intuitive to use and visually appealing. I also liked the option to connect with others.
Overall, the app seemed very helpful and easy to use. I feel like it makes learning a new language fun and almost like a game. It would be nice, however, if it contained more of an instructional portion.
All accounts, tests, and data have been migrated to our new & improved system!
Use the same email and password to log in:
Legacy login: Our legacy system is still available in view-only mode, login here >
What’s the new system about? Read more about our transition & what it-->
What is User Research? Definition, Methods, Types and Planning Best Practices

What is User Research?
User research is defined as a systematic and multidisciplinary approach used to understand and empathize with the needs, behaviors, and preferences of a product or service’s end users . It is a critical component of the product development process, helping designers, developers, and businesses create products and services that are user-centered and meet the real needs of their target audience.
One of the primary goals of user research is to inform design decisions and product improvements to deliver better user experience across the user journey map . By engaging with actual users, researchers can uncover critical information about how a product is used, uncover pain points, and identify areas for enhancement.
This iterative process ensures that the end result is more user-friendly and effective. User research can also help companies identify market opportunities, make informed decisions, and prioritize features or design changes based on user feedback and data.
Researchers may assess user attitudes, preferences, and behaviors, ultimately helping product teams understand the context in which their products will be used. As a result, user research is a cornerstone of user-centered design, driving innovation and improving the overall user journey , ultimately leading to more successful and satisfying products and services.
Importance of User Research in the Digital Landscape
User research is of paramount importance in the design and development of products and services for several compelling reasons:
– User-Centered Design: User research places the focus squarely on the end-users, ensuring that products and services are designed with their needs, preferences, and behaviors in mind. This approach leads to user-centered UX design , which results in solutions that are more intuitive, efficient, and satisfying for users.
– Reduced Risk: Investing in user research early in the product development process helps identify potential issues and challenges before they become costly problems. By addressing these concerns proactively, businesses can reduce the risk of developing products that fail to gain user acceptance or market traction.
– Improved Usability: User research helps uncover usability issues and provides actionable insights to improve the user interface and overall user experience. By optimizing usability, organizations can increase user satisfaction and retention while decreasing support and training costs.
– Informed Decision-Making: User research provides data-driven insights that inform decision-making throughout the product lifecycle. It helps prioritize features, validate assumptions, and guide strategic choices, ultimately leading to more successful product development and customer experience strategies .
– Competitive Advantage: Companies that invest in user research gain a competitive edge by delivering products and services that better meet customer expectations and deliver better customer experiences . Users are more likely to choose and recommend products that are designed with their needs in mind.
– Market Relevance: As markets and user preferences evolve, user research helps companies stay in tune with changing trends and emerging needs. It enables organizations to adapt their offerings to remain relevant and competitive in dynamic business environments.
– Customer Satisfaction and Loyalty: By addressing user pain points and incorporating user feedback , organizations can increase customer satisfaction and build loyalty. Satisfied users are much more likely to make more purchases and of higher values.
– Cost Savings: While conducting user research may involve an upfront investment, it can ultimately lead to cost savings by preventing costly design and development mistakes. It also reduces the need for post-launch fixes and redesigns.
– Innovation and Creativity: User research can uncover unmet needs and untapped opportunities, driving innovation and creativity in product development. It encourages businesses to think beyond existing solutions and come up with novel ideas.
Learn more: What is User Journey?
Key Components of User Research
User research is a multifaceted process that involves various components to gain a comprehensive understanding of users and their needs. The key components of user research include:
- Research Goals and Objectives: Defining clear research goals and objectives is essential. What do you want to learn or accomplish through the research? These goals guide the entire research process and help ensure that it remains focused and actionable.
- User Personas: Creating user personas involves developing detailed profiles of different user types or segments based on demographics, behaviors, needs, and goals. Personas help the team empathize with and understand the diversity of potential users.
- Research Methods: User research employs a range of quantitative and qualitative research methods , such as surveys, interviews, usability testing , ethnographic studies, focus groups , and ther respective data analysis. The choice of methods depends on the research goals and the stage of product development.
- Participant Recruitment : Identifying and recruiting participants who represent the target user base is crucial. They should reflect the diversity and characteristics of the actual user population to ensure the research findings are valid and representative.
- Data Collection: During this phase, researchers gather data using selected methods. For instance, interviews and surveys collect quantitative and qualitative data , while usability testing observes users’ interactions with a product or service.
- Data Analysis: Researchers analyze the collected data to extract meaningful insights. This process involves quantitative and qualitative data analysis coding, categorizing, and synthesizing the information to identify patterns, trends, and key findings.
- Insights and Findings: Researchers distill the analysis results into actionable insights and findings. These should answer the research objectives and help inform decision-making.
- User Journey Mapping: Understanding how users interact with a product or service over time is essential. User journey mapping helps visualize the user’s experience, highlighting touchpoints, pain points, and opportunities for improvement.
- Usability Evaluation: Assessing the usability of a product through testing and evaluation helps identify areas that require improvement. Usability issues can significantly impact user satisfaction and adoption.
- Feedback and Iteration: User research often leads to recommendations for design changes or product improvements. Incorporating user feedback and iterating on the design is a critical step to enhance the user experience.
- Reporting and Documentation: Documenting the research process, findings, and recommendations is vital for sharing insights with stakeholders, ensuring transparency, and serving as a reference for future development efforts.
- Communication and Collaboration: Effective communication with cross-functional teams, including designers, developers, and product managers, is essential. Collaboration ensures that research findings are integrated into the product development process.
- Ethical Considerations: Ethical practices in user research involve obtaining informed consent from participants, ensuring data privacy, and maintaining the confidentiality of user information.
- Accessibility and Inclusivity: User research should consider accessibility and inclusivity, ensuring that the research process and products themselves are designed to accommodate a diverse range of users, including those with disabilities.
- Continuous Learning and Improvement: User research is an iterative process. Teams should be open to continuous learning and ongoing improvement, using research insights to enhance products and user experiences over time.
Types of User Research Methods with Examples
Each of the below methods offer a unique approach to understanding users and can be adapted to suit the specific research goals and context of a project. The choice of method depends on what insights are needed and the constraints of the research environment.
Here are the types of user research methods with examples:
1. User Interviews: User interviews involve one-on-one conversations with users to gain deeper insights into their experiences, preferences, and pain points. Open-ended questions are used to encourage participants to share their thoughts and feelings.
Example : Conducting interviews with smartphone users to understand how they use their devices and what features they find most valuable. This can reveal user habits and priorities.
2. Surveys and Questionnaires: Surveys and questionnaires are tools for collecting structured data from a large number of users. They consist of a set of predetermined questions with options for responses, allowing for quantitative analysis.
Example : Sending out a questionnaire to a group of online shoppers to gather data on their satisfaction with a recent e-commerce experience, including rating the checkout process.
3. Usability Testing: Usability testing involves observing users as they interact with a product or prototype. Researchers can identify usability issues, task completion rates, and areas where users struggle or excel.
Example : In case of mobile usability testing , an example would be inviting participants to try out a prototype of a mobile app for a cab service, while researchers observe and note where users encounter difficulties during the cab booking and ride-end process.
4. Contextual Inquiry: Contextual inquiry is an ethnographic method that involves researchers visiting users in their natural environment. It provides a real-world context for understanding how a product fits into users’ daily lives. Example : Researchers visiting a construction site to understand how workers use a mobile app for project management, observing how it helps or hinders their work processes.
5. Card Sorting: Card sorting is a method used to understand how users categorize and organize information. Participants group content or features into categories that make sense to them, helping inform website navigation and information structure.
Example : Asking participants to organize and categorize the various functions and features on a new software application interface to determine the most intuitive layout.
6. Eye-Tracking Studies: Eye-tracking studies involve using specialized equipment to monitor and record where participants look on a webpage, application, or physical product. This method reveals visual attention and engagement patterns.
Example : Tracking users’ eye movements and gaze patterns while they browse an e-commerce website, showing which elements capture their attention and where they focus during the shopping process.
7. A/B Testing: A/B testing involves comparing two or more variations of a product or website to determine which one performs better with users. It’s often used to optimize specific elements, such as the layout of a webpage or the wording of a call-to-action.
Example : Testing two different homepage designs for an e-commerce site by randomly showing one version to half the visitors and the other version to the remaining half.
8. Field Studies: Field studies involve researchers immersing themselves in the user’s environment to gain a deep understanding of their behaviors, needs, and challenges. It’s often used to investigate long-term use of a product or service. Example : Spending time with healthcare professionals in a hospital to understand how they use electronic health record systems throughout their daily routines, identifying workflow improvements.
9. Diary Studies: Diary studies require participants to keep a diary or journal of their experiences and interactions with a product or service over a specified period. Example : Participants documenting their experiences with a fitness tracking app over a month, recording daily activities, goals, and any frustrations or successes.
10. Remote Usability Testing: Similar to usability testing, remote usability testing involves users interacting with a product or prototype, but it is conducted remotely, often via screen-sharing or video conferencing tools.
Example : Participants from various locations testing a new software application by sharing their screens with researchers, who observe and guide them through tasks.
11. Card Sorting with Tree Testing: This combines card sorting with tree testing. It first asks participants to categorize items, and then it tests their ability to find items within the categories on a well-defined menu structure. Example : Having users categorize and then find specific items in an online retail store by navigating through the product categories and subcategories.
12. Cognitive Walkthrough: In cognitive walkthroughs, researchers assess a product’s usability by walking through it from the user’s perspective, considering how users might think and make decisions at each step.
Example : Evaluating a mobile app’s onboarding process by step-by-step analysis to determine whether users can easily understand and complete the registration.
13. Heatmaps and Click Tracking: Heatmaps and click tracking tools collect data on where users click and how they move their cursors on a webpage. This provides insights into which elements attract attention and engagement. Example : Analyzing heatmaps to see which areas of a website receive the most clicks, indicating which sections or buttons are most popular with users.
Learn more: What is User Experience (UX) Optimization?
Potential Challenges Faced in User Research
User research, while highly valuable, can present various challenges that researchers and organizations need to address. Some of the potential challenges faced in user research include:
– Recruitment Issues: Finding and recruiting suitable participants can be challenging. It may be difficult to locate users who represent the target audience, especially in niche markets or with specific requirements.
– Participant Bias: Participants may alter their behavior or responses during research sessions, known as the Hawthorne effect, which can lead to data that doesn’t accurately reflect their typical interactions with a product.
– Time Constraints: User research often competes with tight project deadlines, which can compromise the thoroughness of research or lead to rushed decision-making.
– Sample Size and Diversity: Small sample sizes may not adequately represent the diversity of users, leading to findings that aren’t generalizable. Achieving diversity among participants can be a challenge, too.
– Emotional and Subjective Responses: Users’ responses can be influenced by emotions, making it difficult to separate personal opinions from actionable insights. Researchers must navigate subjectivity.
– Recall Bias: Users may not accurately remember or describe their experiences, which can affect the quality of the data collected during interviews or surveys.
To address these challenges, it’s important for researchers to plan thoroughly, remain adaptable, and continually refine their research methods. Overcoming these obstacles ensures that user research provides accurate, actionable insights for improved product design and user experiences.
Related: What is User Experience (UX) Research?
User Research Planning: Key Steps
Effective user research planning is essential for gathering valuable insights and ensuring that research efforts are well-organized and productive. Here are the key steps in planning user research:
1. Define Clear Objectives:
Begin by clearly defining the research objectives. What specific questions do you want to answer or problems do you want to address through the research? Ensure that your objectives are specific, measurable, and actionable.
2. Identify Target Users:
Determine the user personas you want to study. Understand who your primary and secondary user segments are and the specific characteristics that define them.
3. Select Research Methods:
Choose the most appropriate research methods based on your objectives and the characteristics of your target users.
4. Create a Research Plan:
Develop a detailed research plan that outlines the scope, timeline, and resources needed for the research. Specify the number of participants, the research team, and any tools or equipment required.
5. Recruit Participants:
Identify and recruit participants who match the criteria for your study. Ensure diversity among participants to gather a representative sample. Consider using recruitment agencies or online panels if necessary.
6. Design Research Materials:
Prepare research materials such as interview scripts, surveys, prototypes, or test scenarios. Ensure that these materials align with your research objectives and the chosen methods.
7. Pilot Testing:
Before conducting the main research, perform pilot testing to identify any issues with your research materials and process. This step helps fine-tune your approach and ensures that the research runs smoothly.
8. Data Collection:
Conduct the research sessions, whether they involve user interviews , surveys, usability testing , or other methods. Ensure that you capture data thoroughly and consistently.
10. Data Analysis:
Analyze the collected data to extract meaningful insights. This involves coding, categorizing, and synthesizing the information to identify patterns and key findings.
11. Generate Insights:
Transform your analyzed data into actionable insights. Summarize the findings in a way that is understandable and relevant to stakeholders.
12. Reporting and Documentation:
Create a comprehensive research report that includes an executive summary, research objectives, methodology, findings, recommendations, and any supporting data. Document the process for future reference.
13. Share Insights and Recommendations:
Present the research findings to relevant stakeholders, such as designers, developers, product managers, and executives. Collaborate on how to incorporate the insights into product development.
14. Iterate and Follow-Up:
Encourage an iterative approach to user research. After making improvements based on the research findings, consider conducting follow-up research to verify the impact of changes.
15. Ethical Considerations:
Obtain informed consent from participants, protect their privacy, and maintain data security.
16. Budget and Resource Management:
Manage the budget and resources for the research, ensuring that you have the necessary funds and tools to carry out the plan effectively.
17. Flexibility and Adaptation:
Be prepared to adjust your research plan as needed. Unexpected issues or new findings may require adaptations to your approach.
Learn more: 20 Essential User Interview Questions
Interested in learning more about the fields of product, research, and design? Search our articles here for helpful information spanning a wide range of topics!
Usability Testing Questions for Improving User’s Experience
14 best performance testing tools for application reliability, a complete guide to usability testing methods for better ux, ux mapping methods and how to create effective maps.
Verifying that you are not a robot...
Sandeep Kashyap
From chaos to clarity: A detailed guide to workflow analysis

Introduction
Workflow analysis is a process of evaluating and improving the sequence of tasks, activities, and interactions that make up a particular business process or operation within an organization.
This analysis aims to gain a detailed understanding of how work is performed within an organization, identifying areas where processes can be streamlined, automated, or optimized to achieve better outcomes.
Why do companies perform a workflow analysis?
Now you must be thinking why do companies perform a work-flow analysis and what are the necessities of doing it?
The ultimate goal of performing workflow analysis is to identify inefficiencies, bottlenecks, and areas for improvement in the workflow.
By identifying these issues, companies can work towards streamlining the workflow, eliminating manual processes, and automating a solid workflow. The result is more efficient, productive, and cost-effective business process management.
When performing a workflow analysis, organizations typically assess various aspects of the workflow, such as,
- Process adherence and potential problems
- Time and labor required for tasks
- Rules governing the workflow
- User interactions with tools
- Incidence of errors, delays, miscommunications, and roadblocks
- Fringe cases or unaccounted scenarios
What are the benefits of workflow analysis for businesses?
From resource allocation to better decision-making, analyzing a workflow can benefit you and your team in many more ways.
Here are some benefits of business workflow analysis:

1. Increased efficiency and productivity
62% of businesses have identified three or more inefficiencies or bottlenecks in their processes that can be solved with effective workflow automation.
Analyzing your workflow enables you to identify these inefficiencies or bottlenecks and streamline processes.
By optimizing the sequence of tasks and eliminating unnecessary steps, teams can work more efficiently, leading to increased productivity.
2. Improved communication and collaboration
Who wants to struggle with miscommunications and lack of collaboration in a team or organization?
If your employees are giving their best, still projects are getting delayed , they only end up getting frustrated.
Workflow analysis can help you understand the flow of information and tasks within a project or department. By doing so, you can identify areas where communication and collaboration may be breaking down.
Once you know where the issues lie, you can make adjustments to your communication processes. You can add team members to relevant distribution lists or invite them to important meetings.
This fosters better communication and collaboration, keeping your team informed about progress.
3. Reduced errors and rework
Through workflow analysis, you can identify potential points of failure in a process and implement preventive measures to minimize errors.
These errors can be anything from simple typos to more complex mistakes that can have serious consequences.
Identifying and addressing these errors early on reduces the need for rework, saving time and resources in the long run.
4. Enhanced decision-making and resource allocation
By analyzing your organization’s workflow, you can gain a better understanding of how everyone is using the provided resources and where there may be problems or inefficiencies.
Armed with this information, you can make informed decisions about resource allocation, ensuring that the right people and tools are available when needed.
5. Increased customer satisfaction
By streamlining workflows and improving efficiency, you can deliver projects on time and with higher quality.
This not only helps deliver projects on time but can also exceed customer expectations, leading to increased satisfaction and potentially fostering long-term client relationships.
Effortlessly plan tasks, collaborate seamlessly with your team, organize files efficiently, and deliver projects on time – all within a single platform!
Workflow analysis methods
Several methods are available that you can use to streamline your business processes. These methods offer different ways to examine, visualize, and assess workflows to recognize areas of inefficiencies and possibilities for enhancement.
Here are some of the well-known workflow analysis methods:

1. Time and motion studies
Time and motion studies observe and analyze how employees perform tasks to identify any time-consuming steps.
This method aims to streamline processes and boost efficiency by eliminating unnecessary tasks.
2. Flowcharting
It is a simple visual representation that uses standardized symbols to visually represent the sequence of tasks and decisions in a workflow.
Flowcharting helps you understand process structure, and identify issues, and areas for improvement.
3. Kaizen events
It is a short-term and targeted improvement method that provides a structured framework for teams to address specific issues or inefficiencies in a workflow.
A kaizen event promotes continuous improvement by quickly implementing changes and solutions.
4. Business process mapping
Business process mapping is a detailed form of flowchart that represents relationships between different tasks, subtasks, and resources in a process.
It identifies inefficiencies, redundancies, and opportunities for optimization.
5. Swimlane diagrams
Swimlane diagrams are process maps that organize tasks into different “lanes” based on responsible functions, departments, or roles.
They clarify responsibilities, identify handoffs, and uncover communication or coordination issues.
6. Process mining
This method is based on data that uses event logs like start date or due date to analyze, track, and improve business processes.
It lets you uncover hidden patterns, identify problems, and optimize process performance.
7. Program evaluation and review technique (PERT) chart
PERT chart is a network diagram that analyzes the time it will take to complete each task in a process. It helps you understand all possible workflows and choose the most efficient workflow.
It is useful for planning, scheduling, and optimizing complex projects.
8. Work sampling
Work sampling is a technique that helps you estimate the time spent on different tasks or activities within a workflow.
It identifies patterns, inefficiencies, and improvement opportunities by collecting random samples of work over a period.
Organize, manage, and collaborate seamlessly with ProofHub – All-in-one solution for projects, tasks, and teams
What are the steps in workflow analysis?
The steps involved in workflow analysis vary depending on the specific needs and goals of the business.
Here is a general six-step plan you can adapt or modify according to your requirements.

Step 1: Identify the workflow
The initial step towards analyzing your workflow is to select a clear and well-defined workflow to focus on.
It can be a specific content creation process, a customer onboarding process, a product development cycle, or even just a part of a larger workflow.
Step 2: Gather information
After selecting a workflow, observe the workflow in action, and review any existing documentation to understand the current state of the workflow. Look for data on cycle times, error rates, and resource utilization.
There is no doubt, you are highly skilled but that doesn’t mean you know everything that’s going on. Ask questions from actual users to understand the pain points, challenges, and opportunities for improvement.
Step 3: Visualize the workflow
Next step is to create a visual representation of the workflow, such as a flowchart or process map. This will help you see the big picture and identify any potential bottlenecks or inefficiencies.
You can also break the workflow down into individual steps or tasks. This will make it easier to analyze and identify areas for improvement.
Step 4: Analyze the workflow
Now that you have an outline of the process, identify any steps or tasks that are slowing down the workflow. These can be tasks that are taking too long, require too much manual effort, or have too many handoffs between different people or teams.
Additionally, you should search for areas where the workflow is not using resources efficiently. Look for any repetitive tasks that your employees are spending their time on unnecessarily. You can automate or eliminate these tasks using a workflow automation tool.
Identify any potential risks associated with the workflow, such as compliance issues or security vulnerabilities.
Step 5: Develop solutions
Once you’ve identified the problems, come up with some potential solutions.
You should understand that not all improvements are equally beneficial. You should prioritize the changes that will have the most significant impact on the workflow’s performance.
Create a plan for implementing your improvements. This should include a timeline, budget, and resources.
Step 6: Monitor and evaluate
After you are done with the modifications, track their impact on the workflow. This will help you determine if you are moving in the right direction and allow you to make any necessary changes.
You should also communicate with the individuals involved in the workflow to get their feedback on the modifications. This will help you identify any unintended consequences and make sure that the improvements are working.
Example of workflow analysis
An effective workflow makes sure that you complete your tasks efficiently. However, to enhance your workflow, you need to analyze it.
For example, let’s take a look at the content creation process . Without a good workflow, content creation can become disorganized and overwhelming.
You may have multiple drafts scattered across different platforms, feedback from other team members in different email threads, and version control can become a mess.
You can identify these issues by analyzing your workflow and can create a more streamlined process by defining clear roles and responsibilities for each team member. Have a centralized location for all drafts and feedback. Also, set up a transparent version control system. This will result in better collaboration, consistent quality, and fewer missed deadlines .
You can also use a workflow management tool to simplify your process. A workflow management tool can help you through the content creation process from start to finish, keeping everything organized and on track.
What tool should you use for workflow management?
According to Gartner, spending on hyper-automation software technologies will exceed $720 billion .
A good workflow automation software like ProofHub allows you to create, optimize, and automate workflows . It offers robust features such as easy task management , real-time collaboration , and streamlined processes.
The main reason businesses go for a workflow management system is to overcome the challenges faced by manual processes, such as human error, delays, and inefficiencies.
What factors to consider in a workflow management tool?
You should use a workflow management tool for your business that adapts to changes, allowing you to manage work efficiently and enhance overall productivity.
There are a few factors that you need to consider in a workflow management tool for managing workflows successfully:
- Scalability: As the business grows, the business requirements also increase proportionally. The tool must be able to scale up to growing business needs.
- Cloud-based operability: Cloud-based workflow management tools allow you to work from anywhere and improve collaboration among team members.
- Ease of use: The tool should be easy to use with a user-friendly interface that requires minimal training for its usage.
- Customizable workflows: Every business has unique workflows. The tool must enable you to create workflows that reflect your business processes and automate tasks.
- Integration with third-party applications: The tool should be able to integrate seamlessly with third-party tools and apps used by businesses in their day-to-day operations. Integration enables uninterrupted data exchange and improves overall business efficiency.
- Compatibility with existing systems: The tool should be compatible with your existing systems and technology infrastructure. It should not require significant changes to be made to your current setup.
- Data analytics and real-time reporting: The tool should enable you to monitor workflow performance and identify areas for improvement. This information can help you make data-driven decisions and optimize your workflows.
Take control of your projects with ProofHub: Track, manage, and prioritize tasks effortlessly in one centralized platform!
Conclusion
Workflow analysis helps you increase productivity, reduce costs, and improve overall business processes. We all have realized the benefits of workflow analysis in work management. The only thing is how effectively we can analyze the process.
With a thorough and effective workflow analysis, organizations can achieve better results, increase efficiency, and ensure timely delivery of projects. Tools like ProofHub play a crucial role in this process by providing comprehensive features for visualizing, tracking, and optimizing workflows.
I hope the above guide provides you with all the information you need to analyze your business processes and improve workflow.
Related articles
- 9 Workflow examples to bring order to your business processes
- Workflow management system: Key features, benefits, & examples
- Mastering workflow management: Systems, best practices & challenges
- What is workflow automation: A detailed guide
- 22 Best workflow management software for streamlining your business
- Top 11 workflow automation software for 2024
What is a key output of workflow analysis?
Workflow analysis provides a comprehensive understanding of processes, identifying inefficiencies, bottlenecks, and areas for improvement. This leads to optimized workflows and enhanced organizational efficiency.
What are the common challenges in workflow analysis?
When analyzing workflows, common challenges that you may face are identifying bottlenecks, comprehending complex processes, obtaining accurate data, adapting to changes, ensuring stakeholder collaboration, and selecting appropriate analysis tools.
How often should a workflow analysis be conducted?
You should conduct a workflow analysis regularly, typically annually, or whenever significant changes occur. The frequency ensures that processes remain efficient, adaptable, and aligned with organizational goals and industry standards.
What are the elements of workflow analysis?
There are a few key elements that you need to consider for conducting a thorough and effective workflow analysis.
1. Create a clear step-by-step guide
Outline each step required to complete your workflow from start to finish. Create a visual decision tree to easily visualize the process.
2. Estimate the time needed for each step
Assess how much time you need to complete each task. Compare these calculations with the actual time each task takes. If time data is not available, start recording to track the duration of each step accurately.
3. Evaluate the cost of each step
Analyze the total cost of each step in your workflow, including all materials and labor expenses. Is the cost unexpectedly high for the value of the task?
4. Remove redundancies
Identify and remove any step that does not contribute significantly to your end goal or that repeats the efforts of any other steps unnecessarily.
5. Optimize the workflow
Transform and automate parts of your workflow to enhance efficiency. Recognize bottlenecks and implement innovative systems to streamline processes.
What are the different types of workflow analysis?
There are three types of workflow analysis: linear, cross-functional, and hybrid. Linear analyses processes step by step, cross-functional involves multiple departments within an organization, and hybrid combines elements of both.

- Share on LinkedIn
- Email this Page
- Share on Facebook
- Share on WhatsApp
Try ProofHub, our powerful project management and team collaboration software, for free !
No per user fee. No credit card required. Cancel anytime.
.webp)
The Ultimate List of User Research Tools for 2022 and Beyond

Google Chrome will stop using third-party cookies by the end of 2024 , as Google announced recently.
This delay gives you extra time to prepare yourself for gathering customer data in a different way than small files stored within web browsers.
Here's a sneak peek at the ultimate list of User Research Tools for 2022 (and years to come).
User research surveys
You can develop surveys in less time than other data collection methods, and they provide incredibly helpful information thanks to their many use cases.
Open-ended questions, in-product surveys , and rating scales give you options for researching your user experience.
The most popular tools for creating surveys include Survicate, Qualaroo, and Maze. Here is how they stack up against each other.

#1 Survicate
Is there a way to gather customer data whenever they contact your brand? As soon as your customer makes a purchase, interacts with your app, or performs any other activity?
Survicate is a tool that can help you with that. And much more than that. For example, you can easily embed surveys to the website , create email campaigns that include an embedded short question, send follow-up emails with surveys after the purchase – and get the most accurate answers from your customers when they think about you at that moment.
Using this survey builder, you can create guided surveys intuitively without getting stuck. Survicate provides many handy and well-designed survey templates you can use immediately.
Best rated features
- Regardless of the plan you choose, there is no limit to the number of responses.
- Expert-designed survey templates (NPS, CSAT, CES, and many others)
- Guided visual editor for surveys that is easy to understand and master
- Customized survey paths based on answers
- Rule-based notifications (get notified about the answer via Slack)
- Seamless integrations with, e.g., HubSpot , Intercom , and Mailchimp to create a powerful toolbox for thorough user research
- A simple way to export data to your CRM, Google Sheets, or XLS
Get ready to dive into the world of customer feedback analysis with Survicate. Sign up for a free account and enjoy a 10-day trial with access to essential features. Don't forget to review our pricing . Paid plans start at just $53/mo.
YOU MAY BE INTERESTED IN: After scenario questionnaire survey template.
Maze is a basic survey builder with some features intended for conducting behavioral analysis. It's a stable choice, but it won't give you a wide array of choices for collecting feedback.

As a design and usability testing software, it leaves much to be improved. The pre-built template questions can’t be excessively customized – you can’t, for example, choose from multiple questions and survey formats. So from a technological point of view, it wouldn’t be a complex solution.
The free and lower-tier plans are pretty limited – many features are locked behind a paywall. Maze templates aren't also available in the cheapest plan. Access to custom designs requires upgrading your plan, making it unnecessary for small businesses that don't need all the features.
- Heatmaps, click trails, and screen recordings to see how users behave
- Smart reporting that automatically generates visually dynamic reports
- Tests sharing via links
- Assignment of team roles to streamline the workflow
Maze offers three plans - Free, suitable for individual purposes (limited to 25 responses), Professional (for $99 per month), and Organization plan. This one is suitable for more advanced research; the pricing is variable.
✅Yes, Maze provides a free plan, but it’s limited to 25 responses and doesn’t provide custom templates. Also, you’ll quickly run out of responses, as 25 isn’t a lot.
#3 Typeform
The Typeform survey software is one of the most popular choices, so we decided to take a closer look at it. The verdict? The Typeform experience has been positive, but it is not without flaws.

Although simple, creating more complex surveys with Typeform can be a headache. The tool lags as soon as the form begins to be longer than a few questions. There is also some user interface (UI) limitations – exporting data and creating reports can be challenging.
But still, it’s worth noting that Typeform provides quite an extensive number of product survey templates that are aesthetically pleasing. There are many to choose from; they are interactive, simple, and easy to implement. This is a suitable choice for basic user research, but not more than that.
- Automation of creating paths for future workflow
- Converting existing forms into the system
- Clear, simple survey templates, easy to create
Typeform prices start at $25 for the Basic plan (limited to 100 responses per month). The Plus plan costs $55 per month, and the highest, suitable for more advanced research – is $89 per month.
✅Yes, Typeform provides a free plan.
User interviews
How to interview your users in a remote setting? Because of the pandemic, this user research method has become widely used, and you’ll see all sorts of companies using them to collect customer feedback.
However, doing them right takes time and lots of preparation. Some tools can help you with it, such as MagnoliaHQ or User Interviews. What if we told you we found alternatives?
#4 UserZoom
UserZoom is like Zoom, but geared more toward business purposes. It gives you the ability to conduct thorough user interviews with help to accelerate and scale UX research practices at the same time.

It’s a tool that can gather detailed information about the users and easily share those data directly from the platform to your stakeholders. What’s more, UserZoom equips UX researchers with a learning platform that they can use to create better digital experiences.
However, it can be somewhat challenging in international research, especially when the respondents' language isn't English. Still, it's an excellent tool for research projects, letting you collect insights without spending hours interviewing and recruiting users.
- A/B testing to create two forms of action and gauge which one is more effective
- Session scheduler for setting your availability preferences and letting participants choose a time that's convenient for them
- Automated transcription of recorded sessions
- Video highlights without requiring external video editing software
- Note-taking during the session, synced to playback
The vendor does not provide pricing on their website. However, several sources claim that their monthly plans start at $5,000.
⛔️No, UserZoom does not provide a free plan.

#5 Lookback
With Lookback , a simple-to-use interview software, you can gather user insights and turn them into actions. You can do unmoderated user research using any device through a single link.

Overall, this tool has a good user experience. You can easily set up a sequence of tasks for your participants to follow and make notes during the conversations. In addition, a straightforward interface makes organizing all your gathered data easy.
There are, however, many complaints about frequent bugs and errors occurring during sessions. A drop in connection can cause the data not to be saved.
- Virtual Observation Rooms, timestamped notes, team chat, shared insights
- Touch indicators on taps and gestures
- Highlight reels and transcriptions
- Cloud recording that lets all sessions be stored online
- One-link conversation participation
- Availability on all devices
Lookback offers four monthly plans starting at $25 and going up to $344. There is also the Enterprise plan available that provides a dedicated Compatibility Support Module (CSM).
⛔️No, Lookback does not provide a free plan. However, there is a 60-day free trial available.
Researcher-specific features make dscout ideal for conducting user interviews. You can be “live” anywhere and follow your user when they navigate your website and shop via the app to be truly in context.

If you’re looking for users for one-to-one meetings, dscout provides a platform with 100,000+ engaged participants. You can evaluate them by their photos, videos, and open answer responses to choose the most accurate ready scouts.
However, it is limited in some ways. Research is restricted to only one picture and video per entry, and video submissions cannot exceed two minutes.
- Isolating clips to cut right to the moments that matter
- Vendor-provided database of respondents
- Actionable data analytics
- Tools for tagging, storing, and searching customer responses
The vendor provides subscription plans – Researcher, Team, and Enterprise. They differ in the number of seats, support hours, and features available. Detailed pricing information is unavailable, but their team can provide an estimate and demo upon request.
⛔️No, dscout does not provide a free plan.
Insights repositories
Is your team using insights repositories to store and share findings? If not, you're missing out on a powerful tool that can streamline your team's work.
A user research insight repository is a place to store all the data gathered during user research. Such tools as Dovetail, Userbit, and EnjoyHQ, make it easy for team members to find and share user insights, which can help them work more quickly and effectively.
What insight repositories are worth considering in the coming years?
#7 Reframer
Reframer is a qualitative research assistant – it stores all notes, observations, and research data in one place, making it easier to uncover its meaning.

With its clutter-free interface, you can concentrate on the essential things and streamline the journey to understanding your users. In addition, you can enhance this tool with other options (such as card sorting or tree testing) to provide end-to-end workflow within one platform.
This insight repository eliminates spreadsheets and other redundant documents and simplifies team collaboration during user research.
- Distraction-free interface
- Recap of the captured information
- Building themes to spot patterns in the observations
- Analyzing findings with artificial intelligence
Pro is the most popular Reframer plan choice ($249 per month for one user). A custom Enterprise plan is available if you want to make UX research an integral part of the entire organization.
✅Yes, Reframer provides a free plan.
User analytics
By tracking user behavior, you can determine what's working and what isn't, identify pain points, and make necessary changes to improve your site or app.
While many user analytics tools are available, such as Mixpanel, Amplitude, or Smartlook, not all are suitable for the same purposes.
The following are our top picks in this category.
#8 Userlytics
Userlytics is a user research platform for gathering UX insights. With its easy-to-follow onboarding process and training system, this solution stands out from other products available on the market.

It gives all the necessary tools to conduct your user research and can guide you through every step of the way, making it an enjoyable tool.
Moreover, this platform provides access to over 1.5 million people who can participate in your research.
- AI-based audio transcriptions
- Unlimited storage of study results and metrics
- Preliminary study questions to filter out participants who don’t meet target demographics
- Prototype testing in any stage of development
- Analysis and reports with clear takeaways and actionable steps
Userlytics pricing is complicated. You have access to the Enterprise Pricing Calculator, which helps determine how much you can spend on features. You can also select preferred features and customize the plan to your needs.
⛔️No, Userlytics does not provide a free plan.
A popular feature of Hotjar is its heatmaps, which show where people click, scroll on, and move on the website. It provides a visual way to see how users behave and what you can do to improve their experience.

As well as for tracking user actions, Hotjar is also a great tool for wide-ranging analytics to get a deep understanding of your users. It can also be integrated with many other tools (such as Zapier and Google Analytics) to enhance collaboration and overall team workflow.
Just as with any other tool, it has some pitfalls. It’s not always user-friendly, and the interface might be overwhelming, especially for beginners in this field.
- Heatmaps to visualize user behavior
- Session recordings to map the entire user journey
- A comparison of desktop, mobile, and tablet experiences
- Setting up heatmaps is easy (all you need to do is add just one script to your website)
There are three Hotjar plans available. They vary between $39 to $99 per month, depending on the daily sessions you want to monitor. A scale plan is also provided.
✅Yes, Hotjar provides a free plan.
Find your perfect match
With all the tools listed above, you should have no problem finding the one that meets all your needs. We strongly believe that your perfect user research fit is among them.
Take steps to maximize your product potential, and start by doing user research with the right tool right from the start. Go the extra mile with Survicate and sign up for a free trial today! Also, you can foster your decision-making by checking our newest ranking of best website satisfaction tools .

We’re also there
Workflow Analysis Explained – Methods, Steps & Tools
Kazyna turdibayeva july 17, 2024 workflow automation.

Table of Contents
What is workflow analysis?
Workflow analysis is the process of studying, understanding, and evaluating the sequence of tasks, activities, and interactions that make up a specific business process or operation within an organization.
The primary goal of workflow analysis is to identify inefficiencies, bottlenecks, redundancies, and areas for improvement in the workflow, ultimately leading to increased efficiency, productivity, and cost savings.

Workflow analysis methods
Several popular workflow analysis methods can help organizations understand and optimize their business processes. These methods provide different approaches to studying, visualizing, and evaluating workflows to identify inefficiencies and opportunities for improvement. Some popular workflow analysis methods include:
- Flowcharting. Flowcharts are simple visual representations of the sequence of tasks and decisions within a workflow. They use standardized symbols to represent different types of tasks, decisions, and flow directions. Flowcharts can help stakeholders understand the process structure and identify bottlenecks or areas for improvement.
- Business process mapping. Process mapping is a more detailed form of flowcharting, which documents the relationships between different tasks, subprocesses, resources, and information within a process. It can help identify inefficiencies, redundancies, and areas for streamlining or optimization.
- Value stream mapping. Value stream mapping is a lean management technique used to analyze and optimize workflows by focusing on the flow of value through the process. It identifies value-adding and non-value-adding activities, helping organizations eliminate waste and improve overall process efficiency.
- Swimlane diagrams. Swimlane diagrams are a type of process map that organizes tasks and activities into distinct “lanes” based on the responsible function, department, or role. This helps to clarify responsibilities, identify handoffs or dependencies between different groups, and uncover potential communication or coordination issues.
- Process mining. Process mining is a data-driven workflow analysis method that uses event logs generated by various systems, such as ERP, CRM, or BPM platforms, to discover, analyze, and improve business processes. It can help organizations uncover hidden patterns, identify bottlenecks, and optimize process performance.
- Time and motion studies. Time and motion studies involve observing and measuring the time required to perform tasks within a workflow, identifying inefficiencies, and suggesting improvements. This method is particularly useful for analyzing manual or labor-intensive processes.
- Work sampling. Work sampling is a statistical technique used to estimate the proportion of time spent on different tasks or activities within a workflow. By collecting random samples of work over a period, analysts can identify patterns, inefficiencies, and opportunities for improvement.
Workflow analysis in 6 steps
You can conduct a business workflow analysis in six core steps.
- Process and workflow discovery: Workflow analysis requires collecting data on various aspects of the process, such as task duration, resource allocation, wait times, and completion rates. This data can be gathered from various sources, such as system logs, employee input, or direct observation.
- Workflow visualization: The first step in workflow analysis is to create a visual representation of the process, typically using flowcharts, process maps, or swimlane diagrams. This helps stakeholders gain a clear understanding of the sequence of tasks, their dependencies, and the overall structure of the workflow.
- Measure and quantify performance: Using the collected data, performance metrics and key performance indicators (KPIs) are calculated to evaluate the efficiency and effectiveness of the workflow. These metrics can include cycle times, throughput, resource utilization, and error rates.
- Identify inefficiencies: Based on the performance metrics and the visual representation of the workflow, analysts can identify inefficiencies, bottlenecks, or redundancies in the process. These issues may include unnecessary steps, delays, excessive resource consumption, or deviations from best practices.
- Provide recommendations for improvement: Once inefficiencies have been identified, recommendations for improvement can be developed. These recommendations may involve streamlining tasks, reallocating resources, automating manual processes, or implementing new technologies to enhance the workflow.
- Implement changes and monitor results: After the recommendations have been developed, they need to be implemented and monitored to ensure their effectiveness. This can involve setting goals, establishing timelines, assigning responsibilities, and tracking progress. Regular monitoring and adjustments may be necessary to ensure that the workflow improvements deliver the desired results.
Workflow Analysis Tools
Workflow analysis tools are designed to help organizations visualize, analyze, and improve their business workflows. These tools allow businesses to identify inefficiencies, streamline operations, and automate manual tasks. Here are some of the top workflow analysis tools:
- ProcessMaker: PM is a no-code business process automation software designed especially for workflow analysis in digital business operations. Its process intelligence capabilities provide a 360° view into an organization’s processes and workflows, helping them improve operational efficiency and customer engagement.
- Nintex: Nintex is a versatile workflow automation and process management solution that enables organizations to create, manage, and optimize workflows across various systems and departments. With its wide range of features, Nintex simplifies the process of designing and implementing workflows, helping businesses improve efficiency and productivity.
- Kissflow: Kissflow is a cloud-based workflow automation and business process management platform that allows organizations to streamline their processes through customizable workflows, forms, and reports. With its intuitive drag-and-drop interface, Kissflow makes it easy for users to create and modify workflows, even without technical expertise.
- Trello: Trello is a popular project management and workflow visualization tool that uses boards, lists, and cards to help teams collaborate and organize their work. Trello’s flexibility and customization options make it a suitable choice for managing workflows across various industries and use cases.
- Asana: Asana is a project management and work tracking platform that enables teams to plan, organize, and manage workflows effectively. With its robust feature set, Asana helps organizations streamline their workflows, improve collaboration, and stay on track with their goals.
- Wrike: Wrike is a collaborative work management platform that offers workflow automation and visualization features. With its customizable dashboards, Wrike enables organizations to gain insights into their workflows, track progress, and make data-driven decisions.
- Zapier: Zapier is an automation platform that connects different apps and services, allowing users to create automated workflows between them. By automating repetitive tasks and integrating various tools, Zapier helps businesses streamline their workflows and increase efficiency.
- Flow: Microsoft Flow, now called Power Automate, is a cloud-based service that enables users to create and automate workflows across multiple applications and services. With its extensive library of connectors, Flow allows organizations to automate tasks and processes, improving efficiency and reducing manual effort.
- Airtable: Airtable is a flexible and powerful spreadsheet-database hybrid that enables organizations to build custom workflows and automate tasks. With its rich set of features and integrations, Airtable offers a versatile platform for managing and analyzing workflows.
- Smartsheet: Smartsheet is a work management and automation platform that combines spreadsheet-like interface with workflow automation and collaboration features. It helps organizations streamline their processes, improve collaboration, and make better-informed decisions.
Bottom line
Workflow analysis is the process of studying and evaluating the sequence of tasks, activities, and interactions within a business process to identify inefficiencies and areas for improvement. There are many frameworks for workflow analysis from swimlane analysis to value stream mapping and process mining. By conducting a thorough workflow analysis in the aforementioned six steps, organizations can optimize their processes, enhance productivity, and achieve cost savings.
1. What are the steps for workflow analysis? The steps for workflow analysis involve first defining the scope and objectives of the analysis, followed by gathering relevant data and information about the current workflows in the organization. Next, create visual representations of the workflows, detailing the steps, inputs, outputs, and decision points to gain a clear understanding of how they function. Analyze the workflows to identify inefficiencies, bottlenecks, and areas for improvement. Once identified, develop and implement solutions to address these issues, such as process redesign or automation. Finally, monitor the performance of the improved workflows to ensure continuous improvement and make adjustments as necessary.
2. What are the three basic components of workflows? The three basic components of workflows are tasks, resources, and flow control. Tasks represent the individual steps or activities within a workflow, such as data entry, approvals, or document creation. Resources include the people, tools, and systems involved in performing the tasks, such as employees, software applications, or equipment. Flow control refers to the rules and logic that govern the sequence of tasks and the decision-making processes within the workflow, such as conditional branching or parallel processing.
3. How is workflow analysis used? Workflow analysis is used to gain insights into an organization’s business processes, identify inefficiencies, and implement improvements to streamline operations. Moreover, it helps organizations understand how their workflows function, pinpoint bottlenecks, and uncover opportunities for automation or process redesign. By analyzing and optimizing workflows, businesses can enhance efficiency, reduce costs, improve customer satisfaction, and drive better overall performance.
4. What are workflow analysis methods? Workflow analysis methods encompass a range of techniques and approaches for understanding and improving business processes. Some common methods include process mapping, which involves creating visual representations of workflows to identify inefficiencies and areas for improvement; data analysis, which uses quantitative measures to evaluate the performance of workflows and uncover opportunities for optimization; and simulation modeling, which allows organizations to test potential changes to workflows and assess their impact on performance. Additionally, qualitative methods, such as interviews and observations, can be used to gather insights from employees and stakeholders about the functioning of workflows and potential areas for improvement.

Related Content
Workflow Automation

Increase Enrollment Rates by Automating Student Transfer Processes
Time is a critical factor for transfer students seeking potential universities. The days of in-person applications that took weeks or even months are long gone. In our digitalized world, students...
August 12, 2024

15 Process Automation Examples
Process automation is an innovative approach for businesses keen on streamlining operations, increasing productivity, and slashing costs. However, implementing business process automation can seem...
October 20, 2023

4 Steps of Hyperautomation
A fast-paced digital landscape calls for fast-paced automation. Businesses everywhere are always adapting to stay competitive. Enter: hyperautomation. Hyperautomation combines AI, ML, and RPA to help...
October 19, 2023

Discover how leading organizations utilize ProcessMaker to streamline their operations through process automation.
Request a Demo
IMAGES
COMMENTS
By Meg McMahon Analyzing the notes from a user research study is an essential part of answering the research questions that prompted the study. During the analysis, you or your team decide what insights are generated from the notes taken about the research studies. The insights should relate to the research questions posed at the beginning of the study or point to future research.
What is user research analysis? Research analysis is the umbrella term used to define the process of classifying, organizing, ... VP of User Research at User Interviews, suggests the following workflow for analyzing, synthesizing, and sharing findings over the course of a research project:
UX Research Cheat Sheet. Susan Farrell. February 12, 2017. Summary: User research can be done at any point in the design cycle. This list of methods and activities can help you decide which to use when. User-experience research methods are great at producing data and insights, while ongoing activities help get the right things done.
Here are some tips for making user research analysis faster and easier on upcoming projects: Begin the user research by creating well defined questions and goals. Create tags based on each goal. Tag research notes and data as it's collected to speed up analysis later. Debrief after each research session.
The following UX research process is considered a linear process that allows us to share best practices among teams and work more smoothly. Basically, there are five phases with different steps that we are going to review below: Workflow process of a UX research project. 1. Having a kick-off meeting.
Details aren't critical here and the framework is flexible. Here it is, the UX research process in 7 (ish) steps: Step 1. Identify your research goals. This is the first and most important step in any user research study. Without clear goals and objectives, you're just fumbling in the dark. And that's no way to conduct user research.
TL;DR. The UX research process is a sequence of steps to collect and analyze data on user interactions with the product to better understand their needs and preferences. It's essential to build user-friendly products that satisfy their needs and offer a positive customer experience. It also helps teams empathize with users and foster customer ...
A UX research method is a way of generating insights about your users, their behavior, motivations, and needs. These methods help: Learn about user behavior and attitudes. Identify key pain points and challenges in the user interface. Develop user personas to identify user needs and drive solutions.
User research, or UX research, is an absolutely vital part of the user experience design process. Typically done at the start of a project, it encompasses different types of research methodologies to gather valuable data and feedback. When conducting user research, you'll engage with and observe your target users, getting to know their needs ...
As they say, UX research is an ever-changing process, thus, all the more should we adapt it to improving our research analysis workflow. In fact, there are many more methodologies than the user test covered in this blogpost, which can used for different research goals. There's so much more we can uncover beyond singular verbal and written ...
7 steps for user research with impact. Our step-by-step guide to UX research is based on lean UX design principles, meaning continuous iteration, testing, and user feedback are central. Lean UX is based on an agile cycle with three phases: Think: brainstorming and reflecting on areas for improvement.
How to plan a UX research study. This is a step-by-step guide to planning user research. It explains the process by which a research plan comes together into a shareable document (like the one above) that enables team alignment, accountability, and efficiency throughout your study. 1. Identify your research goals.
6. Prepare the brief. The next component of a research plan is to create a brief or guide for your research sessions. The kind of brief you need will vary depending on your research method, but for moderated methods like user interviews, field studies, or focus groups, you'll need a detailed guide and script.
1) Gather all the data. First of all, you should gather all the raw data regarding the interviews, surveys and any other research method applied. You must also transcribe audio and video files, so you have in hand all the material in text format. This will make the process easier.
During this first stage of your UX workflow, you create a document listing stakeholders, your UX team, budget, and timeline. 2. UX research process design and methodologies. Another key consideration for your UX workflow is how you'll go about uncovering insights—your UX research process and methodologies.
My user research framework is a guide to how user research could potentially work at a company. Again, it is not an "end-all-be-all" answer. It's something that you can shape to fit your team or company. It is a jumping-off point to brainstorming what user research does, how it can be organized, and what it can bring to an organization.
What is User Research? User research is defined as a systematic and multidisciplinary approach used to understand and empathize with the needs, behaviors, and preferences of a product or service's end users.It is a critical component of the product development process, helping designers, developers, and businesses create products and services that are user-centered and meet the real needs of ...
Step #1: Define research objectives. Go ahead - create that fake persona. Step #2: Pick your methods. Qualitative methods - the WHY. Quantitative methods - the WHAT. Behavioral and attitudinal methods. Step #3: Find your participants. How to recruit participants.
Introduction. Workflow analysis is a process of evaluating and improving the sequence of tasks, activities, and interactions that make up a particular business process or operation within an organization. This analysis aims to gain a detailed understanding of how work is performed within an organization, identifying areas where processes can be ...
That being said, AI can be incredibly useful as a tool to speed up research and free up researchers' time. With AI tools, UX researchers can skip the manual, time-consuming tedious parts of the workflow, and reserve their brains for the critical thinking and analysis that they excel at. AI gives researchers back time and mental energy that ...
1. #1 Survicate 2. #2 Maze 3. #3 Typeform 4. #4 UserZoom 5. #5 Lookback 6. #6 dscout 7. #7 Reframer 8. #8 Userlytics 9. #9 Hotjar 10. Find your perfect match. Google Chrome will stop using third-party cookies by the end of 2024, as Google announced recently. This delay gives you extra time to prepare yourself for gathering customer data in a ...
And on it goes, until they're ready to be used. . Task analysis is the research method whereby the steps in a process are revealed to someone who's not in the know. The challenge can sometimes be that product-builders believe they're in the know when they're not, and so they think this sort of research isn't necessary.
Workflow analysis is the process of studying, understanding, and evaluating the sequence of tasks, activities, and interactions that make up a specific business process or operation within an organization. The primary goal of workflow analysis is to identify inefficiencies, bottlenecks, redundancies, and areas for improvement in the workflow ...