

Reporting Participant Characteristics in a Research Paper
A report on a scientific study using human participants will include a description of the participant characteristics. This is included as a subsection of the “Methods” section, usually called “Participants” or “Participant Characteristics.” The purpose is to give readers information on the number and type of study participants, as a way of clarifying to whom the study findings apply and shedding light on the generalizability of the findings as well as any possible limitations. Accurate reporting is needed for replication studies that might be carried out in the future.
The “Participants” subsection should be fairly short and should tell readers about the population pool, how many participants were included in the study sample, and what kind of sample they represent, such as random, snowball, etc. There is no need to give a lengthy description of the method used to select or recruit the participants, as these topics belong in a separate “Procedures” subsection that is also under “Methods.” The subsection on “Participant Characteristics” only needs to provide facts on the participants themselves.
Report the participants’ genders (how many male and female participants) and ages (the age range and, if appropriate, the standard deviation). In particular, if you are writing for an international audience, specify the country and region or cities where the participants lived. If the study invited only participants with certain characteristics, report this, too. For example, tell readers if the participants all had autism, were left-handed, or had participated in sports within the past year.
Related: Finished preparing the methods sections for your research paper ? Find out why the “Methods” section is so important now!
Next, use your judgment to identify other pieces of information that are relevant to the study. For a detailed tutorial on reporting “Participant Characteristics,” see Alice Frye’s “Method Section: Describing participants.” Frye reminds authors to mention if only people with certain characteristics or backgrounds were included in the study. Did all the participants work at the same company? Were the students at the same school? Did they represent a range of socioeconomic backgrounds? Did they come from both urban and rural backgrounds? Were they physically and emotionally healthy? Similarly, mention if the study sample excluded people with certain characteristics.
If you are going to examine any participant characteristics as factors in the analysis, include a description of these. For instance, if you plan to examine the influence of teachers’ years of experience on their attitude toward new technology, then you should report the range of the teachers’ years of experience. If you plan to study how children’s socioeconomic level relates to their test scores, you should briefly mention that the children in the sample came from low, middle, and high-income backgrounds. Finally, mention whether the participants participated voluntarily. Include information on whether they gave informed consent (if the participants were children, mention that their parents consented to their participation). Also, mention if the participants received any sort of compensation or benefit for their participation, such as money or course credit.
Case Studies and Qualitative Reports
Case studies and qualitative reports may have only a few participants or even a single participant. If there is space to do so, you can write a brief background of each participant in the “Participants” section and include relevant information on the participant’s birthplace, current place of residence, language, and any life experience that is relevant to the study theme. If you have permission to use the participant’s name, do so. Otherwise, use a different name and add a note to readers that the name is a pseudonym. Alternatively, you might label the participants with numbers (e.g., Student 1, Student 2) or letters (e.g., Doctor A, Doctor B, etc.), or use initials to identify them (e.g., KY, JM).
Use Past Tense
Remember to use past tense when writing the “Participants” section . This is because you are describing what the participants’ characteristics were at the time of data collection . By the time your article is published, the participants’ characteristics may have changed. For example, they may be a year older and have more work experience. Their socioeconomic level may have changed since the study. In some cases, participants may even have passed away. While characteristics like gender and race are either unlikely or impossible to change, the whole section is written in the past tense to maintain a consistent style and to avoid making unsupported claims about what the participants’ current status is.
Rate this article Cancel Reply
Your email address will not be published.

Enago Academy's Most Popular Articles

- AI in Academia
- Infographic
- Manuscripts & Grants
- Reporting Research
- Trending Now
Can AI Tools Prepare a Research Manuscript From Scratch? — A comprehensive guide
As technology continues to advance, the question of whether artificial intelligence (AI) tools can prepare…

Abstract Vs. Introduction — Do you know the difference?
Ross wants to publish his research. Feeling positive about his research outcomes, he begins to…

- Old Webinars
- Webinar Mobile App
Demystifying Research Methodology With Field Experts
Choosing research methodology Research design and methodology Evidence-based research approach How RAxter can assist researchers

- Manuscript Preparation
- Publishing Research
How to Choose Best Research Methodology for Your Study
Successful research conduction requires proper planning and execution. While there are multiple reasons and aspects…

Top 5 Key Differences Between Methods and Methodology
While burning the midnight oil during literature review, most researchers do not realize that the…
How to Draft the Acknowledgment Section of a Manuscript
Discussion Vs. Conclusion: Know the Difference Before Drafting Manuscripts

Sign-up to read more
Subscribe for free to get unrestricted access to all our resources on research writing and academic publishing including:
- 2000+ blog articles
- 50+ Webinars
- 10+ Expert podcasts
- 50+ Infographics
- 10+ Checklists
- Research Guides
We hate spam too. We promise to protect your privacy and never spam you.
- Industry News
- Promoting Research
- Career Corner
- Diversity and Inclusion
- Infographics
- Expert Video Library
- Other Resources
- Enago Learn
- Upcoming & On-Demand Webinars
- Peer-Review Week 2023
- Open Access Week 2023
- Conference Videos
- Enago Report
- Journal Finder
- Enago Plagiarism & AI Grammar Check
- Editing Services
- Publication Support Services
- Research Impact
- Translation Services
- Publication solutions
- AI-Based Solutions
- Thought Leadership
- Call for Articles
- Call for Speakers
- Author Training
- Edit Profile
I am looking for Editing/ Proofreading services for my manuscript Tentative date of next journal submission:

In your opinion, what is the most effective way to improve integrity in the peer review process?
- Bipolar Disorder
- Therapy Center
- When To See a Therapist
- Types of Therapy
- Best Online Therapy
- Best Couples Therapy
- Managing Stress
- Sleep and Dreaming
- Understanding Emotions
- Self-Improvement
- Healthy Relationships
- Student Resources
- Personality Types
- Sweepstakes
- Guided Meditations
- Verywell Mind Insights
- 2024 Verywell Mind 25
- Mental Health in the Classroom
- Editorial Process
- Meet Our Review Board
- Crisis Support
How to Write a Methods Section for a Psychology Paper
Tips and Examples of an APA Methods Section
Verywell / Brianna Gilmartin
The methods section of an APA format psychology paper provides the methods and procedures used in a research study or experiment . This part of an APA paper is critical because it allows other researchers to see exactly how you conducted your research.
Method refers to the procedure that was used in a research study. It included a precise description of how the experiments were performed and why particular procedures were selected. While the APA technically refers to this section as the 'method section,' it is also often known as a 'methods section.'
The methods section ensures the experiment's reproducibility and the assessment of alternative methods that might produce different results. It also allows researchers to replicate the experiment and judge the study's validity.
This article discusses how to write a methods section for a psychology paper, including important elements to include and tips that can help.
What to Include in a Method Section
So what exactly do you need to include when writing your method section? You should provide detailed information on the following:
- Research design
- Participants
- Participant behavior
The method section should provide enough information to allow other researchers to replicate your experiment or study.
Components of a Method Section
The method section should utilize subheadings to divide up different subsections. These subsections typically include participants, materials, design, and procedure.
Participants
In this part of the method section, you should describe the participants in your experiment, including who they were (and any unique features that set them apart from the general population), how many there were, and how they were selected. If you utilized random selection to choose your participants, it should be noted here.
For example: "We randomly selected 100 children from elementary schools near the University of Arizona."
At the very minimum, this part of your method section must convey:
- Basic demographic characteristics of your participants (such as sex, age, ethnicity, or religion)
- The population from which your participants were drawn
- Any restrictions on your pool of participants
- How many participants were assigned to each condition and how they were assigned to each group (i.e., randomly assignment , another selection method, etc.)
- Why participants took part in your research (i.e., the study was advertised at a college or hospital, they received some type of incentive, etc.)
Information about participants helps other researchers understand how your study was performed, how generalizable the result might be, and allows other researchers to replicate the experiment with other populations to see if they might obtain the same results.
In this part of the method section, you should describe the materials, measures, equipment, or stimuli used in the experiment. This may include:
- Testing instruments
- Technical equipment
- Any psychological assessments that were used
- Any special equipment that was used
For example: "Two stories from Sullivan et al.'s (1994) second-order false belief attribution tasks were used to assess children's understanding of second-order beliefs."
For standard equipment such as computers, televisions, and videos, you can simply name the device and not provide further explanation.
Specialized equipment should be given greater detail, especially if it is complex or created for a niche purpose. In some instances, such as if you created a special material or apparatus for your study, you might need to include an illustration of the item in the appendix of your paper.
In this part of your method section, describe the type of design used in the experiment. Specify the variables as well as the levels of these variables. Identify:
- The independent variables
- Dependent variables
- Control variables
- Any extraneous variables that might influence your results.
Also, explain whether your experiment uses a within-groups or between-groups design.
For example: "The experiment used a 3x2 between-subjects design. The independent variables were age and understanding of second-order beliefs."
The next part of your method section should detail the procedures used in your experiment. Your procedures should explain:
- What the participants did
- How data was collected
- The order in which steps occurred
For example: "An examiner interviewed children individually at their school in one session that lasted 20 minutes on average. The examiner explained to each child that he or she would be told two short stories and that some questions would be asked after each story. All sessions were videotaped so the data could later be coded."
Keep this subsection concise yet detailed. Explain what you did and how you did it, but do not overwhelm your readers with too much information.
Tips for How to Write a Methods Section
In addition to following the basic structure of an APA method section, there are also certain things you should remember when writing this section of your paper. Consider the following tips when writing this section:
- Use the past tense : Always write the method section in the past tense.
- Be descriptive : Provide enough detail that another researcher could replicate your experiment, but focus on brevity. Avoid unnecessary detail that is not relevant to the outcome of the experiment.
- Use an academic tone : Use formal language and avoid slang or colloquial expressions. Word choice is also important. Refer to the people in your experiment or study as "participants" rather than "subjects."
- Use APA format : Keep a style guide on hand as you write your method section. The Publication Manual of the American Psychological Association is the official source for APA style.
- Make connections : Read through each section of your paper for agreement with other sections. If you mention procedures in the method section, these elements should be discussed in the results and discussion sections.
- Proofread : Check your paper for grammar, spelling, and punctuation errors.. typos, grammar problems, and spelling errors. Although a spell checker is a handy tool, there are some errors only you can catch.
After writing a draft of your method section, be sure to get a second opinion. You can often become too close to your work to see errors or lack of clarity. Take a rough draft of your method section to your university's writing lab for additional assistance.
A Word From Verywell
The method section is one of the most important components of your APA format paper. The goal of your paper should be to clearly detail what you did in your experiment. Provide enough detail that another researcher could replicate your study if they wanted.
Finally, if you are writing your paper for a class or for a specific publication, be sure to keep in mind any specific instructions provided by your instructor or by the journal editor. Your instructor may have certain requirements that you need to follow while writing your method section.
Frequently Asked Questions
While the subsections can vary, the three components that should be included are sections on the participants, the materials, and the procedures.
- Describe who the participants were in the study and how they were selected.
- Define and describe the materials that were used including any equipment, tests, or assessments
- Describe how the data was collected
To write your methods section in APA format, describe your participants, materials, study design, and procedures. Keep this section succinct, and always write in the past tense. The main heading of this section should be labeled "Method" and it should be centered, bolded, and capitalized. Each subheading within this section should be bolded, left-aligned and in title case.
The purpose of the methods section is to describe what you did in your experiment. It should be brief, but include enough detail that someone could replicate your experiment based on this information. Your methods section should detail what you did to answer your research question. Describe how the study was conducted, the study design that was used and why it was chosen, and how you collected the data and analyzed the results.
Erdemir F. How to write a materials and methods section of a scientific article ? Turk J Urol . 2013;39(Suppl 1):10-5. doi:10.5152/tud.2013.047
Kallet RH. How to write the methods section of a research paper . Respir Care . 2004;49(10):1229-32. PMID: 15447808.
American Psychological Association. Publication Manual of the American Psychological Association (7th ed.). Washington DC: The American Psychological Association; 2019.
American Psychological Association. APA Style Journal Article Reporting Standards . Published 2020.
By Kendra Cherry, MSEd Kendra Cherry, MS, is a psychosocial rehabilitation specialist, psychology educator, and author of the "Everything Psychology Book."
Want to create or adapt books like this? Learn more about how Pressbooks supports open publishing practices.
Chapter 11: Presenting Your Research
Writing a Research Report in American Psychological Association (APA) Style
Learning Objectives
- Identify the major sections of an APA-style research report and the basic contents of each section.
- Plan and write an effective APA-style research report.
In this section, we look at how to write an APA-style empirical research report , an article that presents the results of one or more new studies. Recall that the standard sections of an empirical research report provide a kind of outline. Here we consider each of these sections in detail, including what information it contains, how that information is formatted and organized, and tips for writing each section. At the end of this section is a sample APA-style research report that illustrates many of these principles.
Sections of a Research Report
Title page and abstract.
An APA-style research report begins with a title page . The title is centred in the upper half of the page, with each important word capitalized. The title should clearly and concisely (in about 12 words or fewer) communicate the primary variables and research questions. This sometimes requires a main title followed by a subtitle that elaborates on the main title, in which case the main title and subtitle are separated by a colon. Here are some titles from recent issues of professional journals published by the American Psychological Association.
- Sex Differences in Coping Styles and Implications for Depressed Mood
- Effects of Aging and Divided Attention on Memory for Items and Their Contexts
- Computer-Assisted Cognitive Behavioural Therapy for Child Anxiety: Results of a Randomized Clinical Trial
- Virtual Driving and Risk Taking: Do Racing Games Increase Risk-Taking Cognitions, Affect, and Behaviour?
Below the title are the authors’ names and, on the next line, their institutional affiliation—the university or other institution where the authors worked when they conducted the research. As we have already seen, the authors are listed in an order that reflects their contribution to the research. When multiple authors have made equal contributions to the research, they often list their names alphabetically or in a randomly determined order.
In some areas of psychology, the titles of many empirical research reports are informal in a way that is perhaps best described as “cute.” They usually take the form of a play on words or a well-known expression that relates to the topic under study. Here are some examples from recent issues of the Journal Psychological Science .
- “Smells Like Clean Spirit: Nonconscious Effects of Scent on Cognition and Behavior”
- “Time Crawls: The Temporal Resolution of Infants’ Visual Attention”
- “Scent of a Woman: Men’s Testosterone Responses to Olfactory Ovulation Cues”
- “Apocalypse Soon?: Dire Messages Reduce Belief in Global Warming by Contradicting Just-World Beliefs”
- “Serial vs. Parallel Processing: Sometimes They Look Like Tweedledum and Tweedledee but They Can (and Should) Be Distinguished”
- “How Do I Love Thee? Let Me Count the Words: The Social Effects of Expressive Writing”
Individual researchers differ quite a bit in their preference for such titles. Some use them regularly, while others never use them. What might be some of the pros and cons of using cute article titles?
For articles that are being submitted for publication, the title page also includes an author note that lists the authors’ full institutional affiliations, any acknowledgments the authors wish to make to agencies that funded the research or to colleagues who commented on it, and contact information for the authors. For student papers that are not being submitted for publication—including theses—author notes are generally not necessary.
The abstract is a summary of the study. It is the second page of the manuscript and is headed with the word Abstract . The first line is not indented. The abstract presents the research question, a summary of the method, the basic results, and the most important conclusions. Because the abstract is usually limited to about 200 words, it can be a challenge to write a good one.
Introduction
The introduction begins on the third page of the manuscript. The heading at the top of this page is the full title of the manuscript, with each important word capitalized as on the title page. The introduction includes three distinct subsections, although these are typically not identified by separate headings. The opening introduces the research question and explains why it is interesting, the literature review discusses relevant previous research, and the closing restates the research question and comments on the method used to answer it.
The Opening
The opening , which is usually a paragraph or two in length, introduces the research question and explains why it is interesting. To capture the reader’s attention, researcher Daryl Bem recommends starting with general observations about the topic under study, expressed in ordinary language (not technical jargon)—observations that are about people and their behaviour (not about researchers or their research; Bem, 2003 [1] ). Concrete examples are often very useful here. According to Bem, this would be a poor way to begin a research report:
Festinger’s theory of cognitive dissonance received a great deal of attention during the latter part of the 20th century (p. 191)
The following would be much better:
The individual who holds two beliefs that are inconsistent with one another may feel uncomfortable. For example, the person who knows that he or she enjoys smoking but believes it to be unhealthy may experience discomfort arising from the inconsistency or disharmony between these two thoughts or cognitions. This feeling of discomfort was called cognitive dissonance by social psychologist Leon Festinger (1957), who suggested that individuals will be motivated to remove this dissonance in whatever way they can (p. 191).
After capturing the reader’s attention, the opening should go on to introduce the research question and explain why it is interesting. Will the answer fill a gap in the literature? Will it provide a test of an important theory? Does it have practical implications? Giving readers a clear sense of what the research is about and why they should care about it will motivate them to continue reading the literature review—and will help them make sense of it.
Breaking the Rules
Researcher Larry Jacoby reported several studies showing that a word that people see or hear repeatedly can seem more familiar even when they do not recall the repetitions—and that this tendency is especially pronounced among older adults. He opened his article with the following humourous anecdote:
A friend whose mother is suffering symptoms of Alzheimer’s disease (AD) tells the story of taking her mother to visit a nursing home, preliminary to her mother’s moving there. During an orientation meeting at the nursing home, the rules and regulations were explained, one of which regarded the dining room. The dining room was described as similar to a fine restaurant except that tipping was not required. The absence of tipping was a central theme in the orientation lecture, mentioned frequently to emphasize the quality of care along with the advantages of having paid in advance. At the end of the meeting, the friend’s mother was asked whether she had any questions. She replied that she only had one question: “Should I tip?” (Jacoby, 1999, p. 3)
Although both humour and personal anecdotes are generally discouraged in APA-style writing, this example is a highly effective way to start because it both engages the reader and provides an excellent real-world example of the topic under study.
The Literature Review
Immediately after the opening comes the literature review , which describes relevant previous research on the topic and can be anywhere from several paragraphs to several pages in length. However, the literature review is not simply a list of past studies. Instead, it constitutes a kind of argument for why the research question is worth addressing. By the end of the literature review, readers should be convinced that the research question makes sense and that the present study is a logical next step in the ongoing research process.
Like any effective argument, the literature review must have some kind of structure. For example, it might begin by describing a phenomenon in a general way along with several studies that demonstrate it, then describing two or more competing theories of the phenomenon, and finally presenting a hypothesis to test one or more of the theories. Or it might describe one phenomenon, then describe another phenomenon that seems inconsistent with the first one, then propose a theory that resolves the inconsistency, and finally present a hypothesis to test that theory. In applied research, it might describe a phenomenon or theory, then describe how that phenomenon or theory applies to some important real-world situation, and finally suggest a way to test whether it does, in fact, apply to that situation.
Looking at the literature review in this way emphasizes a few things. First, it is extremely important to start with an outline of the main points that you want to make, organized in the order that you want to make them. The basic structure of your argument, then, should be apparent from the outline itself. Second, it is important to emphasize the structure of your argument in your writing. One way to do this is to begin the literature review by summarizing your argument even before you begin to make it. “In this article, I will describe two apparently contradictory phenomena, present a new theory that has the potential to resolve the apparent contradiction, and finally present a novel hypothesis to test the theory.” Another way is to open each paragraph with a sentence that summarizes the main point of the paragraph and links it to the preceding points. These opening sentences provide the “transitions” that many beginning researchers have difficulty with. Instead of beginning a paragraph by launching into a description of a previous study, such as “Williams (2004) found that…,” it is better to start by indicating something about why you are describing this particular study. Here are some simple examples:
Another example of this phenomenon comes from the work of Williams (2004).
Williams (2004) offers one explanation of this phenomenon.
An alternative perspective has been provided by Williams (2004).
We used a method based on the one used by Williams (2004).
Finally, remember that your goal is to construct an argument for why your research question is interesting and worth addressing—not necessarily why your favourite answer to it is correct. In other words, your literature review must be balanced. If you want to emphasize the generality of a phenomenon, then of course you should discuss various studies that have demonstrated it. However, if there are other studies that have failed to demonstrate it, you should discuss them too. Or if you are proposing a new theory, then of course you should discuss findings that are consistent with that theory. However, if there are other findings that are inconsistent with it, again, you should discuss them too. It is acceptable to argue that the balance of the research supports the existence of a phenomenon or is consistent with a theory (and that is usually the best that researchers in psychology can hope for), but it is not acceptable to ignore contradictory evidence. Besides, a large part of what makes a research question interesting is uncertainty about its answer.
The Closing
The closing of the introduction—typically the final paragraph or two—usually includes two important elements. The first is a clear statement of the main research question or hypothesis. This statement tends to be more formal and precise than in the opening and is often expressed in terms of operational definitions of the key variables. The second is a brief overview of the method and some comment on its appropriateness. Here, for example, is how Darley and Latané (1968) [2] concluded the introduction to their classic article on the bystander effect:
These considerations lead to the hypothesis that the more bystanders to an emergency, the less likely, or the more slowly, any one bystander will intervene to provide aid. To test this proposition it would be necessary to create a situation in which a realistic “emergency” could plausibly occur. Each subject should also be blocked from communicating with others to prevent his getting information about their behaviour during the emergency. Finally, the experimental situation should allow for the assessment of the speed and frequency of the subjects’ reaction to the emergency. The experiment reported below attempted to fulfill these conditions. (p. 378)
Thus the introduction leads smoothly into the next major section of the article—the method section.
The method section is where you describe how you conducted your study. An important principle for writing a method section is that it should be clear and detailed enough that other researchers could replicate the study by following your “recipe.” This means that it must describe all the important elements of the study—basic demographic characteristics of the participants, how they were recruited, whether they were randomly assigned, how the variables were manipulated or measured, how counterbalancing was accomplished, and so on. At the same time, it should avoid irrelevant details such as the fact that the study was conducted in Classroom 37B of the Industrial Technology Building or that the questionnaire was double-sided and completed using pencils.
The method section begins immediately after the introduction ends with the heading “Method” (not “Methods”) centred on the page. Immediately after this is the subheading “Participants,” left justified and in italics. The participants subsection indicates how many participants there were, the number of women and men, some indication of their age, other demographics that may be relevant to the study, and how they were recruited, including any incentives given for participation.

After the participants section, the structure can vary a bit. Figure 11.1 shows three common approaches. In the first, the participants section is followed by a design and procedure subsection, which describes the rest of the method. This works well for methods that are relatively simple and can be described adequately in a few paragraphs. In the second approach, the participants section is followed by separate design and procedure subsections. This works well when both the design and the procedure are relatively complicated and each requires multiple paragraphs.
What is the difference between design and procedure? The design of a study is its overall structure. What were the independent and dependent variables? Was the independent variable manipulated, and if so, was it manipulated between or within subjects? How were the variables operationally defined? The procedure is how the study was carried out. It often works well to describe the procedure in terms of what the participants did rather than what the researchers did. For example, the participants gave their informed consent, read a set of instructions, completed a block of four practice trials, completed a block of 20 test trials, completed two questionnaires, and were debriefed and excused.
In the third basic way to organize a method section, the participants subsection is followed by a materials subsection before the design and procedure subsections. This works well when there are complicated materials to describe. This might mean multiple questionnaires, written vignettes that participants read and respond to, perceptual stimuli, and so on. The heading of this subsection can be modified to reflect its content. Instead of “Materials,” it can be “Questionnaires,” “Stimuli,” and so on.
The results section is where you present the main results of the study, including the results of the statistical analyses. Although it does not include the raw data—individual participants’ responses or scores—researchers should save their raw data and make them available to other researchers who request them. Several journals now encourage the open sharing of raw data online.
Although there are no standard subsections, it is still important for the results section to be logically organized. Typically it begins with certain preliminary issues. One is whether any participants or responses were excluded from the analyses and why. The rationale for excluding data should be described clearly so that other researchers can decide whether it is appropriate. A second preliminary issue is how multiple responses were combined to produce the primary variables in the analyses. For example, if participants rated the attractiveness of 20 stimulus people, you might have to explain that you began by computing the mean attractiveness rating for each participant. Or if they recalled as many items as they could from study list of 20 words, did you count the number correctly recalled, compute the percentage correctly recalled, or perhaps compute the number correct minus the number incorrect? A third preliminary issue is the reliability of the measures. This is where you would present test-retest correlations, Cronbach’s α, or other statistics to show that the measures are consistent across time and across items. A final preliminary issue is whether the manipulation was successful. This is where you would report the results of any manipulation checks.
The results section should then tackle the primary research questions, one at a time. Again, there should be a clear organization. One approach would be to answer the most general questions and then proceed to answer more specific ones. Another would be to answer the main question first and then to answer secondary ones. Regardless, Bem (2003) [3] suggests the following basic structure for discussing each new result:
- Remind the reader of the research question.
- Give the answer to the research question in words.
- Present the relevant statistics.
- Qualify the answer if necessary.
- Summarize the result.
Notice that only Step 3 necessarily involves numbers. The rest of the steps involve presenting the research question and the answer to it in words. In fact, the basic results should be clear even to a reader who skips over the numbers.
The discussion is the last major section of the research report. Discussions usually consist of some combination of the following elements:
- Summary of the research
- Theoretical implications
- Practical implications
- Limitations
- Suggestions for future research
The discussion typically begins with a summary of the study that provides a clear answer to the research question. In a short report with a single study, this might require no more than a sentence. In a longer report with multiple studies, it might require a paragraph or even two. The summary is often followed by a discussion of the theoretical implications of the research. Do the results provide support for any existing theories? If not, how can they be explained? Although you do not have to provide a definitive explanation or detailed theory for your results, you at least need to outline one or more possible explanations. In applied research—and often in basic research—there is also some discussion of the practical implications of the research. How can the results be used, and by whom, to accomplish some real-world goal?
The theoretical and practical implications are often followed by a discussion of the study’s limitations. Perhaps there are problems with its internal or external validity. Perhaps the manipulation was not very effective or the measures not very reliable. Perhaps there is some evidence that participants did not fully understand their task or that they were suspicious of the intent of the researchers. Now is the time to discuss these issues and how they might have affected the results. But do not overdo it. All studies have limitations, and most readers will understand that a different sample or different measures might have produced different results. Unless there is good reason to think they would have, however, there is no reason to mention these routine issues. Instead, pick two or three limitations that seem like they could have influenced the results, explain how they could have influenced the results, and suggest ways to deal with them.
Most discussions end with some suggestions for future research. If the study did not satisfactorily answer the original research question, what will it take to do so? What new research questions has the study raised? This part of the discussion, however, is not just a list of new questions. It is a discussion of two or three of the most important unresolved issues. This means identifying and clarifying each question, suggesting some alternative answers, and even suggesting ways they could be studied.
Finally, some researchers are quite good at ending their articles with a sweeping or thought-provoking conclusion. Darley and Latané (1968) [4] , for example, ended their article on the bystander effect by discussing the idea that whether people help others may depend more on the situation than on their personalities. Their final sentence is, “If people understand the situational forces that can make them hesitate to intervene, they may better overcome them” (p. 383). However, this kind of ending can be difficult to pull off. It can sound overreaching or just banal and end up detracting from the overall impact of the article. It is often better simply to end when you have made your final point (although you should avoid ending on a limitation).
The references section begins on a new page with the heading “References” centred at the top of the page. All references cited in the text are then listed in the format presented earlier. They are listed alphabetically by the last name of the first author. If two sources have the same first author, they are listed alphabetically by the last name of the second author. If all the authors are the same, then they are listed chronologically by the year of publication. Everything in the reference list is double-spaced both within and between references.
Appendices, Tables, and Figures
Appendices, tables, and figures come after the references. An appendix is appropriate for supplemental material that would interrupt the flow of the research report if it were presented within any of the major sections. An appendix could be used to present lists of stimulus words, questionnaire items, detailed descriptions of special equipment or unusual statistical analyses, or references to the studies that are included in a meta-analysis. Each appendix begins on a new page. If there is only one, the heading is “Appendix,” centred at the top of the page. If there is more than one, the headings are “Appendix A,” “Appendix B,” and so on, and they appear in the order they were first mentioned in the text of the report.
After any appendices come tables and then figures. Tables and figures are both used to present results. Figures can also be used to illustrate theories (e.g., in the form of a flowchart), display stimuli, outline procedures, and present many other kinds of information. Each table and figure appears on its own page. Tables are numbered in the order that they are first mentioned in the text (“Table 1,” “Table 2,” and so on). Figures are numbered the same way (“Figure 1,” “Figure 2,” and so on). A brief explanatory title, with the important words capitalized, appears above each table. Each figure is given a brief explanatory caption, where (aside from proper nouns or names) only the first word of each sentence is capitalized. More details on preparing APA-style tables and figures are presented later in the book.
Sample APA-Style Research Report
Figures 11.2, 11.3, 11.4, and 11.5 show some sample pages from an APA-style empirical research report originally written by undergraduate student Tomoe Suyama at California State University, Fresno. The main purpose of these figures is to illustrate the basic organization and formatting of an APA-style empirical research report, although many high-level and low-level style conventions can be seen here too.

Key Takeaways
- An APA-style empirical research report consists of several standard sections. The main ones are the abstract, introduction, method, results, discussion, and references.
- The introduction consists of an opening that presents the research question, a literature review that describes previous research on the topic, and a closing that restates the research question and comments on the method. The literature review constitutes an argument for why the current study is worth doing.
- The method section describes the method in enough detail that another researcher could replicate the study. At a minimum, it consists of a participants subsection and a design and procedure subsection.
- The results section describes the results in an organized fashion. Each primary result is presented in terms of statistical results but also explained in words.
- The discussion typically summarizes the study, discusses theoretical and practical implications and limitations of the study, and offers suggestions for further research.
- Practice: Look through an issue of a general interest professional journal (e.g., Psychological Science ). Read the opening of the first five articles and rate the effectiveness of each one from 1 ( very ineffective ) to 5 ( very effective ). Write a sentence or two explaining each rating.
- Practice: Find a recent article in a professional journal and identify where the opening, literature review, and closing of the introduction begin and end.
- Practice: Find a recent article in a professional journal and highlight in a different colour each of the following elements in the discussion: summary, theoretical implications, practical implications, limitations, and suggestions for future research.
Long Descriptions
Figure 11.1 long description: Table showing three ways of organizing an APA-style method section.
In the simple method, there are two subheadings: “Participants” (which might begin “The participants were…”) and “Design and procedure” (which might begin “There were three conditions…”).
In the typical method, there are three subheadings: “Participants” (“The participants were…”), “Design” (“There were three conditions…”), and “Procedure” (“Participants viewed each stimulus on the computer screen…”).
In the complex method, there are four subheadings: “Participants” (“The participants were…”), “Materials” (“The stimuli were…”), “Design” (“There were three conditions…”), and “Procedure” (“Participants viewed each stimulus on the computer screen…”). [Return to Figure 11.1]
- Bem, D. J. (2003). Writing the empirical journal article. In J. M. Darley, M. P. Zanna, & H. R. Roediger III (Eds.), The compleat academic: A practical guide for the beginning social scientist (2nd ed.). Washington, DC: American Psychological Association. ↵
- Darley, J. M., & Latané, B. (1968). Bystander intervention in emergencies: Diffusion of responsibility. Journal of Personality and Social Psychology, 4 , 377–383. ↵
A type of research article which describes one or more new empirical studies conducted by the authors.
The page at the beginning of an APA-style research report containing the title of the article, the authors’ names, and their institutional affiliation.
A summary of a research study.
The third page of a manuscript containing the research question, the literature review, and comments about how to answer the research question.
An introduction to the research question and explanation for why this question is interesting.
A description of relevant previous research on the topic being discusses and an argument for why the research is worth addressing.
The end of the introduction, where the research question is reiterated and the method is commented upon.
The section of a research report where the method used to conduct the study is described.
The main results of the study, including the results from statistical analyses, are presented in a research article.
Section of a research report that summarizes the study's results and interprets them by referring back to the study's theoretical background.
Part of a research report which contains supplemental material.
Research Methods in Psychology - 2nd Canadian Edition Copyright © 2015 by Paul C. Price, Rajiv Jhangiani, & I-Chant A. Chiang is licensed under a Creative Commons Attribution-NonCommercial-ShareAlike 4.0 International License , except where otherwise noted.
Share This Book
Purdue Online Writing Lab Purdue OWL® College of Liberal Arts
Writing the Experimental Report: Methods, Results, and Discussion

Welcome to the Purdue OWL
This page is brought to you by the OWL at Purdue University. When printing this page, you must include the entire legal notice.
Copyright ©1995-2018 by The Writing Lab & The OWL at Purdue and Purdue University. All rights reserved. This material may not be published, reproduced, broadcast, rewritten, or redistributed without permission. Use of this site constitutes acceptance of our terms and conditions of fair use.
Method section
Your method section provides a detailed overview of how you conducted your research. Because your study methods form a large part of your credibility as a researcher and writer, it is imperative that you be clear about what you did to gather information from participants in your study.
With your methods section, as with the sections above, you want to walk your readers through your study almost as if they were a participant. What happened first? What happened next?
The method section includes the following sub-sections.
I. Participants: Discuss who was enrolled in your experiment. Include major demographics that have an impact on the results of the experiment (i.e. if race is a factor, you should provide a breakdown by race). The accepted term for describing a person who participates in research studies is a participant not a subject.
II. Apparatus and materials: The apparatus is any equipment used during data collection (such as computers or eye-tracking devices). Materials include scripts, surveys, or software used for data collection (not data analysis). It is sometimes necessary to provide specific examples of materials or prompts, depending on the nature of your study.
III. Procedure: The procedure includes the step-by-step how of your experiment. The procedure should include:
- A description of the experimental design and how participants were assigned conditions.
- Identification of your independent variable(s) (IV), dependent variable(s) (DV), and control variables. Give your variables clear, meaningful names so that your readers are not confused.
- Important instructions to participants.
- A step-by-step listing in chronological order of what participants did during the experiment.
Results section
The results section is where you present the results of your research-both narrated for the readers in plain English and accompanied by statistics.
Note : Depending on the requirements or the projected length of your paper, sometimes the results are combined with the discussion section.
Organizing Results
Continue with your story in the results section. How do your results fit with the overall story you are telling? What results are the most compelling? You want to begin your discussion by reminding your readers once again what your hypotheses were and what your overall story is. Then provide each result as it relates to that story. The most important results should go first.
Preliminary discussion: Sometimes it is necessary to provide a preliminary discussion in your results section about your participant groups. In order to convince your readers that your results are meaningful, you must first demonstrate that the conditions of the study were met. For example, if you randomly assigned subjects into groups, are these two groups comparable? You can't discuss the differences in the two groups until you establish that the two groups can be compared.
Provide information on your data analysis: Be sure to describe the analysis you did. If you are using a non-conventional analysis, you also need to provide justification for why you are doing so.
Presenting Results : Bem (2006) recommends the following pattern for presenting findings:
- Remind readers of the conceptual hypotheses or questions you are asking
- Remind readers of behaviors measured or operations performed
- Provide the answer/result in plain English
- Provide the statistic that supports your plain English answer
- Elaborate or qualify the overall conclusion if necessary
Writers new to psychology and writing with statistics often dump numbers at their readers without providing a clear narration of what those numbers mean. Please see our Writing with Statistics handout for more information on how to write with statistics.
Discussion section
Your discussion section is where you talk about what your results mean and where you wrap up the overall story you are telling. This is where you interpret your findings, evaluate your hypotheses or research questions, discuss unexpected results, and tie your findings to the previous literature (discussed first in your literature review). Your discussion section should move from specific to general.
Here are some tips for writing your discussion section.
- Begin by providing an interpretation of your results: what is it that you have learned from your research?
- Discuss each hypotheses or research question in more depth.
- Do not repeat what you have already said in your results—instead, focus on adding new information and broadening the perspective of your results to you reader.
- Discuss how your results compare to previous findings in the literature. If there are differences, discuss why you think these differences exist and what they could mean.
- Briefly consider your study's limitations, but do not dwell on its flaws.
- Consider also what new questions your study raises, what questions your study was not able to answer, and what avenues future research could take in this area.
Example: Here is how this works.
References section
References should be in standard APA format. Please see our APA Formatting guide for specific instructions.

The Plagiarism Checker Online For Your Academic Work
Start Plagiarism Check
Editing & Proofreading for Your Research Paper
Get it proofread now
Online Printing & Binding with Free Express Delivery
Configure binding now
- Academic essay overview
- The writing process
- Structuring academic essays
- Types of academic essays
- Academic writing overview
- Sentence structure
- Academic writing process
- Improving your academic writing
- Titles and headings
- APA style overview
- APA citation & referencing
- APA structure & sections
- Citation & referencing
- Structure and sections
- APA examples overview
- Commonly used citations
- Other examples
- British English vs. American English
- Chicago style overview
- Chicago citation & referencing
- Chicago structure & sections
- Chicago style examples
- Citing sources overview
- Citation format
- Citation examples
- College essay overview
- Application
- How to write a college essay
- Types of college essays
- Commonly confused words
- Definitions
- Dissertation overview
- Dissertation structure & sections
- Dissertation writing process
- Graduate school overview
- Application & admission
- Study abroad
- Master degree
- Harvard referencing overview
- Language rules overview
- Grammatical rules & structures
- Parts of speech
- Punctuation
- Methodology overview
- Analyzing data
- Experiments
- Observations
- Inductive vs. Deductive
- Qualitative vs. Quantitative
- Types of validity
- Types of reliability
- Sampling methods
- Theories & Concepts
- Types of research studies
- Types of variables
- MLA style overview
- MLA examples
- MLA citation & referencing
- MLA structure & sections
- Plagiarism overview
- Plagiarism checker
- Types of plagiarism
- Printing production overview
- Research bias overview
- Types of research bias
- Example sections
- Types of research papers
- Research process overview
- Problem statement
- Research proposal
- Research topic
- Statistics overview
- Levels of measurment
- Frequency distribution
- Measures of central tendency
- Measures of variability
- Hypothesis testing
- Parameters & test statistics
- Types of distributions
- Correlation
- Effect size
- Hypothesis testing assumptions
- Types of ANOVAs
- Types of chi-square
- Statistical data
- Statistical models
- Spelling mistakes
- Tips overview
- Academic writing tips
- Dissertation tips
- Sources tips
- Working with sources overview
- Evaluating sources
- Finding sources
- Including sources
- Types of sources

Your Step to Success
Plagiarism Check within 10min
Printing & Binding with 3D Live Preview
APA Methods Section – How To Write It With Examples
How do you like this article cancel reply.
Save my name, email, and website in this browser for the next time I comment.

The APA methods section is a very important part of your academic paper, displaying how you conducted your research by providing a precise description of the methods and procedures you used for the study. This section ensures transparency, allowing other researchers to see exactly how you conducted your experiments. In APA style , the methods section usually includes subsections on participants, materials or measures, and procedures. This article discusses the APA methods section in detail.
Inhaltsverzeichnis
- 1 APA Methods Section – In a Nutshell
- 2 Definition: APA Methods Section
- 3 APA Methods Section: Structure
- 4 APA Methods Section: Participants
- 5 APA Methods Section: Materials
- 6 APA Methods Section: Procedure
APA Methods Section – In a Nutshell
- The APA methods section covers the participants, materials, and procedures.
- Under the ‘Participants’ heading of the APA methods section, you should state the relevant demographic characteristics of your participants.
- Accurately reporting the facts of the study can help other researchers determine how much the results can be generalized.
Definition: APA Methods Section
The APA methods section describes the procedures you used to carry out your research and explains why particular processes were selected. It allows other researchers to replicate the study and make their own conclusions on the validity of the experiment.
APA Methods Section: Structure
- The main heading of the APA methods section should be written in bold and should be capitalized. It also has to be centered.
- All subheadings should be aligned to the left and must be boldfaced. You should select subheadings that are suitable for your essay, and the most commonly used include ‘Participants’, ‘Materials’, and ‘Procedure’.
Heading formats:
| Participants | • Study participants • Sampling methods • Sample size |
| Materials | • Measures used in the study • Quality of the measurements |
| Procedure | • Methods of collecting data • The research design • The method of diagnosing and processing data • Data analysis method |
APA format has certain requirements for reporting different research designs. You should go through these guidelines to determine what you should mention for research using longitudinal designs , replication studies, and experimental designs .
APA Methods Section: Participants
Under this subheading, you will have to report on the sample characteristics, the procedures used to collect samples, and the sample size selected.
Subject or Participant Characteristics
In academic studies, ‘participants’ refers to the people who take part in a study. If animals are used instead of human beings, the researcher can use the term ‘subjects’. In this subheading of the APA methods section, you have to describe the demographic characteristics of the participants, including their age, sex, race, ethnic group, education level, and gender identity. Depending on the nature of the study, other characteristics may be important. Some of these include:
- Education levels
- Language preference
- Immigration status
By describing the characteristics of the participants, readers will be able to determine how much the results can be generalized. Make sure you use bias-free language when writing this part of the APA methods section.
The study included 100 homosexual men and 100 homosexual women aged between 30 and 50 years from the city of London, UK.
Sampling Procedures
When selecting participants for your study, you will have to use certain sampling procedures. If the study could access all members of the population, you can say that you used random sampling methods. This section of the APA methods section should cover the percentage of respondents who participated in the research, and how they were chosen. You also need to state how participants were compensated and the ethical standard followed.
- Transgender male students from London were invited to participate in a study.
- Invites were sent to the students via email, social media posts, and posters in the schools.
- Each participant received $10 for the time spent in the study.
- The research obtained ethical approval before the participants were recruited.
Sample Size and Statistical Power
In this part of the APA methods section, you should give details on the sample size and statistical power you aimed at achieving. You should mention whether the final sample was the same as the intended sample. This section should show whether your research had enough statistical power to find any effects.
- The study aimed at a statistical power of 75% to detect an effect of 10% with an alpha of .05.
- 200 participants were required, and the study fulfilled these conditions.
APA Methods Section: Materials
Readers also need to know the materials you used for the study. This part of the APA methods section will give other researchers a good picture of the methods used to conduct the study.
Primary and secondary measures
Here, you should indicate the instruments used in the study, as well as the constructs they were meant to measure. Some of these are inventories, scales, tests, software, and hardware. Make sure you cover the following aspects:
- Reliability
- The Traumatic Stress Schedule (TSS) was used to measure the exposure to traumatic events.
- This 10-item chart requires participants to report lifelong exposure to traumatic stress.
- For example, they could indicate whether they suffered the traumatic death of a loved one.
- The Davidson Trauma Scale was also used to assess the symptoms of trauma.
Under this subheading of the APA methods section, you should also mention covariates or additional variables that can explain the outcomes.
Quality of measurements
You can mention the strategies you applied to ensure data integrity and reliability. These may include:
- Training the interviewers
- Establishing clear data nominalization procedures
- Rigorous data handling and analysis processes
- Having multiple people assess the data
If the data was subjectively coded, you should indicate the interrater reliability scores in the APA methods section.
- ✓ Post a picture on Instagram
- ✓ Get the most likes on your picture
- ✓ Receive up to $300 cash back
APA Methods Section: Procedure
This part of the APA methods section indicates the methods you used to carry out the research, process the data, and analyze the results.
Research Design and Data Collection Methods
Data collection is the systematic gathering of observations and measurements, and you have to describe all procedures used in this process. You can use supplementary materials to describe long and complicated data collection methods.
When reporting the research design, you should mention the framework of the study. This could be experimental, longitudinal, correlational, or descriptive. Additionally, you should mention whether you used a between-subjects design or within-subjects design .
In this part of the APA methods section, you should also mention whether any masking methods were used to hide condition assignments from the participants.
- Participants are told the research takes an hour covers their personal experiences in school.
- They were assured that the reports would be confidential and were asked to give consent.
- The participants were asked to fill in questionnaires .
- The control group was given an unrelated filler task, after which they filled a questionnaire.
- It was determined the experiences of homosexual and CIS-gendered students varied.
Data diagnostics
This part of the APA method section outlines the steps taken to process the data. It includes:
- Methods of identifying and controlling outliers
- Data transformation procedures
- Methods of compensating for missing values
Analytic strategies
This subheading of the APA methods section describes the analytic strategies used, but you shouldn’t mention the outcomes. The primary and secondary hypotheses use past studies or theoretical frameworks , while exploratory hypotheses focus on the data in the study.
We started by assessing the demographic differences between the two groups. We also performed an independent samples t-test on the test scores .
What are the parts of an APA methods section?
In this section, you should include the study participants, the methods used, and the procedures.
What is included in the APA methods section?
The methods section covers the participants or subject characteristics, the sampling procedures, the sample size, the measures used, the data collection methods, the research design, the data analysis strategy, and the data processing method.
Should I use the Oxford comma when writing the APA methods section?
Yes, the serial comma is required when writing the APA methods section.
Should I use the first person to write the APA methods section?
Yes, the APA language guidelines encourage researchers to use first-person pronouns when writing the methods section.
Extremely satisfied, excellent deal with delivery in less than 24h. The print...
We use cookies on our website. Some of them are essential, while others help us to improve this website and your experience.
- External Media
Individual Privacy Preferences
Cookie Details Privacy Policy Imprint
Here you will find an overview of all cookies used. You can give your consent to whole categories or display further information and select certain cookies.
Accept all Save
Essential cookies enable basic functions and are necessary for the proper function of the website.
Show Cookie Information Hide Cookie Information
| Name | |
|---|---|
| Anbieter | Eigentümer dieser Website, |
| Zweck | Speichert die Einstellungen der Besucher, die in der Cookie Box von Borlabs Cookie ausgewählt wurden. |
| Cookie Name | borlabs-cookie |
| Cookie Laufzeit | 1 Jahr |
| Name | |
|---|---|
| Anbieter | Bachelorprint |
| Zweck | Erkennt das Herkunftsland und leitet zur entsprechenden Sprachversion um. |
| Datenschutzerklärung | |
| Host(s) | ip-api.com |
| Cookie Name | georedirect |
| Cookie Laufzeit | 1 Jahr |
| Name | |
|---|---|
| Anbieter | Playcanvas |
| Zweck | Display our 3D product animations |
| Datenschutzerklärung | |
| Host(s) | playcanv.as, playcanvas.as, playcanvas.com |
| Cookie Laufzeit | 1 Jahr |
Statistics cookies collect information anonymously. This information helps us to understand how our visitors use our website.
| Akzeptieren | |
|---|---|
| Name | |
| Anbieter | Google Ireland Limited, Gordon House, Barrow Street, Dublin 4, Ireland |
| Zweck | Cookie von Google zur Steuerung der erweiterten Script- und Ereignisbehandlung. |
| Datenschutzerklärung | |
| Cookie Name | _ga,_gat,_gid |
| Cookie Laufzeit | 2 Jahre |
Content from video platforms and social media platforms is blocked by default. If External Media cookies are accepted, access to those contents no longer requires manual consent.
| Akzeptieren | |
|---|---|
| Name | |
| Anbieter | Meta Platforms Ireland Limited, 4 Grand Canal Square, Dublin 2, Ireland |
| Zweck | Wird verwendet, um Facebook-Inhalte zu entsperren. |
| Datenschutzerklärung | |
| Host(s) | .facebook.com |
| Akzeptieren | |
|---|---|
| Name | |
| Anbieter | Google Ireland Limited, Gordon House, Barrow Street, Dublin 4, Ireland |
| Zweck | Wird zum Entsperren von Google Maps-Inhalten verwendet. |
| Datenschutzerklärung | |
| Host(s) | .google.com |
| Cookie Name | NID |
| Cookie Laufzeit | 6 Monate |
| Akzeptieren | |
|---|---|
| Name | |
| Anbieter | Meta Platforms Ireland Limited, 4 Grand Canal Square, Dublin 2, Ireland |
| Zweck | Wird verwendet, um Instagram-Inhalte zu entsperren. |
| Datenschutzerklärung | |
| Host(s) | .instagram.com |
| Cookie Name | pigeon_state |
| Cookie Laufzeit | Sitzung |
| Akzeptieren | |
|---|---|
| Name | |
| Anbieter | Openstreetmap Foundation, St John’s Innovation Centre, Cowley Road, Cambridge CB4 0WS, United Kingdom |
| Zweck | Wird verwendet, um OpenStreetMap-Inhalte zu entsperren. |
| Datenschutzerklärung | |
| Host(s) | .openstreetmap.org |
| Cookie Name | _osm_location, _osm_session, _osm_totp_token, _osm_welcome, _pk_id., _pk_ref., _pk_ses., qos_token |
| Cookie Laufzeit | 1-10 Jahre |
| Akzeptieren | |
|---|---|
| Name | |
| Anbieter | Twitter International Company, One Cumberland Place, Fenian Street, Dublin 2, D02 AX07, Ireland |
| Zweck | Wird verwendet, um Twitter-Inhalte zu entsperren. |
| Datenschutzerklärung | |
| Host(s) | .twimg.com, .twitter.com |
| Cookie Name | __widgetsettings, local_storage_support_test |
| Cookie Laufzeit | Unbegrenzt |
| Akzeptieren | |
|---|---|
| Name | |
| Anbieter | Vimeo Inc., 555 West 18th Street, New York, New York 10011, USA |
| Zweck | Wird verwendet, um Vimeo-Inhalte zu entsperren. |
| Datenschutzerklärung | |
| Host(s) | player.vimeo.com |
| Cookie Name | vuid |
| Cookie Laufzeit | 2 Jahre |
| Akzeptieren | |
|---|---|
| Name | |
| Anbieter | Google Ireland Limited, Gordon House, Barrow Street, Dublin 4, Ireland |
| Zweck | Wird verwendet, um YouTube-Inhalte zu entsperren. |
| Datenschutzerklärung | |
| Host(s) | google.com |
| Cookie Name | NID |
| Cookie Laufzeit | 6 Monate |
Privacy Policy Imprint
Generate accurate APA citations for free
- Knowledge Base
- APA Style 7th edition
- How to write an APA results section
Reporting Research Results in APA Style | Tips & Examples
Published on December 21, 2020 by Pritha Bhandari . Revised on January 17, 2024.
The results section of a quantitative research paper is where you summarize your data and report the findings of any relevant statistical analyses.
The APA manual provides rigorous guidelines for what to report in quantitative research papers in the fields of psychology, education, and other social sciences.
Use these standards to answer your research questions and report your data analyses in a complete and transparent way.
Instantly correct all language mistakes in your text
Upload your document to correct all your mistakes in minutes

Table of contents
What goes in your results section, introduce your data, summarize your data, report statistical results, presenting numbers effectively, what doesn’t belong in your results section, frequently asked questions about results in apa.
In APA style, the results section includes preliminary information about the participants and data, descriptive and inferential statistics, and the results of any exploratory analyses.
Include these in your results section:
- Participant flow and recruitment period. Report the number of participants at every stage of the study, as well as the dates when recruitment took place.
- Missing data . Identify the proportion of data that wasn’t included in your final analysis and state the reasons.
- Any adverse events. Make sure to report any unexpected events or side effects (for clinical studies).
- Descriptive statistics . Summarize the primary and secondary outcomes of the study.
- Inferential statistics , including confidence intervals and effect sizes. Address the primary and secondary research questions by reporting the detailed results of your main analyses.
- Results of subgroup or exploratory analyses, if applicable. Place detailed results in supplementary materials.
Write up the results in the past tense because you’re describing the outcomes of a completed research study.
Scribbr Citation Checker New
The AI-powered Citation Checker helps you avoid common mistakes such as:
- Missing commas and periods
- Incorrect usage of “et al.”
- Ampersands (&) in narrative citations
- Missing reference entries

Before diving into your research findings, first describe the flow of participants at every stage of your study and whether any data were excluded from the final analysis.
Participant flow and recruitment period
It’s necessary to report any attrition, which is the decline in participants at every sequential stage of a study. That’s because an uneven number of participants across groups sometimes threatens internal validity and makes it difficult to compare groups. Be sure to also state all reasons for attrition.
If your study has multiple stages (e.g., pre-test, intervention, and post-test) and groups (e.g., experimental and control groups), a flow chart is the best way to report the number of participants in each group per stage and reasons for attrition.
Also report the dates for when you recruited participants or performed follow-up sessions.
Missing data
Another key issue is the completeness of your dataset. It’s necessary to report both the amount and reasons for data that was missing or excluded.
Data can become unusable due to equipment malfunctions, improper storage, unexpected events, participant ineligibility, and so on. For each case, state the reason why the data were unusable.
Some data points may be removed from the final analysis because they are outliers—but you must be able to justify how you decided what to exclude.
If you applied any techniques for overcoming or compensating for lost data, report those as well.
Adverse events
For clinical studies, report all events with serious consequences or any side effects that occured.
Descriptive statistics summarize your data for the reader. Present descriptive statistics for each primary, secondary, and subgroup analysis.
Don’t provide formulas or citations for commonly used statistics (e.g., standard deviation) – but do provide them for new or rare equations.
Descriptive statistics
The exact descriptive statistics that you report depends on the types of data in your study. Categorical variables can be reported using proportions, while quantitative data can be reported using means and standard deviations . For a large set of numbers, a table is the most effective presentation format.
Include sample sizes (overall and for each group) as well as appropriate measures of central tendency and variability for the outcomes in your results section. For every point estimate , add a clearly labelled measure of variability as well.
Be sure to note how you combined data to come up with variables of interest. For every variable of interest, explain how you operationalized it.
According to APA journal standards, it’s necessary to report all relevant hypothesis tests performed, estimates of effect sizes, and confidence intervals.
When reporting statistical results, you should first address primary research questions before moving onto secondary research questions and any exploratory or subgroup analyses.
Present the results of tests in the order that you performed them—report the outcomes of main tests before post-hoc tests, for example. Don’t leave out any relevant results, even if they don’t support your hypothesis.
Inferential statistics
For each statistical test performed, first restate the hypothesis , then state whether your hypothesis was supported and provide the outcomes that led you to that conclusion.
Report the following for each hypothesis test:
- the test statistic value,
- the degrees of freedom ,
- the exact p- value (unless it is less than 0.001),
- the magnitude and direction of the effect.
When reporting complex data analyses, such as factor analysis or multivariate analysis, present the models estimated in detail, and state the statistical software used. Make sure to report any violations of statistical assumptions or problems with estimation.
Effect sizes and confidence intervals
For each hypothesis test performed, you should present confidence intervals and estimates of effect sizes .
Confidence intervals are useful for showing the variability around point estimates. They should be included whenever you report population parameter estimates.
Effect sizes indicate how impactful the outcomes of a study are. But since they are estimates, it’s recommended that you also provide confidence intervals of effect sizes.
Subgroup or exploratory analyses
Briefly report the results of any other planned or exploratory analyses you performed. These may include subgroup analyses as well.
Subgroup analyses come with a high chance of false positive results, because performing a large number of comparison or correlation tests increases the chances of finding significant results.
If you find significant results in these analyses, make sure to appropriately report them as exploratory (rather than confirmatory) results to avoid overstating their importance.
While these analyses can be reported in less detail in the main text, you can provide the full analyses in supplementary materials.
Are your APA in-text citations flawless?
The AI-powered APA Citation Checker points out every error, tells you exactly what’s wrong, and explains how to fix it. Say goodbye to losing marks on your assignment!
Get started!
To effectively present numbers, use a mix of text, tables , and figures where appropriate:
- To present three or fewer numbers, try a sentence ,
- To present between 4 and 20 numbers, try a table ,
- To present more than 20 numbers, try a figure .
Since these are general guidelines, use your own judgment and feedback from others for effective presentation of numbers.
Tables and figures should be numbered and have titles, along with relevant notes. Make sure to present data only once throughout the paper and refer to any tables and figures in the text.
Formatting statistics and numbers
It’s important to follow capitalization , italicization, and abbreviation rules when referring to statistics in your paper. There are specific format guidelines for reporting statistics in APA , as well as general rules about writing numbers .
If you are unsure of how to present specific symbols, look up the detailed APA guidelines or other papers in your field.
It’s important to provide a complete picture of your data analyses and outcomes in a concise way. For that reason, raw data and any interpretations of your results are not included in the results section.
It’s rarely appropriate to include raw data in your results section. Instead, you should always save the raw data securely and make them available and accessible to any other researchers who request them.
Making scientific research available to others is a key part of academic integrity and open science.
Interpretation or discussion of results
This belongs in your discussion section. Your results section is where you objectively report all relevant findings and leave them open for interpretation by readers.
While you should state whether the findings of statistical tests lend support to your hypotheses, refrain from forming conclusions to your research questions in the results section.
Explanation of how statistics tests work
For the sake of concise writing, you can safely assume that readers of your paper have professional knowledge of how statistical inferences work.
In an APA results section , you should generally report the following:
- Participant flow and recruitment period.
- Missing data and any adverse events.
- Descriptive statistics about your samples.
- Inferential statistics , including confidence intervals and effect sizes.
- Results of any subgroup or exploratory analyses, if applicable.
According to the APA guidelines, you should report enough detail on inferential statistics so that your readers understand your analyses.
- the test statistic value
- the degrees of freedom
- the exact p value (unless it is less than 0.001)
- the magnitude and direction of the effect
You should also present confidence intervals and estimates of effect sizes where relevant.
In APA style, statistics can be presented in the main text or as tables or figures . To decide how to present numbers, you can follow APA guidelines:
- To present three or fewer numbers, try a sentence,
- To present between 4 and 20 numbers, try a table,
- To present more than 20 numbers, try a figure.
Results are usually written in the past tense , because they are describing the outcome of completed actions.
The results chapter or section simply and objectively reports what you found, without speculating on why you found these results. The discussion interprets the meaning of the results, puts them in context, and explains why they matter.
In qualitative research , results and discussion are sometimes combined. But in quantitative research , it’s considered important to separate the objective results from your interpretation of them.
Cite this Scribbr article
If you want to cite this source, you can copy and paste the citation or click the “Cite this Scribbr article” button to automatically add the citation to our free Citation Generator.
Bhandari, P. (2024, January 17). Reporting Research Results in APA Style | Tips & Examples. Scribbr. Retrieved August 12, 2024, from https://www.scribbr.com/apa-style/results-section/
Is this article helpful?

Pritha Bhandari
Other students also liked, how to write an apa methods section, how to format tables and figures in apa style, reporting statistics in apa style | guidelines & examples, scribbr apa citation checker.
An innovative new tool that checks your APA citations with AI software. Say goodbye to inaccurate citations!
- Formatting Guides
- APA Methods Section: Guide on How to Write & Tips & Examples
- Speech Topics
- Basics of Essay Writing
- Essay Topics
- Other Essays
- Main Academic Essays
- Research Paper Topics
- Basics of Research Paper Writing
- Miscellaneous
- Chicago/ Turabian
- Data & Statistics
- Methodology
- Admission Writing Tips
- Admission Advice
- Other Guides
- Student Life
- Studying Tips
- Understanding Plagiarism
- Academic Writing Tips
- Basics of Dissertation & Thesis Writing
- Essay Guides
- Research Paper Guides
- Basics of Research Process
- Admission Guides
- Dissertation & Thesis Guides
APA Methods Section: Guide on How to Write & Tips & Examples

Table of contents
Use our free Readability checker
The methods section of an APA-style paper is where you describe in detail how you conducted your research. This includes details about the participants, materials, and procedures used during the study. APA style provides distinct instructions on how to format your methodology section.
In this guide, you will learn how to format an APA methods section and see the overall layout. You will also find examples of various elements within the APA methods section as well as explanations of how to structure each element.
APA Methods Section: Overview
Methods section APA also provides information on the methodology of a study. This information shows some results of participants. Along with the name of a methodology used. You should include thorough information on your sample, measurements , and techniques utilized in your paper. So that others may understand and reproduce your study.
Methods Section APA: Major Subsections
APA style methods section includes specific details of research and an approach you used. The techniques and processes employed in a research study or experiment are described in this part of your research paper. This part of an article is crucial. It lets other researchers understand exactly how you did your study. It also allows them to replicate an experiment and evaluate other techniques that could generate different findings. You may need one more blog on how to write a results section APA , you will find it on our platform.
APA Methods Section: Participants
One of the main APA paper methods sections is the participant’s section. Here, a subject, its characteristics, power, and size are described. For example, the number of female (or male) participants. The age range and average age. The percentage of participants who belong to various ethnic groups. It can be "Caucasian," "African American," "Latino/a," "East Asian," "Indian," "Native American," and "other". Ethnic group names should be capitalized because they are proper nouns. When describing a group of individuals, the correct form is to use a term that is widely accepted by that group. Just in case, remember that StudyCrumb's APA paper writer can figure out the methods section for you at any time.
APA Methodology: Apparatus and Materials
APA Methodology apparatus and materials provide the primary and secondary data or measurements. They allow organically measure the tests conducted on a study. In this part, you should provide a description of any equipment or physical settings that were important aspects of your study. If you are conducting a study that involves precise measurement, you will want to be very specific about equipment you used. For example, if you are measuring how quickly a participant responds to a stimulus on a computer screen, you need to describe some software you are using, important characteristics of a monitor (size, refresh rate, contrast, etc.), and distance of participants from this monitor. Do not bother describing the size of a room you used. Or its general layout unless these are important to your study.
APA Methods Section: Procedure
Writing a methods section APA also constitutes procedure. It includes research, design, and analysis that fully complement the study in question. A researcher offers a step-by-step account of a participants' experience. Do not include any data analysis or other research activity that does not directly involve the participants. Do not know how to format statistics? Use one more blog on our platform that will explain everything about reporting statistics in APA .
How to Format APA Methods Section
The APA methods section format constitutes intervals, deviations, and specific fonts. It allows for some deeper characterization of study. Subheadings should be used to separate method sections into subsections. Participants, materials, design, and technique are typical subsections. Each subsection has its own heading, proper formatting of which is described in the APA manual.
APA Methods Section Example
Sample methods section APA has variables and control analysis through quantitative reasoning. You should offer enough information. So that your study can be reproduced in all of its key aspects. However, you should leave out parts of your research that are unlikely to affect the conclusion. Such as exact room temperature, room color, and furniture specifics (assuming they are not independent variables). Furthermore, you should avoid repeating material that has already been provided in another part. Do not describe your questionnaire in the Procedure paragraph if you discuss it in the Materials subsection.
APA Methods Section: Bottom Line
So, methods Section APA has its goal, and rules you should stick to. Its purpose is to clearly display what approaches you used in your experiment. Also, what people participated in it, and what you did in your research overall. It doesn’t have a general format or edition. Yet formatting is done through wider understanding of how APA referencing works.

To get the perfect APA methods section done, use our writing services. And never miss a deadline on your project! Our professional writers can help you deal with your work timely.
Frequently Asked Questions About APA Methods Section
1. how long should an apa method section be.
To answer how long is methods section APA, it doesn’t have some fixed length but make sure you write in concise words.
2. What tense should I use in APA methods section?
An APA methods section should use past tense. You need to show completed actions of a methodology. Even if you haven't finished your research yet.
3. Where does the methodology section go in a research paper?
Methodology section of any research paper goes between the introduction and the conclusion. Usually, it goes normally in chapter 3 after literature review.
4. What are the differences between an APA methods section and results section?
An APA methods section describes procedure while results section describes some measurements taken.

Emma Flores knows all about formatting standards. She shares with StudyCrumb readers tips on creating academic papers that will meet high-quality standards.
You may also like

Educational resources and simple solutions for your research journey

How to Write the Methods Section of a Research Paper
Writing a research paper is both an art and a skill, and knowing how to write the methods section of a research paper is the first crucial step in mastering scientific writing. If, like the majority of early career researchers, you believe that the methods section is the simplest to write and needs little in the way of careful consideration or thought, this article will help you understand it is not 1 .
We have all probably asked our supervisors, coworkers, or search engines “ how to write a methods section of a research paper ” at some point in our scientific careers, so you are not alone if that’s how you ended up here. Even for seasoned researchers, selecting what to include in the methods section from a wealth of experimental information can occasionally be a source of distress and perplexity.
Additionally, journal specifications, in some cases, may make it more of a requirement rather than a choice to provide a selective yet descriptive account of the experimental procedure. Hence, knowing these nuances of how to write the methods section of a research paper is critical to its success. The methods section of the research paper is not supposed to be a detailed heavy, dull section that some researchers tend to write; rather, it should be the central component of the study that justifies the validity and reliability of the research.
Are you still unsure of how the methods section of a research paper forms the basis of every investigation? Consider the last article you read but ignore the methods section and concentrate on the other parts of the paper . Now think whether you could repeat the study and be sure of the credibility of the findings despite knowing the literature review and even having the data in front of you. You have the answer!

Having established the importance of the methods section , the next question is how to write the methods section of a research paper that unifies the overall study. The purpose of the methods section , which was earlier called as Materials and Methods , is to describe how the authors went about answering the “research question” at hand. Here, the objective is to tell a coherent story that gives a detailed account of how the study was conducted, the rationale behind specific experimental procedures, the experimental setup, objects (variables) involved, the research protocol employed, tools utilized to measure, calculations and measurements, and the analysis of the collected data 2 .
In this article, we will take a deep dive into this topic and provide a detailed overview of how to write the methods section of a research paper . For the sake of clarity, we have separated the subject into various sections with corresponding subheadings.
Table of Contents
What is the methods section of a research paper ?
The methods section is a fundamental section of any paper since it typically discusses the ‘ what ’, ‘ how ’, ‘ which ’, and ‘ why ’ of the study, which is necessary to arrive at the final conclusions. In a research article, the introduction, which serves to set the foundation for comprehending the background and results is usually followed by the methods section, which precedes the result and discussion sections. The methods section must explicitly state what was done, how it was done, which equipment, tools and techniques were utilized, how were the measurements/calculations taken, and why specific research protocols, software, and analytical methods were employed.
Why is the methods section important?
The primary goal of the methods section is to provide pertinent details about the experimental approach so that the reader may put the results in perspective and, if necessary, replicate the findings 3 . This section offers readers the chance to evaluate the reliability and validity of any study. In short, it also serves as the study’s blueprint, assisting researchers who might be unsure about any other portion in establishing the study’s context and validity. The methods plays a rather crucial role in determining the fate of the article; an incomplete and unreliable methods section can frequently result in early rejections and may lead to numerous rounds of modifications during the publication process. This means that the reviewers also often use methods section to assess the reliability and validity of the research protocol and the data analysis employed to address the research topic. In other words, the purpose of the methods section is to demonstrate the research acumen and subject-matter expertise of the author(s) in their field.
Structure of methods section of a research paper
Similar to the research paper, the methods section also follows a defined structure; this may be dictated by the guidelines of a specific journal or can be presented in a chronological or thematic manner based on the study type. When writing the methods section , authors should keep in mind that they are telling a story about how the research was conducted. They should only report relevant information to avoid confusing the reader and include details that would aid in connecting various aspects of the entire research activity together. It is generally advisable to present experiments in the order in which they were conducted. This facilitates the logical flow of the research and allows readers to follow the progression of the study design.

It is also essential to clearly state the rationale behind each experiment and how the findings of earlier experiments informed the design or interpretation of later experiments. This allows the readers to understand the overall purpose of the study design and the significance of each experiment within that context. However, depending on the particular research question and method, it may make sense to present information in a different order; therefore, authors must select the best structure and strategy for their individual studies.
In cases where there is a lot of information, divide the sections into subheadings to cover the pertinent details. If the journal guidelines pose restrictions on the word limit , additional important information can be supplied in the supplementary files. A simple rule of thumb for sectioning the method section is to begin by explaining the methodological approach ( what was done ), describing the data collection methods ( how it was done ), providing the analysis method ( how the data was analyzed ), and explaining the rationale for choosing the methodological strategy. This is described in detail in the upcoming sections.
How to write the methods section of a research paper
Contrary to widespread assumption, the methods section of a research paper should be prepared once the study is complete to prevent missing any key parameter. Hence, please make sure that all relevant experiments are done before you start writing a methods section . The next step for authors is to look up any applicable academic style manuals or journal-specific standards to ensure that the methods section is formatted correctly. The methods section of a research paper typically constitutes materials and methods; while writing this section, authors usually arrange the information under each category.
The materials category describes the samples, materials, treatments, and instruments, while experimental design, sample preparation, data collection, and data analysis are a part of the method category. According to the nature of the study, authors should include additional subsections within the methods section, such as ethical considerations like the declaration of Helsinki (for studies involving human subjects), demographic information of the participants, and any other crucial information that can affect the output of the study. Simply put, the methods section has two major components: content and format. Here is an easy checklist for you to consider if you are struggling with how to write the methods section of a research paper .
- Explain the research design, subjects, and sample details
- Include information on inclusion and exclusion criteria
- Mention ethical or any other permission required for the study
- Include information about materials, experimental setup, tools, and software
- Add details of data collection and analysis methods
- Incorporate how research biases were avoided or confounding variables were controlled
- Evaluate and justify the experimental procedure selected to address the research question
- Provide precise and clear details of each experiment
- Flowcharts, infographics, or tables can be used to present complex information
- Use past tense to show that the experiments have been done
- Follow academic style guides (such as APA or MLA ) to structure the content
- Citations should be included as per standard protocols in the field
Now that you know how to write the methods section of a research paper , let’s address another challenge researchers face while writing the methods section —what to include in the methods section . How much information is too much is not always obvious when it comes to trying to include data in the methods section of a paper. In the next section, we examine this issue and explore potential solutions.

What to include in the methods section of a research paper
The technical nature of the methods section occasionally makes it harder to present the information clearly and concisely while staying within the study context. Many young researchers tend to veer off subject significantly, and they frequently commit the sin of becoming bogged down in itty bitty details, making the text harder to read and impairing its overall flow. However, the best way to write the methods section is to start with crucial components of the experiments. If you have trouble deciding which elements are essential, think about leaving out those that would make it more challenging to comprehend the context or replicate the results. The top-down approach helps to ensure all relevant information is incorporated and vital information is not lost in technicalities. Next, remember to add details that are significant to assess the validity and reliability of the study. Here is a simple checklist for you to follow ( bonus tip: you can also make a checklist for your own study to avoid missing any critical information while writing the methods section ).
- Structuring the methods section : Authors should diligently follow journal guidelines and adhere to the specific author instructions provided when writing the methods section . Journals typically have specific guidelines for formatting the methods section ; for example, Frontiers in Plant Sciences advises arranging the materials and methods section by subheading and citing relevant literature. There are several standardized checklists available for different study types in the biomedical field, including CONSORT (Consolidated Standards of Reporting Trials) for randomized clinical trials, PRISMA (Preferred Reporting Items for Systematic reviews and Meta-Analysis) for systematic reviews and meta-analysis, and STROBE (STrengthening the Reporting of OBservational studies in Epidemiology) for cohort, case-control, cross-sectional studies. Before starting the methods section , check the checklist available in your field that can function as a guide.
- Organizing different sections to tell a story : Once you are sure of the format required for structuring the methods section , the next is to present the sections in a logical manner; as mentioned earlier, the sections can be organized according to the chronology or themes. In the chronological arrangement, you should discuss the methods in accordance with how the experiments were carried out. An example of the method section of a research paper of an animal study should first ideally include information about the species, weight, sex, strain, and age. Next, the number of animals, their initial conditions, and their living and housing conditions should also be mentioned. Second, how the groups are assigned and the intervention (drug treatment, stress, or other) given to each group, and finally, the details of tools and techniques used to measure, collect, and analyze the data. Experiments involving animal or human subjects should additionally state an ethics approval statement. It is best to arrange the section using the thematic approach when discussing distinct experiments not following a sequential order.
- Define and explain the objects and procedure: Experimental procedure should clearly be stated in the methods section . Samples, necessary preparations (samples, treatment, and drug), and methods for manipulation need to be included. All variables (control, dependent, independent, and confounding) must be clearly defined, particularly if the confounding variables can affect the outcome of the study.
- Match the order of the methods section with the order of results: Though not mandatory, organizing the manuscript in a logical and coherent manner can improve the readability and clarity of the paper. This can be done by following a consistent structure throughout the manuscript; readers can easily navigate through the different sections and understand the methods and results in relation to each other. Using experiment names as headings for both the methods and results sections can also make it simpler for readers to locate specific information and corroborate it if needed.
- Relevant information must always be included: The methods section should have information on all experiments conducted and their details clearly mentioned. Ask the journal whether there is a way to offer more information in the supplemental files or external repositories if your target journal has strict word limitations. For example, Nature communications encourages authors to deposit their step-by-step protocols in an open-resource depository, Protocol Exchange which allows the protocols to be linked with the manuscript upon publication. Providing access to detailed protocols also helps to increase the transparency and reproducibility of the research.
- It’s all in the details: The methods section should meticulously list all the materials, tools, instruments, and software used for different experiments. Specify the testing equipment on which data was obtained, together with its manufacturer’s information, location, city, and state or any other stimuli used to manipulate the variables. Provide specifics on the research process you employed; if it was a standard protocol, cite previous studies that also used the protocol. Include any protocol modifications that were made, as well as any other factors that were taken into account when planning the study or gathering data. Any new or modified techniques should be explained by the authors. Typically, readers evaluate the reliability and validity of the procedures using the cited literature, and a widely accepted checklist helps to support the credibility of the methodology. Note: Authors should include a statement on sample size estimation (if applicable), which is often missed. It enables the reader to determine how many subjects will be required to detect the expected change in the outcome variables within a given confidence interval.
- Write for the audience: While explaining the details in the methods section , authors should be mindful of their target audience, as some of the rationale or assumptions on which specific procedures are based might not always be obvious to the audience, particularly for a general audience. Therefore, when in doubt, the objective of a procedure should be specified either in relation to the research question or to the entire protocol.
- Data interpretation and analysis : Information on data processing, statistical testing, levels of significance, and analysis tools and software should be added. Mention if the recommendations and expertise of an experienced statistician were followed. Also, evaluate and justify the preferred statistical method used in the study and its significance.
What NOT to include in the methods section of a research paper
To address “ how to write the methods section of a research paper ”, authors should not only pay careful attention to what to include but also what not to include in the methods section of a research paper . Here is a list of do not’s when writing the methods section :
- Do not elaborate on specifics of standard methods/procedures: You should refrain from adding unnecessary details of experiments and practices that are well established and cited previously. Instead, simply cite relevant literature or mention if the manufacturer’s protocol was followed.
- Do not add unnecessary details : Do not include minute details of the experimental procedure and materials/instruments used that are not significant for the outcome of the experiment. For example, there is no need to mention the brand name of the water bath used for incubation.
- Do not discuss the results: The methods section is not to discuss the results or refer to the tables and figures; save it for the results and discussion section. Also, focus on the methods selected to conduct the study and avoid diverting to other methods or commenting on their pros or cons.
- Do not make the section bulky : For extensive methods and protocols, provide the essential details and share the rest of the information in the supplemental files. The writing should be clear yet concise to maintain the flow of the section.
We hope that by this point, you understand how crucial it is to write a thoughtful and precise methods section and the ins and outs of how to write the methods section of a research paper . To restate, the entire purpose of the methods section is to enable others to reproduce the results or verify the research. We sincerely hope that this post has cleared up any confusion and given you a fresh perspective on the methods section .
As a parting gift, we’re leaving you with a handy checklist that will help you understand how to write the methods section of a research paper . Feel free to download this checklist and use or share this with those who you think may benefit from it.
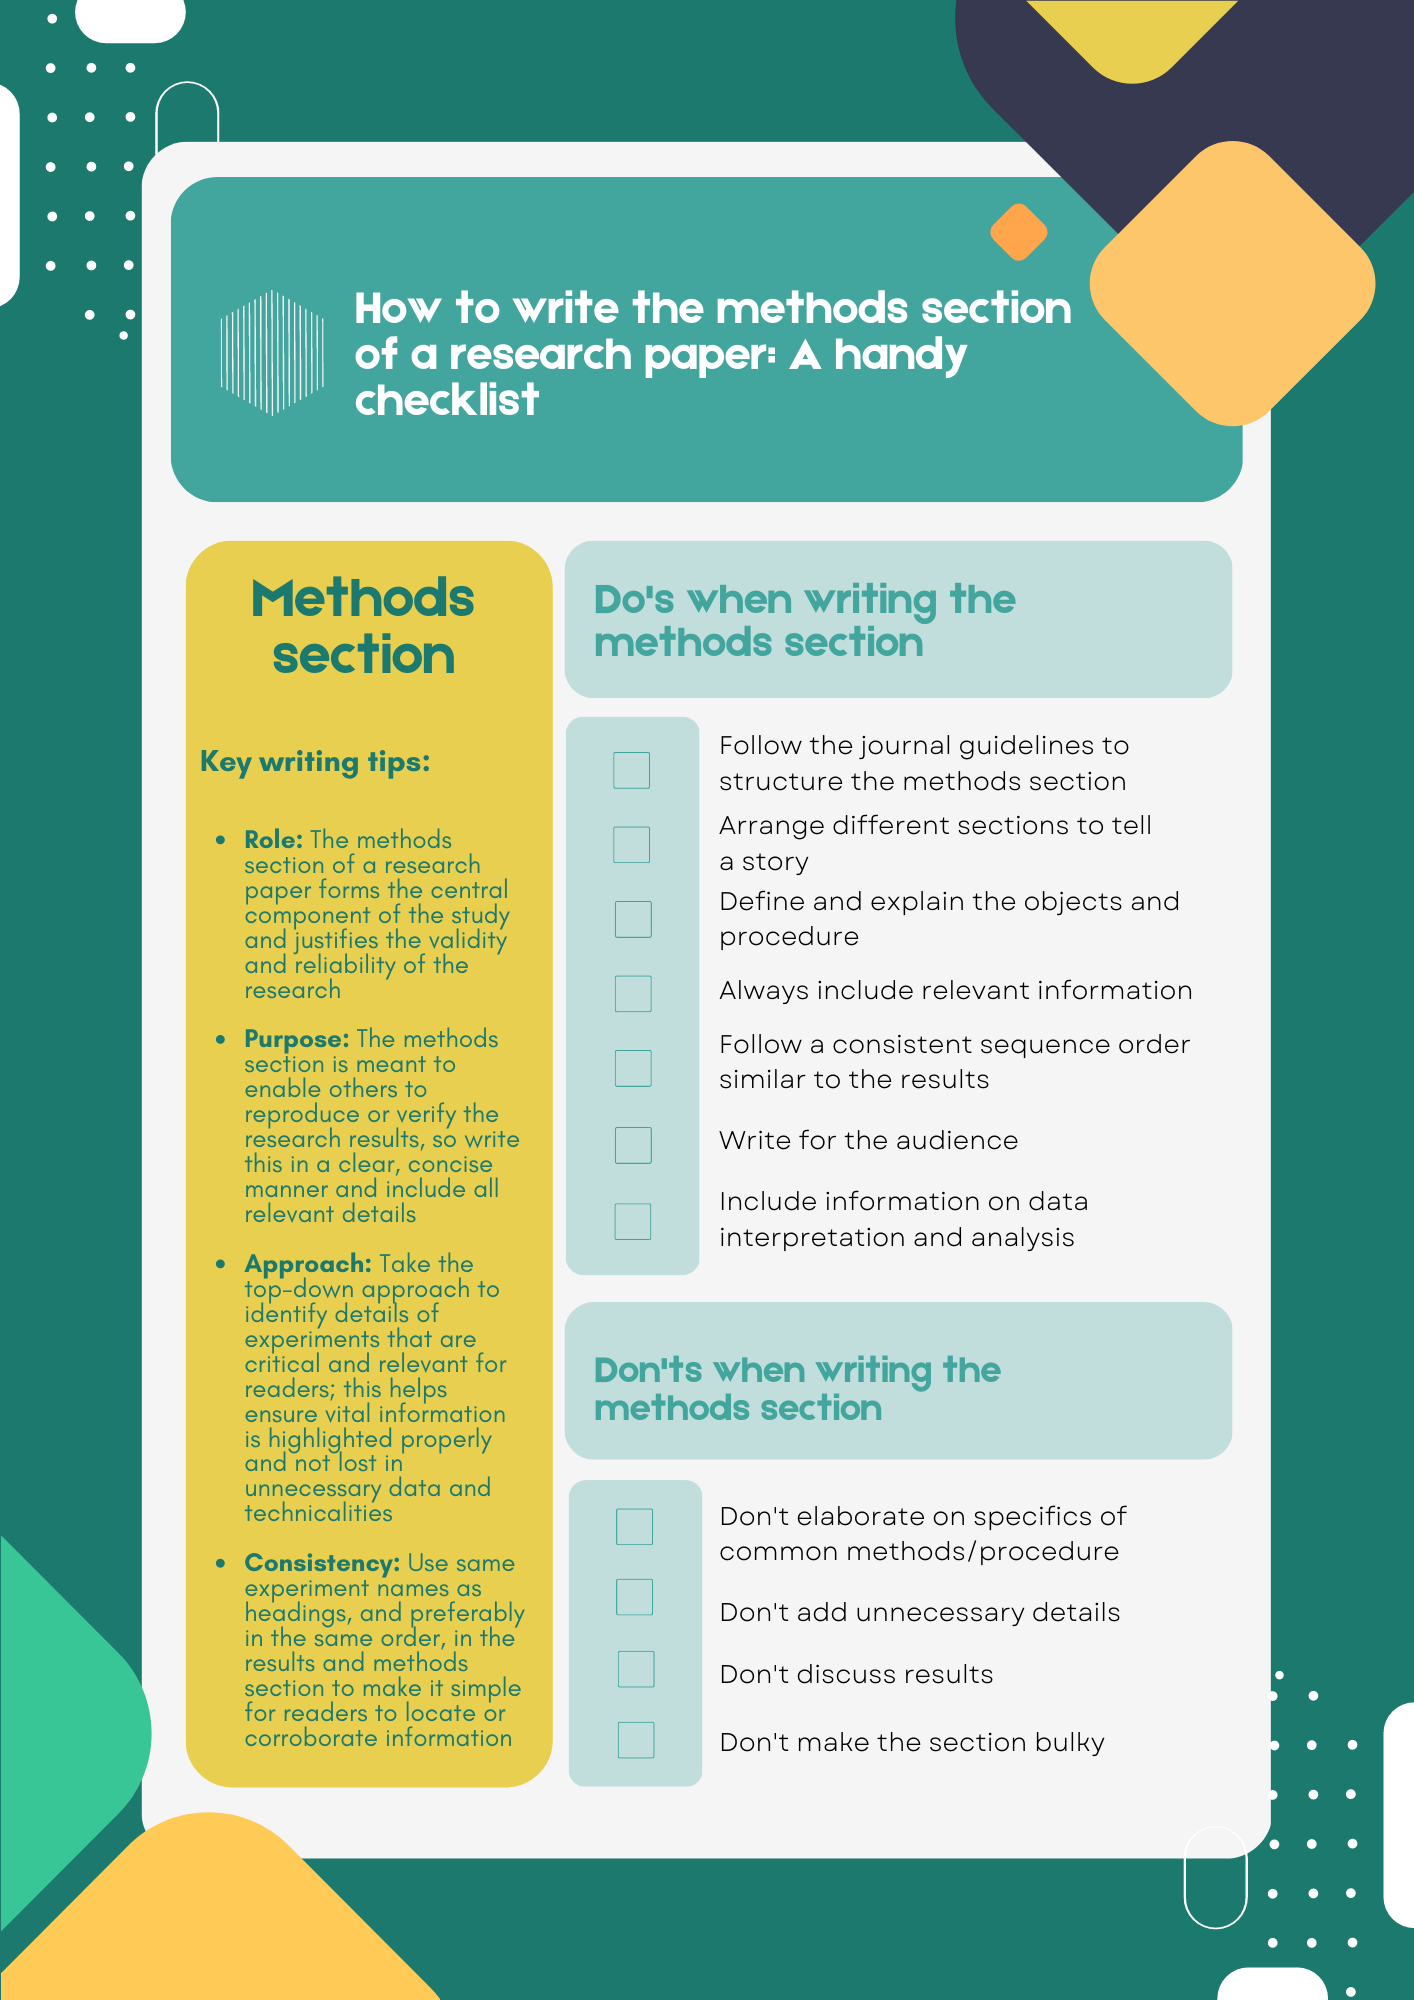
References
- Bhattacharya, D. How to write the Methods section of a research paper. Editage Insights, 2018. https://www.editage.com/insights/how-to-write-the-methods-section-of-a-research-paper (2018).
- Kallet, R. H. How to Write the Methods Section of a Research Paper. Respiratory Care 49, 1229–1232 (2004). https://pubmed.ncbi.nlm.nih.gov/15447808/
- Grindstaff, T. L. & Saliba, S. A. AVOIDING MANUSCRIPT MISTAKES. Int J Sports Phys Ther 7, 518–524 (2012). https://www.ncbi.nlm.nih.gov/pmc/articles/PMC3474299/
Editage All Access is a subscription-based platform that unifies the best AI tools and services designed to speed up, simplify, and streamline every step of a researcher’s journey. The Editage All Access Pack is a one-of-a-kind subscription that unlocks full access to an AI writing assistant, literature recommender, journal finder, scientific illustration tool, and exclusive discounts on professional publication services from Editage.
Based on 22+ years of experience in academia, Editage All Access empowers researchers to put their best research forward and move closer to success. Explore our top AI Tools pack, AI Tools + Publication Services pack, or Build Your Own Plan. Find everything a researcher needs to succeed, all in one place – Get All Access now starting at just $14 a month !
Related Posts

What are the Best Research Funding Sources

Inductive vs. Deductive Research Approach
Lab Report Format: Step-by-Step Guide & Examples
Saul McLeod, PhD
Editor-in-Chief for Simply Psychology
BSc (Hons) Psychology, MRes, PhD, University of Manchester
Saul McLeod, PhD., is a qualified psychology teacher with over 18 years of experience in further and higher education. He has been published in peer-reviewed journals, including the Journal of Clinical Psychology.
Learn about our Editorial Process
Olivia Guy-Evans, MSc
Associate Editor for Simply Psychology
BSc (Hons) Psychology, MSc Psychology of Education
Olivia Guy-Evans is a writer and associate editor for Simply Psychology. She has previously worked in healthcare and educational sectors.
On This Page:
In psychology, a lab report outlines a study’s objectives, methods, results, discussion, and conclusions, ensuring clarity and adherence to APA (or relevant) formatting guidelines.
A typical lab report would include the following sections: title, abstract, introduction, method, results, and discussion.
The title page, abstract, references, and appendices are started on separate pages (subsections from the main body of the report are not). Use double-line spacing of text, font size 12, and include page numbers.
The report should have a thread of arguments linking the prediction in the introduction to the content of the discussion.
This must indicate what the study is about. It must include the variables under investigation. It should not be written as a question.
Title pages should be formatted in APA style .
The abstract provides a concise and comprehensive summary of a research report. Your style should be brief but not use note form. Look at examples in journal articles . It should aim to explain very briefly (about 150 words) the following:
- Start with a one/two sentence summary, providing the aim and rationale for the study.
- Describe participants and setting: who, when, where, how many, and what groups?
- Describe the method: what design, what experimental treatment, what questionnaires, surveys, or tests were used.
- Describe the major findings, including a mention of the statistics used and the significance levels, or simply one sentence summing up the outcome.
- The final sentence(s) outline the study’s “contribution to knowledge” within the literature. What does it all mean? Mention the implications of your findings if appropriate.
The abstract comes at the beginning of your report but is written at the end (as it summarises information from all the other sections of the report).
Introduction
The purpose of the introduction is to explain where your hypothesis comes from (i.e., it should provide a rationale for your research study).
Ideally, the introduction should have a funnel structure: Start broad and then become more specific. The aims should not appear out of thin air; the preceding review of psychological literature should lead logically into the aims and hypotheses.

- Start with general theory, briefly introducing the topic. Define the important key terms.
- Explain the theoretical framework.
- Summarise and synthesize previous studies – What was the purpose? Who were the participants? What did they do? What did they find? What do these results mean? How do the results relate to the theoretical framework?
- Rationale: How does the current study address a gap in the literature? Perhaps it overcomes a limitation of previous research.
- Aims and hypothesis. Write a paragraph explaining what you plan to investigate and make a clear and concise prediction regarding the results you expect to find.
There should be a logical progression of ideas that aids the flow of the report. This means the studies outlined should lead logically to your aims and hypotheses.
Do be concise and selective, and avoid the temptation to include anything in case it is relevant (i.e., don’t write a shopping list of studies).
USE THE FOLLOWING SUBHEADINGS:
Participants
- How many participants were recruited?
- Say how you obtained your sample (e.g., opportunity sample).
- Give relevant demographic details (e.g., gender, ethnicity, age range, mean age, and standard deviation).
- State the experimental design .
- What were the independent and dependent variables ? Make sure the independent variable is labeled and name the different conditions/levels.
- For example, if gender is the independent variable label, then male and female are the levels/conditions/groups.
- How were the IV and DV operationalized?
- Identify any controls used, e.g., counterbalancing and control of extraneous variables.
- List all the materials and measures (e.g., what was the title of the questionnaire? Was it adapted from a study?).
- You do not need to include wholesale replication of materials – instead, include a ‘sensible’ (illustrate) level of detail. For example, give examples of questionnaire items.
- Include the reliability (e.g., alpha values) for the measure(s).
- Describe the precise procedure you followed when conducting your research, i.e., exactly what you did.
- Describe in sufficient detail to allow for replication of findings.
- Be concise in your description and omit extraneous/trivial details, e.g., you don’t need to include details regarding instructions, debrief, record sheets, etc.
- Assume the reader has no knowledge of what you did and ensure that he/she can replicate (i.e., copy) your study exactly by what you write in this section.
- Write in the past tense.
- Don’t justify or explain in the Method (e.g., why you chose a particular sampling method); just report what you did.
- Only give enough detail for someone to replicate the experiment – be concise in your writing.
- The results section of a paper usually presents descriptive statistics followed by inferential statistics.
- Report the means, standard deviations, and 95% confidence intervals (CIs) for each IV level. If you have four to 20 numbers to present, a well-presented table is best, APA style.
- Name the statistical test being used.
- Report appropriate statistics (e.g., t-scores, p values ).
- Report the magnitude (e.g., are the results significant or not?) as well as the direction of the results (e.g., which group performed better?).
- It is optional to report the effect size (this does not appear on the SPSS output).
- Avoid interpreting the results (save this for the discussion).
- Make sure the results are presented clearly and concisely. A table can be used to display descriptive statistics if this makes the data easier to understand.
- DO NOT include any raw data.
- Follow APA style.
Use APA Style
- Numbers reported to 2 d.p. (incl. 0 before the decimal if 1.00, e.g., “0.51”). The exceptions to this rule: Numbers which can never exceed 1.0 (e.g., p -values, r-values): report to 3 d.p. and do not include 0 before the decimal place, e.g., “.001”.
- Percentages and degrees of freedom: report as whole numbers.
- Statistical symbols that are not Greek letters should be italicized (e.g., M , SD , t , X 2 , F , p , d ).
- Include spaces on either side of the equals sign.
- When reporting 95%, CIs (confidence intervals), upper and lower limits are given inside square brackets, e.g., “95% CI [73.37, 102.23]”
- Outline your findings in plain English (avoid statistical jargon) and relate your results to your hypothesis, e.g., is it supported or rejected?
- Compare your results to background materials from the introduction section. Are your results similar or different? Discuss why/why not.
- How confident can we be in the results? Acknowledge limitations, but only if they can explain the result obtained. If the study has found a reliable effect, be very careful suggesting limitations as you are doubting your results. Unless you can think of any c onfounding variable that can explain the results instead of the IV, it would be advisable to leave the section out.
- Suggest constructive ways to improve your study if appropriate.
- What are the implications of your findings? Say what your findings mean for how people behave in the real world.
- Suggest an idea for further research triggered by your study, something in the same area but not simply an improved version of yours. Perhaps you could base this on a limitation of your study.
- Concluding paragraph – Finish with a statement of your findings and the key points of the discussion (e.g., interpretation and implications) in no more than 3 or 4 sentences.
Reference Page
The reference section lists all the sources cited in the essay (alphabetically). It is not a bibliography (a list of the books you used).
In simple terms, every time you refer to a psychologist’s name (and date), you need to reference the original source of information.
If you have been using textbooks this is easy as the references are usually at the back of the book and you can just copy them down. If you have been using websites then you may have a problem as they might not provide a reference section for you to copy.
References need to be set out APA style :
Author, A. A. (year). Title of work . Location: Publisher.
Journal Articles
Author, A. A., Author, B. B., & Author, C. C. (year). Article title. Journal Title, volume number (issue number), page numbers
A simple way to write your reference section is to use Google scholar . Just type the name and date of the psychologist in the search box and click on the “cite” link.

Next, copy and paste the APA reference into the reference section of your essay.

Once again, remember that references need to be in alphabetical order according to surname.
Psychology Lab Report Example
Quantitative paper template.
Quantitative professional paper template: Adapted from “Fake News, Fast and Slow: Deliberation Reduces Belief in False (but Not True) News Headlines,” by B. Bago, D. G. Rand, and G. Pennycook, 2020, Journal of Experimental Psychology: General , 149 (8), pp. 1608–1613 ( https://doi.org/10.1037/xge0000729 ). Copyright 2020 by the American Psychological Association.
Qualitative paper template
Qualitative professional paper template: Adapted from “‘My Smartphone Is an Extension of Myself’: A Holistic Qualitative Exploration of the Impact of Using a Smartphone,” by L. J. Harkin and D. Kuss, 2020, Psychology of Popular Media , 10 (1), pp. 28–38 ( https://doi.org/10.1037/ppm0000278 ). Copyright 2020 by the American Psychological Association.

An official website of the United States government
The .gov means it’s official. Federal government websites often end in .gov or .mil. Before sharing sensitive information, make sure you’re on a federal government site.
The site is secure. The https:// ensures that you are connecting to the official website and that any information you provide is encrypted and transmitted securely.
- Publications
- Account settings
Preview improvements coming to the PMC website in October 2024. Learn More or Try it out now .
- Advanced Search
- Journal List
- J Grad Med Educ
- v.4(1); 2012 Mar
Qualitative Research Part II: Participants, Analysis, and Quality Assurance
This is the second of a two-part series on qualitative research. Part 1 in the December 2011 issue of Journal of Graduate Medical Education provided an introduction to the topic and compared characteristics of quantitative and qualitative research, identified common data collection approaches, and briefly described data analysis and quality assessment techniques. Part II describes in more detail specific techniques and methods used to select participants, analyze data, and ensure research quality and rigor.
If you are relatively new to qualitative research, some references you may find especially helpful are provided below. The two texts by Creswell 2008 and 2009 are clear and practical. 1 , 2 In 2008, the British Medical Journal offered a series of short essays on qualitative research; the references provided are easily read and digested. 3 – , 8 For those wishing to pursue qualitative research in more detail, a suggestion is to start with the appropriate chapters in Creswell 2008, 1 and then move to the other texts suggested. 9 – , 11
To summarize the previous editorial, while quantitative research focuses predominantly on the impact of an intervention and generally answers questions like “did it work?” and “what was the outcome?”, qualitative research focuses on understanding the intervention or phenomenon and exploring questions like “why was this effective or not?” and “how is this helpful for learning?” The intent of qualitative research is to contribute to understanding. Hence, the research procedures for selecting participants, analyzing data, and ensuring research rigor differ from those for quantitative research. The following sections address these approaches. table 1 provides a comparative summary of methodological approaches for quantitative and qualitative research.
A Comparison of Qualitative and Quantitative Methodological Approaches

Data collection methods most commonly used in qualitative research are individual or group interviews (including focus groups), observation, and document review. They can be used alone or in combination. While the following sections are written in the context of using interviews or focus groups to collect data, the principles described for sample selection, data analysis, and quality assurance are applicable across qualitative approaches.
Selecting Participants
Quantitative research requires standardization of procedures and random selection of participants to remove the potential influence of external variables and ensure generalizability of results. In contrast, subject selection in qualitative research is purposeful; participants are selected who can best inform the research questions and enhance understanding of the phenomenon under study. 1 , 8 Hence, one of the most important tasks in the study design phase is to identify appropriate participants. Decisions regarding selection are based on the research questions, theoretical perspectives, and evidence informing the study.
The subjects sampled must be able to inform important facets and perspectives related to the phenomenon being studied. For example, in a study looking at a professionalism intervention, representative participants could be considered by role (residents and faculty), perspective (those who approve/disapprove the intervention), experience level (junior and senior residents), and/or diversity (gender, ethnicity, other background).
The second consideration is sample size. Quantitative research requires statistical calculation of sample size a priori to ensure sufficient power to confirm that the outcome can indeed be attributed to the intervention. In qualitative research, however, the sample size is not generally predetermined. The number of participants depends upon the number required to inform fully all important elements of the phenomenon being studied. That is, the sample size is sufficient when additional interviews or focus groups do not result in identification of new concepts, an end point called data saturation . To determine when data saturation occurs, analysis ideally occurs concurrently with data collection in an iterative cycle. This allows the researcher to document the emergence of new themes and also to identify perspectives that may otherwise be overlooked. In the professionalism intervention example, as data are analyzed, the researchers may note that only positive experiences and views are being reported. At this time, a decision could be made to identify and recruit residents who perceived the experience as less positive.
Data Analysis
The purpose of qualitative analysis is to interpret the data and the resulting themes, to facilitate understanding of the phenomenon being studied. It is often confused with content analysis, which is conducted to identify and describe results. 12 In the professionalism intervention example, content analysis of responses might report that residents identified the positive elements of the innovation to be integration with real patient cases, opportunity to hear the views of others, and time to reflect on one's own professionalism. An interpretive analysis, on the other hand, would seek to understand these responses by asking questions such as, “Were there conditions that most frequently elicited these positive responses?” Further interpretive analysis might show that faculty engagement influenced the positive responses, with more positive features being described by residents who had faculty who openly reflected upon their own professionalism or who asked probing questions about the cases. This interpretation can lead to a deeper understanding of the results and to new ideas or theories about relationships and/or about how and why the innovation was or was not effective.
Interpretive analysis is generally seen as being conducted in 3 stages: deconstruction, interpretation, and reconstruction. 11 These stages occur after preparing the data for analysis, ie, after transcription of the interviews or focus groups and verification of the transcripts with the recording.
- Deconstruction refers to breaking down data into component parts in order to see what is included. It is similar to content analysis mentioned above. It requires reading and rereading interview or focus group transcripts and then breaking down data into categories or codes that describe the content.
- Interpretation follows deconstruction and refers to making sense of and understanding the coded data. It involves comparing data codes and categories within and across transcripts and across variables deemed important to the study (eg, year of residency, discipline, engagement of faculty). Techniques for interpreting data and findings include discussion and comparison of codes among research team members while purposefully looking for similarities and differences among themes, comparing findings with those of other studies, exploring theories which might explain relationships among themes, and exploring negative results (those that do not confirm the dominant themes) in more detail.
- Reconstruction refers to recreating or repackaging the prominent codes and themes in a manner that shows the relationships and insights derived in the interpretation phase and that explains them more broadly in light of existing knowledge and theoretical perspectives. Generally one or two central concepts will emerge as central or overarching, and others will appear as subthemes that further contribute to the central concepts. Reconstruction requires contextualizing the findings, ie, positioning and framing them within existing theory, evidence, and practice.
Ensuring Research Quality and Rigor
Within qualitative research, two main strategies promote the rigor and quality of the research: ensuring the quality or “authenticity” of the data and the quality or “trustworthiness” of the analysis. 8 , 12 These are similar in many ways to ensuring validity and reliability, respectively, in quantitative research.
1. Authenticity of the data refers to the quality of the data and data collection procedures. Elements to consider include:
• Sampling approach and participant selection to enable the research question to be addressed appropriately (see “Selecting Participants” above) and reduce the potential of having a biased sample.
• Data triangulation refers to using multiple data sources to produce a more comprehensive view of the phenomenon being studied, eg, interviewing both residents and faculty and using multiple residency sites and/or disciplines.
• Using the appropriate method to answer the research questions, considering the nature of the topic being explored, eg, individual interviews rather than focus groups are generally more appropriate for topics of a sensitive nature.
• Using interview and other guides that are not biased or leading, ie, that do not ask questions in a way that may lead the participant to answer in a particular manner.
• The researcher's and research team's relationships to the study setting and participants need to be explicit, eg, describe the potential for coercion when a faculty member requests his or her own residents to participate in a study.
• The researcher's and team members' own biases and beliefs relative to the phenomenon under study must be made explicit, and, when necessary, appropriate steps must be taken to reduce their impact on the quality of data collected, eg, by selecting a neutral “third party” interviewer.
2. Trustworthiness of the analysis refers to the quality of data analysis. Elements to consider when assessing the quality of analysis include:
• Analysis process: is this clearly described, eg, the roles of the team members, what was done, timing, and sequencing? Is it clear how the data codes or categories were developed? Does the process reflect best practices, eg, comparison of findings within and among transcripts, and use of memos to record decision points?
• Procedure for resolving differences in findings and among team members: this needs to be clearly described.
• Process for addressing the potential influence the researchers' views and beliefs may have upon the analysis.
• Use of a qualitative software program: if used, how was this used?
In summary, this editorial has addressed 3 components of conducting qualitative research: selecting participants, performing data analysis, and assuring research rigor and quality. See table 2 for the key elements for each of these topics.
Conducting Qualitative Research: Summary of Key Elements

JGME editors look forward to reading medical education papers employing qualitative methods and perspectives. We trust these two editorials may be helpful to potential authors and readers, and we welcome your comments on this subject.
Joan Sargeant, PhD, is Professor in the Division of Medical Education, Dalhousie University, Halifax, Nova Scotia, Canada.
- Privacy Policy
Home » Research Report – Example, Writing Guide and Types
Research Report – Example, Writing Guide and Types
Table of Contents

Research Report
Definition:
Research Report is a written document that presents the results of a research project or study, including the research question, methodology, results, and conclusions, in a clear and objective manner.
The purpose of a research report is to communicate the findings of the research to the intended audience, which could be other researchers, stakeholders, or the general public.
Components of Research Report
Components of Research Report are as follows:
Introduction
The introduction sets the stage for the research report and provides a brief overview of the research question or problem being investigated. It should include a clear statement of the purpose of the study and its significance or relevance to the field of research. It may also provide background information or a literature review to help contextualize the research.
Literature Review
The literature review provides a critical analysis and synthesis of the existing research and scholarship relevant to the research question or problem. It should identify the gaps, inconsistencies, and contradictions in the literature and show how the current study addresses these issues. The literature review also establishes the theoretical framework or conceptual model that guides the research.
Methodology
The methodology section describes the research design, methods, and procedures used to collect and analyze data. It should include information on the sample or participants, data collection instruments, data collection procedures, and data analysis techniques. The methodology should be clear and detailed enough to allow other researchers to replicate the study.
The results section presents the findings of the study in a clear and objective manner. It should provide a detailed description of the data and statistics used to answer the research question or test the hypothesis. Tables, graphs, and figures may be included to help visualize the data and illustrate the key findings.
The discussion section interprets the results of the study and explains their significance or relevance to the research question or problem. It should also compare the current findings with those of previous studies and identify the implications for future research or practice. The discussion should be based on the results presented in the previous section and should avoid speculation or unfounded conclusions.
The conclusion summarizes the key findings of the study and restates the main argument or thesis presented in the introduction. It should also provide a brief overview of the contributions of the study to the field of research and the implications for practice or policy.
The references section lists all the sources cited in the research report, following a specific citation style, such as APA or MLA.
The appendices section includes any additional material, such as data tables, figures, or instruments used in the study, that could not be included in the main text due to space limitations.
Types of Research Report
Types of Research Report are as follows:
Thesis is a type of research report. A thesis is a long-form research document that presents the findings and conclusions of an original research study conducted by a student as part of a graduate or postgraduate program. It is typically written by a student pursuing a higher degree, such as a Master’s or Doctoral degree, although it can also be written by researchers or scholars in other fields.
Research Paper
Research paper is a type of research report. A research paper is a document that presents the results of a research study or investigation. Research papers can be written in a variety of fields, including science, social science, humanities, and business. They typically follow a standard format that includes an introduction, literature review, methodology, results, discussion, and conclusion sections.
Technical Report
A technical report is a detailed report that provides information about a specific technical or scientific problem or project. Technical reports are often used in engineering, science, and other technical fields to document research and development work.
Progress Report
A progress report provides an update on the progress of a research project or program over a specific period of time. Progress reports are typically used to communicate the status of a project to stakeholders, funders, or project managers.
Feasibility Report
A feasibility report assesses the feasibility of a proposed project or plan, providing an analysis of the potential risks, benefits, and costs associated with the project. Feasibility reports are often used in business, engineering, and other fields to determine the viability of a project before it is undertaken.
Field Report
A field report documents observations and findings from fieldwork, which is research conducted in the natural environment or setting. Field reports are often used in anthropology, ecology, and other social and natural sciences.
Experimental Report
An experimental report documents the results of a scientific experiment, including the hypothesis, methods, results, and conclusions. Experimental reports are often used in biology, chemistry, and other sciences to communicate the results of laboratory experiments.
Case Study Report
A case study report provides an in-depth analysis of a specific case or situation, often used in psychology, social work, and other fields to document and understand complex cases or phenomena.
Literature Review Report
A literature review report synthesizes and summarizes existing research on a specific topic, providing an overview of the current state of knowledge on the subject. Literature review reports are often used in social sciences, education, and other fields to identify gaps in the literature and guide future research.
Research Report Example
Following is a Research Report Example sample for Students:
Title: The Impact of Social Media on Academic Performance among High School Students
This study aims to investigate the relationship between social media use and academic performance among high school students. The study utilized a quantitative research design, which involved a survey questionnaire administered to a sample of 200 high school students. The findings indicate that there is a negative correlation between social media use and academic performance, suggesting that excessive social media use can lead to poor academic performance among high school students. The results of this study have important implications for educators, parents, and policymakers, as they highlight the need for strategies that can help students balance their social media use and academic responsibilities.
Introduction:
Social media has become an integral part of the lives of high school students. With the widespread use of social media platforms such as Facebook, Twitter, Instagram, and Snapchat, students can connect with friends, share photos and videos, and engage in discussions on a range of topics. While social media offers many benefits, concerns have been raised about its impact on academic performance. Many studies have found a negative correlation between social media use and academic performance among high school students (Kirschner & Karpinski, 2010; Paul, Baker, & Cochran, 2012).
Given the growing importance of social media in the lives of high school students, it is important to investigate its impact on academic performance. This study aims to address this gap by examining the relationship between social media use and academic performance among high school students.
Methodology:
The study utilized a quantitative research design, which involved a survey questionnaire administered to a sample of 200 high school students. The questionnaire was developed based on previous studies and was designed to measure the frequency and duration of social media use, as well as academic performance.
The participants were selected using a convenience sampling technique, and the survey questionnaire was distributed in the classroom during regular school hours. The data collected were analyzed using descriptive statistics and correlation analysis.
The findings indicate that the majority of high school students use social media platforms on a daily basis, with Facebook being the most popular platform. The results also show a negative correlation between social media use and academic performance, suggesting that excessive social media use can lead to poor academic performance among high school students.
Discussion:
The results of this study have important implications for educators, parents, and policymakers. The negative correlation between social media use and academic performance suggests that strategies should be put in place to help students balance their social media use and academic responsibilities. For example, educators could incorporate social media into their teaching strategies to engage students and enhance learning. Parents could limit their children’s social media use and encourage them to prioritize their academic responsibilities. Policymakers could develop guidelines and policies to regulate social media use among high school students.
Conclusion:
In conclusion, this study provides evidence of the negative impact of social media on academic performance among high school students. The findings highlight the need for strategies that can help students balance their social media use and academic responsibilities. Further research is needed to explore the specific mechanisms by which social media use affects academic performance and to develop effective strategies for addressing this issue.
Limitations:
One limitation of this study is the use of convenience sampling, which limits the generalizability of the findings to other populations. Future studies should use random sampling techniques to increase the representativeness of the sample. Another limitation is the use of self-reported measures, which may be subject to social desirability bias. Future studies could use objective measures of social media use and academic performance, such as tracking software and school records.
Implications:
The findings of this study have important implications for educators, parents, and policymakers. Educators could incorporate social media into their teaching strategies to engage students and enhance learning. For example, teachers could use social media platforms to share relevant educational resources and facilitate online discussions. Parents could limit their children’s social media use and encourage them to prioritize their academic responsibilities. They could also engage in open communication with their children to understand their social media use and its impact on their academic performance. Policymakers could develop guidelines and policies to regulate social media use among high school students. For example, schools could implement social media policies that restrict access during class time and encourage responsible use.
References:
- Kirschner, P. A., & Karpinski, A. C. (2010). Facebook® and academic performance. Computers in Human Behavior, 26(6), 1237-1245.
- Paul, J. A., Baker, H. M., & Cochran, J. D. (2012). Effect of online social networking on student academic performance. Journal of the Research Center for Educational Technology, 8(1), 1-19.
- Pantic, I. (2014). Online social networking and mental health. Cyberpsychology, Behavior, and Social Networking, 17(10), 652-657.
- Rosen, L. D., Carrier, L. M., & Cheever, N. A. (2013). Facebook and texting made me do it: Media-induced task-switching while studying. Computers in Human Behavior, 29(3), 948-958.
Note*: Above mention, Example is just a sample for the students’ guide. Do not directly copy and paste as your College or University assignment. Kindly do some research and Write your own.
Applications of Research Report
Research reports have many applications, including:
- Communicating research findings: The primary application of a research report is to communicate the results of a study to other researchers, stakeholders, or the general public. The report serves as a way to share new knowledge, insights, and discoveries with others in the field.
- Informing policy and practice : Research reports can inform policy and practice by providing evidence-based recommendations for decision-makers. For example, a research report on the effectiveness of a new drug could inform regulatory agencies in their decision-making process.
- Supporting further research: Research reports can provide a foundation for further research in a particular area. Other researchers may use the findings and methodology of a report to develop new research questions or to build on existing research.
- Evaluating programs and interventions : Research reports can be used to evaluate the effectiveness of programs and interventions in achieving their intended outcomes. For example, a research report on a new educational program could provide evidence of its impact on student performance.
- Demonstrating impact : Research reports can be used to demonstrate the impact of research funding or to evaluate the success of research projects. By presenting the findings and outcomes of a study, research reports can show the value of research to funders and stakeholders.
- Enhancing professional development : Research reports can be used to enhance professional development by providing a source of information and learning for researchers and practitioners in a particular field. For example, a research report on a new teaching methodology could provide insights and ideas for educators to incorporate into their own practice.
How to write Research Report
Here are some steps you can follow to write a research report:
- Identify the research question: The first step in writing a research report is to identify your research question. This will help you focus your research and organize your findings.
- Conduct research : Once you have identified your research question, you will need to conduct research to gather relevant data and information. This can involve conducting experiments, reviewing literature, or analyzing data.
- Organize your findings: Once you have gathered all of your data, you will need to organize your findings in a way that is clear and understandable. This can involve creating tables, graphs, or charts to illustrate your results.
- Write the report: Once you have organized your findings, you can begin writing the report. Start with an introduction that provides background information and explains the purpose of your research. Next, provide a detailed description of your research methods and findings. Finally, summarize your results and draw conclusions based on your findings.
- Proofread and edit: After you have written your report, be sure to proofread and edit it carefully. Check for grammar and spelling errors, and make sure that your report is well-organized and easy to read.
- Include a reference list: Be sure to include a list of references that you used in your research. This will give credit to your sources and allow readers to further explore the topic if they choose.
- Format your report: Finally, format your report according to the guidelines provided by your instructor or organization. This may include formatting requirements for headings, margins, fonts, and spacing.
Purpose of Research Report
The purpose of a research report is to communicate the results of a research study to a specific audience, such as peers in the same field, stakeholders, or the general public. The report provides a detailed description of the research methods, findings, and conclusions.
Some common purposes of a research report include:
- Sharing knowledge: A research report allows researchers to share their findings and knowledge with others in their field. This helps to advance the field and improve the understanding of a particular topic.
- Identifying trends: A research report can identify trends and patterns in data, which can help guide future research and inform decision-making.
- Addressing problems: A research report can provide insights into problems or issues and suggest solutions or recommendations for addressing them.
- Evaluating programs or interventions : A research report can evaluate the effectiveness of programs or interventions, which can inform decision-making about whether to continue, modify, or discontinue them.
- Meeting regulatory requirements: In some fields, research reports are required to meet regulatory requirements, such as in the case of drug trials or environmental impact studies.
When to Write Research Report
A research report should be written after completing the research study. This includes collecting data, analyzing the results, and drawing conclusions based on the findings. Once the research is complete, the report should be written in a timely manner while the information is still fresh in the researcher’s mind.
In academic settings, research reports are often required as part of coursework or as part of a thesis or dissertation. In this case, the report should be written according to the guidelines provided by the instructor or institution.
In other settings, such as in industry or government, research reports may be required to inform decision-making or to comply with regulatory requirements. In these cases, the report should be written as soon as possible after the research is completed in order to inform decision-making in a timely manner.
Overall, the timing of when to write a research report depends on the purpose of the research, the expectations of the audience, and any regulatory requirements that need to be met. However, it is important to complete the report in a timely manner while the information is still fresh in the researcher’s mind.
Characteristics of Research Report
There are several characteristics of a research report that distinguish it from other types of writing. These characteristics include:
- Objective: A research report should be written in an objective and unbiased manner. It should present the facts and findings of the research study without any personal opinions or biases.
- Systematic: A research report should be written in a systematic manner. It should follow a clear and logical structure, and the information should be presented in a way that is easy to understand and follow.
- Detailed: A research report should be detailed and comprehensive. It should provide a thorough description of the research methods, results, and conclusions.
- Accurate : A research report should be accurate and based on sound research methods. The findings and conclusions should be supported by data and evidence.
- Organized: A research report should be well-organized. It should include headings and subheadings to help the reader navigate the report and understand the main points.
- Clear and concise: A research report should be written in clear and concise language. The information should be presented in a way that is easy to understand, and unnecessary jargon should be avoided.
- Citations and references: A research report should include citations and references to support the findings and conclusions. This helps to give credit to other researchers and to provide readers with the opportunity to further explore the topic.
Advantages of Research Report
Research reports have several advantages, including:
- Communicating research findings: Research reports allow researchers to communicate their findings to a wider audience, including other researchers, stakeholders, and the general public. This helps to disseminate knowledge and advance the understanding of a particular topic.
- Providing evidence for decision-making : Research reports can provide evidence to inform decision-making, such as in the case of policy-making, program planning, or product development. The findings and conclusions can help guide decisions and improve outcomes.
- Supporting further research: Research reports can provide a foundation for further research on a particular topic. Other researchers can build on the findings and conclusions of the report, which can lead to further discoveries and advancements in the field.
- Demonstrating expertise: Research reports can demonstrate the expertise of the researchers and their ability to conduct rigorous and high-quality research. This can be important for securing funding, promotions, and other professional opportunities.
- Meeting regulatory requirements: In some fields, research reports are required to meet regulatory requirements, such as in the case of drug trials or environmental impact studies. Producing a high-quality research report can help ensure compliance with these requirements.
Limitations of Research Report
Despite their advantages, research reports also have some limitations, including:
- Time-consuming: Conducting research and writing a report can be a time-consuming process, particularly for large-scale studies. This can limit the frequency and speed of producing research reports.
- Expensive: Conducting research and producing a report can be expensive, particularly for studies that require specialized equipment, personnel, or data. This can limit the scope and feasibility of some research studies.
- Limited generalizability: Research studies often focus on a specific population or context, which can limit the generalizability of the findings to other populations or contexts.
- Potential bias : Researchers may have biases or conflicts of interest that can influence the findings and conclusions of the research study. Additionally, participants may also have biases or may not be representative of the larger population, which can limit the validity and reliability of the findings.
- Accessibility: Research reports may be written in technical or academic language, which can limit their accessibility to a wider audience. Additionally, some research may be behind paywalls or require specialized access, which can limit the ability of others to read and use the findings.
About the author

Muhammad Hassan
Researcher, Academic Writer, Web developer
You may also like

Data Collection – Methods Types and Examples

APA Table of Contents – Format and Example

Research Methods – Types, Examples and Guide

Dissertation vs Thesis – Key Differences

Conceptual Framework – Types, Methodology and...

Research Paper Conclusion – Writing Guide and...
A Scholar’s Guide to Writing the Methods Section of a Research Paper
Table of contents
- 1 What Is the Methods Section of a Research Paper
- 2 Methodology vs. Methods
- 3.1 Participants
- 3.2 Apparatus
- 3.3 Procedure
- 4.1 Methods and Results Should Match
- 4.2 Preparing the Statistical Methods Subsection
- 4.3 The Style of the Methodology
- 5 Key Information to Include in Methodology
- 6 Helping Hand in Writing Methodology Chapter
- 7.1 Which information is not included in the methodology section of a research article?
- 7.2 Where does the research methodology section go in a research paper?
- 7.3 What is the difference between qualitative and quantitative methods?
In the vast realm of academic writing, the research paper stands as a testament to a scholar’s systematic exploration of a particular subject. Each section of the paper plays a pivotal role, knitting together the fabric of the study. While the introduction sets the stage and the results showcase the findings, it is the Methods section that forms the backbone, providing a clear roadmap for any reader or researcher wishing to replicate or understand the study’s inner workings. As pivotal as it is, crafting an impeccable Methods section often poses challenges for researchers. This article aims to elucidate the intricacies of constructing a robust Methodology section in a research paper.
After reading our guide, you will:
- Get a clear understanding of the importance and purpose of the Methods in a research paper.
- Discover in details what should contain a comprehensive Methods section.
- Learn essentials on writing a Methodology in a research paper.
Now, let’s take a detailed look at these points!
What Is the Methods Section of a Research Paper
Do you have any questions about how to write the Methodology? Firstly, let’s define this section for research. The Methods or Methodology section of the research paper gives the road map for how the research was conducted. A well-crafted Methods section not only guides the researcher but also helps other scholars understand, replicate your study.
In other words, it’s like a recipe in a cookbook. If you want others to recreate your experiment or study, this section tells them exactly how you did it. It includes details about the steps you took, the tools or ingredients you used, and how you measured your results. This way, others can see if they get the same outcome when they follow your “recipe” or if they can trust your findings.
This means that the Methodology should be thoughtfully planned, executed, and reported. The reader should understand the basic research structure and the steps taken to conduct the study, including the research design, methods, gathered data, and data analysis techniques used.
The Methodology of a research study is essential for several reasons:
Validity and Reliability: A well-defined Methodology provides the foundation for the criteria and reliability of the study, particularly in addressing the research question for research. It helps to ensure that the research is conducted in a systematic and controlled manner and that the results are accurate and trustworthy.
Replicability: It allows other researchers to understand and replicate the study, which is important for building on existing knowledge and advancing the field.
Clarity and Transparency: A clear and concise Methods part makes it easier for readers to understand the research process and evaluate the results. This helps to increase transparency and build trust in the findings.
Justification of Approach: The research methodology provides a rationale for the approach taken, including why certain methods and techniques were chosen and how they relate to the question for research.
Evidence of Rigor: A well-executed research methodology demonstrates the rigor and thoroughness of the study, which is important for establishing the credibility of the results.
Methodology vs. Methods
In rigorous academic and research contexts, there is a distinction between “methods” and “methodology.” However, outside of strict scholarly circles or in more informal discussions, there might be some overlapping use. The “methods” generally refer to the specific techniques or procedures, while “methodology” dives into the theoretical framework and rationale behind those techniques. It’s essential to use the terms correctly in formal academic and research writings to maintain clarity and precision.
Nevertheless, in many research papers, the specifics of the methods (the “how”) are the primary focus, and the theoretical rationale (the “why”) might be briefly touched upon within the same section.
Structure of the Methodology In A Research Paper
The Methods section typically begins with a brief overview of its contents and a reiteration of the research question. This is followed by a description of the participants, detailing their demographics, and how they were recruited. The materials or apparatus used are then specified, from tools to equipment, with any unique specifications highlighted.
The core of the Methods section is the procedure, a step-by-step account of the study, from experimental tasks to the sequence of operations. This is complemented by an explanation of the experimental design, where the type of research design is described, along with the variables involved. Detailed accounts of how data was gathered, whether through surveys, interviews, or other methods, are provided, ensuring the reader understands the data collection nuances.
Critical to the credibility of the study is the section on statistical analysis, which reveals how data was processed, what statistical tests were used, and the software or tools employed. If the research involved humans or animals, the ethical considerations section becomes pivotal. Here, measures taken to ensure participants’ rights, confidentiality, and informed consent are documented. Towards the end, the limitations of the study are discussed, providing insights into potential biases or constraints faced during the research process. The section wraps up with a brief recap, emphasizing the methods’ role in ensuring the study’s integrity and reproducibility.
According to APA style , there are three major subsections to report here: participants, apparatus, and procedure.
Participants
This segment reports the characteristics of the participants involved in the experiment, the method of sampling, and the sample size.
- Characteristics
This details the demography of the respondents that may be relevant to the experiment. This includes but is not limited to age, gender, ethnicity or race, religion, level of education, socioeconomic status, origin of the population, and any restrictions.
✏️Example:
Fifty female undergraduate students between the ages of 19 and 23 participated in the experiment. All were sophomores in the Faculty of Engineering and native English speakers who lived on the university campus. The participants were separated into two groups of 25 students, each without any determining criteria. This study was conducted at the University of Alabama, USA .
- Sampling Strategy
Identify the selection criteria and whether the sample was random or not. Include it if you have access to data informing the percentage of people invited to participate and how many agreed. You should also report the selection mode; was it voluntary, or were the participants assigned to the study? Additionally, identify any compensation that was provided to participants.
The ethics board was petitioned, and approval was granted before the recruitment of participants commenced. All the female sophomores from the faculty of Engineering at the University of Alabama, USA, were invited to participate, and those who did were self-selected. In liaison with department heads, the students were offered additional credits in a faculty-wide course as compensation for their time.
- Sample Size
Identify the sample size per group, the statistical power you aimed to attain, whether you could attain it, and the analyses you used to determine the figures you arrived at. You should also include whether the final sample you got was what you initially required.
The required power for this experiment to detect a 15% effect at a significance level of .08 was 75%. To achieve this, we needed 25 participants in each group. The final sample met these conditions.
This subsection describes the materials and apparatus used in the experiment. It calls for detailed information on all devices and techniques used to collate data, measure suitable variables, and reach analysis, including tests and surveys. You must include a proper count of the number of apparatus used, their names, model number, manufacturer, reliability, and validity. For surveys, including the meaning of the formats used and the number of questions asked.
A survey that consisted of 15 multiple-choice questions was carried out to determine the safety of female students on the school campus. The participants were asked to answer the questions using a 5-point grading system (1 = Extremely True and 5 = Extremely False).
This includes the conditions in which data was collated, instructions given to the participants, and data analysis methods.
The two groups of participants were placed in two different classrooms at individual desks and given 10 minutes to answer the questions. They were instructed to give the first answers they thought of without thinking too deeply. Each group had a supervisor attached to it.
Writing a research paper requires a great deal of skill and knowledge, so if you need help compiling the Methods section of your paper, consider using a professional coursework writing service to help you.
Advice On How to Write the Methods Section
You already know the relevance of the Methods part to your research paper. Additionally, you must adhere to formatting guidelines specific for your field.
If you cannot write according to standards, you can use a research paper writing service to get good results. Go for one with good reviews and a super online reputation.
Here are some more tips for a concise and meticulously written Methodology:
- Method Introduction: Begin the section on methodology by introducing the methods used in the research. Provide a brief overview of the research design and the data collection and analysis techniques used.
- Methodological Connection: Establish the connection between the methodology and the research query.
- Instrument Introduction: Introduce the instruments used to assemble data, such as surveys, interviews, or observation. Provide a brief description of each instrument and how it will be used in the study.
- Analysis Discussion: Discuss the analysis techniques used to analyze the data collected. Explain how the data will be organized, coded, and analyzed to address the research query.
- Background Information: Provide background information about the methodology and the relevant literature. Explain how the methodology fits into the broader context of the research area and what it contributes to the current understanding of the topic.
- Sampling Process: Discuss the sampling process used in the study. Explain how the sample was selected, what criteria were used, and how the samples taken were determined.
- Limitations: It was required to discuss any research constraints in the past tense, such as limited sample sizes, issues with the data collection process, or issues with the analysis methods employed. Researchers had to explain how these constraints might have affected the study’s findings and conclusions.
Methods and Results Should Match
In the Methods section, the results obtained should be discussed based on the experimental procedures used. Explain the methodology behind the techniques used to acquire all the observations and results of the experiment in the right order. You can create a detailed flowchart or block flow diagram (BFD) to easily describe the complexities of the study and its procedures to the reader.
Preparing the Statistical Methods Subsection
The statistical analysis subsection comes at the end of the Methods section. It includes a thorough description of the analyzed data to arrive at the results and conclusion. Due to its technicality, it might be a little difficult and daunting to write. If this is the case, you can get the statistician who participated in the study to write it.
Here, you must indicate all the data variables, including the control variables, dependent and independent variables, and any potentially irrelevant variables that could affect your results and conclusion. Specify the exact tests carried out on the different types of data you have, the requirements you tested, like distribution normality, and all assumptions you initially applied.
You should also include all data alterations, possible mix-ups, confidence intervals or significance levels used, techniques for data analysis, and ensuing statistical tests that were employed. Furthermore, specify any criteria particular to the experiment, like set baselines and any specific software used to conduct the statistical analysis.
The Style of the Methodology
As mentioned earlier, it aims to explain how and why the experiment was carried out so that readers can understand it and possibly repeat the procedure.
Therefore, it is essential to be aware of your audience so you can modify your writing based on what they know and explain technical terms where necessary. If you are finding it difficult to write in the appropriate style, you can buy a research paper written by writers. You can find these writers on several platforms for college essays.
The methodology should read as though you describe the experiment to your reader. For this reason, it should be worded in third-person constructs and a passive voice. For example, you should use “We carried out a survey” and not “I carried out a survey.” Since the experiment has already been carried out, you must write the entire section in the past tense.
Key Information to Include in Methodology
Now you know what the Methods section is, what information must be included in this segment of your paper? Here’s a summary of the things you need to include:
- Literature review . The sources that helped in the methods are cited under this heading.
- Research participants. This includes all information about the study participants, including compensations, mode of selection, and demographics.
- Criteria for inclusion or exclusion include the factors determining what participants were eliminated and why.
- Grouping conditions are the factors determining the subgrouping of the chosen participants.
- Procedures. These are the conditions under which the experiment was carried out.
- Materials and apparatus. These include all devices, equipment, reliability, and validity.
- Statistical analysis. This is detailed information about the data, measured and analyzed, and the tests carried out.
Helping Hand in Writing Methodology Chapter
It can be challenging for researchers to adequately describe their study methodologies and strategies when writing the methodology chapter of a research report. Organizing and presenting complex material, retaining clarity and conciseness, and describing technical processes or approaches are among the usual difficulties.
To overcome these challenges, researchers can consider seeking feedback from peers, utilizing a https://papersowl.com/ or editor, and thoroughly reviewing and revising their methodology chapter multiple times. With the help of an essay writing service, you can ensure that your research paper is accurate and successful.
Which information is not included in the methodology section of a research article?
Where does the research methodology section go in a research paper, what is the difference between qualitative and quantitative methods, readers also enjoyed.

WHY WAIT? PLACE AN ORDER RIGHT NOW!
Just fill out the form, press the button, and have no worries!
We use cookies to give you the best experience possible. By continuing we’ll assume you board with our cookie policy.
- Affiliate Program

- UNITED STATES
- 台灣 (TAIWAN)
- TÜRKIYE (TURKEY)
- Academic Editing Services
- - Research Paper
- - Journal Manuscript
- - Dissertation
- - College & University Assignments
- Admissions Editing Services
- - Application Essay
- - Personal Statement
- - Recommendation Letter
- - Cover Letter
- - CV/Resume
- Business Editing Services
- - Business Documents
- - Report & Brochure
- - Website & Blog
- Writer Editing Services
- - Script & Screenplay
- Our Editors
- Client Reviews
- Editing & Proofreading Prices
- Wordvice Points
- Partner Discount
- Plagiarism Checker
- APA Citation Generator
- MLA Citation Generator
- Chicago Citation Generator
- Vancouver Citation Generator
- - APA Style
- - MLA Style
- - Chicago Style
- - Vancouver Style
- Writing & Editing Guide
- Academic Resources
- Admissions Resources
How to Write the Results/Findings Section in Research
What is the research paper Results section and what does it do?
The Results section of a scientific research paper represents the core findings of a study derived from the methods applied to gather and analyze information. It presents these findings in a logical sequence without bias or interpretation from the author, setting up the reader for later interpretation and evaluation in the Discussion section. A major purpose of the Results section is to break down the data into sentences that show its significance to the research question(s).
The Results section appears third in the section sequence in most scientific papers. It follows the presentation of the Methods and Materials and is presented before the Discussion section —although the Results and Discussion are presented together in many journals. This section answers the basic question “What did you find in your research?”
What is included in the Results section?
The Results section should include the findings of your study and ONLY the findings of your study. The findings include:
- Data presented in tables, charts, graphs, and other figures (may be placed into the text or on separate pages at the end of the manuscript)
- A contextual analysis of this data explaining its meaning in sentence form
- All data that corresponds to the central research question(s)
- All secondary findings (secondary outcomes, subgroup analyses, etc.)
If the scope of the study is broad, or if you studied a variety of variables, or if the methodology used yields a wide range of different results, the author should present only those results that are most relevant to the research question stated in the Introduction section .
As a general rule, any information that does not present the direct findings or outcome of the study should be left out of this section. Unless the journal requests that authors combine the Results and Discussion sections, explanations and interpretations should be omitted from the Results.
How are the results organized?
The best way to organize your Results section is “logically.” One logical and clear method of organizing research results is to provide them alongside the research questions—within each research question, present the type of data that addresses that research question.
Let’s look at an example. Your research question is based on a survey among patients who were treated at a hospital and received postoperative care. Let’s say your first research question is:

“What do hospital patients over age 55 think about postoperative care?”
This can actually be represented as a heading within your Results section, though it might be presented as a statement rather than a question:
Attitudes towards postoperative care in patients over the age of 55
Now present the results that address this specific research question first. In this case, perhaps a table illustrating data from a survey. Likert items can be included in this example. Tables can also present standard deviations, probabilities, correlation matrices, etc.
Following this, present a content analysis, in words, of one end of the spectrum of the survey or data table. In our example case, start with the POSITIVE survey responses regarding postoperative care, using descriptive phrases. For example:
“Sixty-five percent of patients over 55 responded positively to the question “ Are you satisfied with your hospital’s postoperative care ?” (Fig. 2)
Include other results such as subcategory analyses. The amount of textual description used will depend on how much interpretation of tables and figures is necessary and how many examples the reader needs in order to understand the significance of your research findings.
Next, present a content analysis of another part of the spectrum of the same research question, perhaps the NEGATIVE or NEUTRAL responses to the survey. For instance:
“As Figure 1 shows, 15 out of 60 patients in Group A responded negatively to Question 2.”
After you have assessed the data in one figure and explained it sufficiently, move on to your next research question. For example:
“How does patient satisfaction correspond to in-hospital improvements made to postoperative care?”

This kind of data may be presented through a figure or set of figures (for instance, a paired T-test table).
Explain the data you present, here in a table, with a concise content analysis:
“The p-value for the comparison between the before and after groups of patients was .03% (Fig. 2), indicating that the greater the dissatisfaction among patients, the more frequent the improvements that were made to postoperative care.”
Let’s examine another example of a Results section from a study on plant tolerance to heavy metal stress . In the Introduction section, the aims of the study are presented as “determining the physiological and morphological responses of Allium cepa L. towards increased cadmium toxicity” and “evaluating its potential to accumulate the metal and its associated environmental consequences.” The Results section presents data showing how these aims are achieved in tables alongside a content analysis, beginning with an overview of the findings:
“Cadmium caused inhibition of root and leave elongation, with increasing effects at higher exposure doses (Fig. 1a-c).”
The figure containing this data is cited in parentheses. Note that this author has combined three graphs into one single figure. Separating the data into separate graphs focusing on specific aspects makes it easier for the reader to assess the findings, and consolidating this information into one figure saves space and makes it easy to locate the most relevant results.

Following this overall summary, the relevant data in the tables is broken down into greater detail in text form in the Results section.
- “Results on the bio-accumulation of cadmium were found to be the highest (17.5 mg kgG1) in the bulb, when the concentration of cadmium in the solution was 1×10G2 M and lowest (0.11 mg kgG1) in the leaves when the concentration was 1×10G3 M.”
Captioning and Referencing Tables and Figures
Tables and figures are central components of your Results section and you need to carefully think about the most effective way to use graphs and tables to present your findings . Therefore, it is crucial to know how to write strong figure captions and to refer to them within the text of the Results section.
The most important advice one can give here as well as throughout the paper is to check the requirements and standards of the journal to which you are submitting your work. Every journal has its own design and layout standards, which you can find in the author instructions on the target journal’s website. Perusing a journal’s published articles will also give you an idea of the proper number, size, and complexity of your figures.
Regardless of which format you use, the figures should be placed in the order they are referenced in the Results section and be as clear and easy to understand as possible. If there are multiple variables being considered (within one or more research questions), it can be a good idea to split these up into separate figures. Subsequently, these can be referenced and analyzed under separate headings and paragraphs in the text.
To create a caption, consider the research question being asked and change it into a phrase. For instance, if one question is “Which color did participants choose?”, the caption might be “Color choice by participant group.” Or in our last research paper example, where the question was “What is the concentration of cadmium in different parts of the onion after 14 days?” the caption reads:
“Fig. 1(a-c): Mean concentration of Cd determined in (a) bulbs, (b) leaves, and (c) roots of onions after a 14-day period.”
Steps for Composing the Results Section
Because each study is unique, there is no one-size-fits-all approach when it comes to designing a strategy for structuring and writing the section of a research paper where findings are presented. The content and layout of this section will be determined by the specific area of research, the design of the study and its particular methodologies, and the guidelines of the target journal and its editors. However, the following steps can be used to compose the results of most scientific research studies and are essential for researchers who are new to preparing a manuscript for publication or who need a reminder of how to construct the Results section.
Step 1 : Consult the guidelines or instructions that the target journal or publisher provides authors and read research papers it has published, especially those with similar topics, methods, or results to your study.
- The guidelines will generally outline specific requirements for the results or findings section, and the published articles will provide sound examples of successful approaches.
- Note length limitations on restrictions on content. For instance, while many journals require the Results and Discussion sections to be separate, others do not—qualitative research papers often include results and interpretations in the same section (“Results and Discussion”).
- Reading the aims and scope in the journal’s “ guide for authors ” section and understanding the interests of its readers will be invaluable in preparing to write the Results section.
Step 2 : Consider your research results in relation to the journal’s requirements and catalogue your results.
- Focus on experimental results and other findings that are especially relevant to your research questions and objectives and include them even if they are unexpected or do not support your ideas and hypotheses.
- Catalogue your findings—use subheadings to streamline and clarify your report. This will help you avoid excessive and peripheral details as you write and also help your reader understand and remember your findings. Create appendices that might interest specialists but prove too long or distracting for other readers.
- Decide how you will structure of your results. You might match the order of the research questions and hypotheses to your results, or you could arrange them according to the order presented in the Methods section. A chronological order or even a hierarchy of importance or meaningful grouping of main themes or categories might prove effective. Consider your audience, evidence, and most importantly, the objectives of your research when choosing a structure for presenting your findings.
Step 3 : Design figures and tables to present and illustrate your data.
- Tables and figures should be numbered according to the order in which they are mentioned in the main text of the paper.
- Information in figures should be relatively self-explanatory (with the aid of captions), and their design should include all definitions and other information necessary for readers to understand the findings without reading all of the text.
- Use tables and figures as a focal point to tell a clear and informative story about your research and avoid repeating information. But remember that while figures clarify and enhance the text, they cannot replace it.
Step 4 : Draft your Results section using the findings and figures you have organized.
- The goal is to communicate this complex information as clearly and precisely as possible; precise and compact phrases and sentences are most effective.
- In the opening paragraph of this section, restate your research questions or aims to focus the reader’s attention to what the results are trying to show. It is also a good idea to summarize key findings at the end of this section to create a logical transition to the interpretation and discussion that follows.
- Try to write in the past tense and the active voice to relay the findings since the research has already been done and the agent is usually clear. This will ensure that your explanations are also clear and logical.
- Make sure that any specialized terminology or abbreviation you have used here has been defined and clarified in the Introduction section .
Step 5 : Review your draft; edit and revise until it reports results exactly as you would like to have them reported to your readers.
- Double-check the accuracy and consistency of all the data, as well as all of the visual elements included.
- Read your draft aloud to catch language errors (grammar, spelling, and mechanics), awkward phrases, and missing transitions.
- Ensure that your results are presented in the best order to focus on objectives and prepare readers for interpretations, valuations, and recommendations in the Discussion section . Look back over the paper’s Introduction and background while anticipating the Discussion and Conclusion sections to ensure that the presentation of your results is consistent and effective.
- Consider seeking additional guidance on your paper. Find additional readers to look over your Results section and see if it can be improved in any way. Peers, professors, or qualified experts can provide valuable insights.
One excellent option is to use a professional English proofreading and editing service such as Wordvice, including our paper editing service . With hundreds of qualified editors from dozens of scientific fields, Wordvice has helped thousands of authors revise their manuscripts and get accepted into their target journals. Read more about the proofreading and editing process before proceeding with getting academic editing services and manuscript editing services for your manuscript.
As the representation of your study’s data output, the Results section presents the core information in your research paper. By writing with clarity and conciseness and by highlighting and explaining the crucial findings of their study, authors increase the impact and effectiveness of their research manuscripts.
For more articles and videos on writing your research manuscript, visit Wordvice’s Resources page.
Wordvice Resources
- How to Write a Research Paper Introduction
- Which Verb Tenses to Use in a Research Paper
- How to Write an Abstract for a Research Paper
- How to Write a Research Paper Title
- Useful Phrases for Academic Writing
- Common Transition Terms in Academic Papers
- Active and Passive Voice in Research Papers
- 100+ Verbs That Will Make Your Research Writing Amazing
- Tips for Paraphrasing in Research Papers
Title Page Setup
A title page is required for all APA Style papers. There are both student and professional versions of the title page. Students should use the student version of the title page unless their instructor or institution has requested they use the professional version. APA provides a student title page guide (PDF, 199KB) to assist students in creating their title pages.
Student title page
The student title page includes the paper title, author names (the byline), author affiliation, course number and name for which the paper is being submitted, instructor name, assignment due date, and page number, as shown in this example.

Title page setup is covered in the seventh edition APA Style manuals in the Publication Manual Section 2.3 and the Concise Guide Section 1.6
Related handouts
- Student Title Page Guide (PDF, 263KB)
- Student Paper Setup Guide (PDF, 3MB)
Student papers do not include a running head unless requested by the instructor or institution.
Follow the guidelines described next to format each element of the student title page.
|
|
|
|
|---|---|---|
| Paper title | Place the title three to four lines down from the top of the title page. Center it and type it in bold font. Capitalize of the title. Place the main title and any subtitle on separate double-spaced lines if desired. There is no maximum length for titles; however, keep titles focused and include key terms. |
|
| Author names | Place one double-spaced blank line between the paper title and the author names. Center author names on their own line. If there are two authors, use the word “and” between authors; if there are three or more authors, place a comma between author names and use the word “and” before the final author name. | Cecily J. Sinclair and Adam Gonzaga |
| Author affiliation | For a student paper, the affiliation is the institution where the student attends school. Include both the name of any department and the name of the college, university, or other institution, separated by a comma. Center the affiliation on the next double-spaced line after the author name(s). | Department of Psychology, University of Georgia |
| Course number and name | Provide the course number as shown on instructional materials, followed by a colon and the course name. Center the course number and name on the next double-spaced line after the author affiliation. | PSY 201: Introduction to Psychology |
| Instructor name | Provide the name of the instructor for the course using the format shown on instructional materials. Center the instructor name on the next double-spaced line after the course number and name. | Dr. Rowan J. Estes |
| Assignment due date | Provide the due date for the assignment. Center the due date on the next double-spaced line after the instructor name. Use the date format commonly used in your country. | October 18, 2020 |
|
| Use the page number 1 on the title page. Use the automatic page-numbering function of your word processing program to insert page numbers in the top right corner of the page header. | 1 |
Professional title page
The professional title page includes the paper title, author names (the byline), author affiliation(s), author note, running head, and page number, as shown in the following example.

Follow the guidelines described next to format each element of the professional title page.
|
|
|
|
|---|---|---|
| Paper title | Place the title three to four lines down from the top of the title page. Center it and type it in bold font. Capitalize of the title. Place the main title and any subtitle on separate double-spaced lines if desired. There is no maximum length for titles; however, keep titles focused and include key terms. |
|
| Author names
| Place one double-spaced blank line between the paper title and the author names. Center author names on their own line. If there are two authors, use the word “and” between authors; if there are three or more authors, place a comma between author names and use the word “and” before the final author name. | Francesca Humboldt |
| When different authors have different affiliations, use superscript numerals after author names to connect the names to the appropriate affiliation(s). If all authors have the same affiliation, superscript numerals are not used (see Section 2.3 of the for more on how to set up bylines and affiliations). | Tracy Reuter , Arielle Borovsky , and Casey Lew-Williams | |
| Author affiliation
| For a professional paper, the affiliation is the institution at which the research was conducted. Include both the name of any department and the name of the college, university, or other institution, separated by a comma. Center the affiliation on the next double-spaced line after the author names; when there are multiple affiliations, center each affiliation on its own line.
| Department of Nursing, Morrigan University |
| When different authors have different affiliations, use superscript numerals before affiliations to connect the affiliations to the appropriate author(s). Do not use superscript numerals if all authors share the same affiliations (see Section 2.3 of the for more). | Department of Psychology, Princeton University | |
| Author note | Place the author note in the bottom half of the title page. Center and bold the label “Author Note.” Align the paragraphs of the author note to the left. For further information on the contents of the author note, see Section 2.7 of the . | n/a |
|
| The running head appears in all-capital letters in the page header of all pages, including the title page. Align the running head to the left margin. Do not use the label “Running head:” before the running head. | Prediction errors support children’s word learning |
|
| Use the page number 1 on the title page. Use the automatic page-numbering function of your word processing program to insert page numbers in the top right corner of the page header. | 1 |
The ICO exists to empower you through information.
Tackling barriers to privacy-enhancing technologies adoption - a PETs project report
Share this page.
- Share via Reddit
- Share via LinkedIn
- Share via email
Introduction
Our work on driving responsible pets adoption, participant views on pets adoption challenges, actions and recommendations to address barriers to adoption, appendix – selection process and participants.
Privacy-enhancing technologies (PETs) are technologies that support fundamental data protection principles by minimising the use of personal information and maximising information security. We have called for organisations to use PETs, 1 supporting this recommendation through our guidance, 2 case studies 3 and continued efforts to drive responsible adoption of PETs for safe data sharing. 4 Despite these efforts, PETs adoption remains low.
On 20 February 2024, we held an in-person workshop to gain a deeper understanding of the barriers to adoption that exist for both suppliers and users of PETs. We also wanted to identify potential solutions. This report presents a summary of findings from the workshop, key actions for us and recommendations for relevant stakeholders to increase responsible PETs adoption. This work is the culmination of a wider policy project aimed at increasing the adoption of PETs.
This report is intended for a wider audience of PETs developers and the sectors that were represented at the workshop. This report is particularly relevant if you belong to:
- an organisation in the public or private sector with data sharing requirements or objectives, facing barriers which using PETs may solve;
- an organisation that develops PETs;
- an organisation which is already deploying or exploring whether to deploy PETs;
- a technology training provider and certification body;
- a UK regulator, eg DRCF regulators; or 5
- a data protection regulator in another country.
We encourage PETs stakeholders to engage with the recommendations provided in this report to help stimulate responsible PETs adoption.
Report outline
The report contains three main sections.
Section one presents our research on the barriers to PETs adoption and our reasoning for convening the workshop to explore potential solutions.
Section two discusses the barriers to the adoption identified by participants throughout the workshop and anonymised survey responses.
Section three provides a set of recommendations from workshop participants to overcome barriers in adopting PETs. These recommendations are structured according to the groups and organisations they target. We also discuss the work we will be doing to address these challenges.
In this report, we collectively refer the organisations that that have an interest in deploying PETs as “data sharers” and organisations that develop PETs as a product or service as “technology providers”.
Further reading:
- ICO urges organisations to harness the power of data safely by using privacy enhancing technologies
- Privacy-enhancing technologies (PETs) guidance
- Case studies on pseudonymisation and anonymisation techniques and privacy enhancing technologies
- Workshop on privacy enhancing technologies
- About the DRCF
The uptake of PETs across multiple sectors remains low, despite the work on PETs undertaken by us and other relevant organisations. We recognise that adoption is not straightforward and that there are many factors that may prevent organisations from deploying PETs. As such, we initiated a review to help us better understand how these barriers to adoption materialise and how we may reasonably assist organisations on their PETs adoption journey.
Our research identified several barriers which prevent organisations from being able to deploy PETs, which include:
- a general limited awareness of PETs;
- inconsistent definitions and taxonomy of PETs;
- inadequate understanding of the risks and benefits;
- lack of technical expertise;
- lack of evidence around the use cases;
- uncertainty on the maturity of PETs to support their widespread use;
- unclear costs and benefits associated with PETs;
- complex pricing when bundling PETs products and supplementary services; and
- regulatory uncertainty around the use of PETs for compliance.
One of the most significant barriers identified was the different levels of available information between the supply and demand sides of the PETs market. This issue can lead to the parties procuring PETs on behalf of their organisation not sharing relevant information with the other parties. This problem is called information asymmetry. 6
These issues have led a risk-adverse approach to PETs adoption, particularly in their use for compliance with data protection law.
Our findings supported our decision to host a workshop to test perceptions of PETs adoption challenges and brainstorm solutions to help overcome them. The workshop was attended by representatives from public and private sector organisations with an interest in deploying PETs and representatives from the organisations that develop PETs as a product or service.
What is information asymmetry?
A key objective of our workshop was to learn how data sharers and technology providers differed in their understanding of PETs. Our pre-event survey revealed that data sharers, particularly those in the public sector, had significant knowledge gaps in comparison with technology providers.
There was a general consensus from participants that adoption should be higher than currently perceived. Attendees agreed that the adoption of PETs faces several barriers, including:
- a lack of understanding within organisations, which hampers internal buy-in and requires compelling use cases and clear value propositions;
- insufficient understanding by technology providers of the deployment environments for their products;
- uncertainty on how to assess the cost-benefit trade-off of using PETs;
- a lack of resources, including expertise, being root causes of failures to secure buy-in;
- concerns regarding the maturity of the PETs market; and
- a lack of regulatory clarity, particularly on assessing the status of data when using PETs.
We explore these issues in further detail below.
A lack of understanding on the costs against benefits of PETs
Data sharers highlighted the need for information and resources that they could use to secure internal buy-in.
More information is needed for SLT to adopt this tech across the business
We need compelling use cases […] that add value to the business.
How do we better sell the value proposition of PETs to the entire business?
Data sharers indicated that they are generally reluctant to adopt PETs due to the absence of immediate revenue gains, associated costs of implementing PETs and the current lack of regulatory pressure compelling their use.
The lack of return-on-investment PETs for use in public services was cited as a significant barrier. Participants noted that quantifying the value for money of implementing PETs within processes is challenging and seen as a barrier to adoption.
A lack of understanding of how PETs integrate into complex systems
Data sharers noted that technology providers need to better understand complex deployment environments that may present specific challenges. Participants also highlighted a need for greater understanding of PETs as part of a broader data governance framework, rather than PETs as a standalone technological solution.
The use of PETs needs to be planned from the outset and highly integrated in order to realise both the business benefit and the intended privacy outcome. It is useful to distinguish between privacy-enhanced services (which often use a combination of PETs and perform data processing operations on behalf of the customers) and the PETs themselves (which are technological additions to an organisation's internal technology stack).
Cost, resource and expertise
Data sharers identified cost and a lack of expertise as a root cause of failures to secure buy-in within an organisation to integrate PETs into existing data sharing. Uncertainty about the costs of PETs products was seen as a significant issue, both in terms of upfront procurement and ongoing costs associated with maintenance of the service.
Data sharers voiced concerns that costly in-house multidisciplinary teams (legal, finance, technical etc) are needed to present a compelling internal business case to senior colleagues and budget holders.
Market maturity
Data sharers widely agreed that the PETs market needed to mature further to enable widespread adoption.
It was great to understand how it works in practice with the examples and learn from the other participants. However now understanding the immaturity in the market, I may have more hesitation in pushing these solutions until further clarity is provided.
Legal uncertainty
There was misunderstanding from some participants about choosing an appropriate legal basis for sharing personal information via PETs.
Participants reflected that organisations often wanted to avoid designation as a controller because it entailed greater responsibility and assigning the appropriate designation can be challenging due to the complexities of PETs.
Challenges around assessing identifiability of data when using PETs was a common issue raised by participants. Developers focused on the ability of their PETs products to anonymise or reduce identifiability, in order to reduce or remove compliance requirements. However, data sharers often required re-identification (eg in patient care) and broadly described PETs as an enhancement to their existing data governance, as opposed to a means to avoid compliance responsibilities.
Workshop participants identified clear actions and recommendations to help mitigate the barriers to adoption discussed in this report. This section presents these recommendations in more detail.
The ICO has been a leading advocate for the adoption of PETs. Our PETs guidance, a world-first for a data protection authority, provides organisations with much needed clarity on how PETs help enable data protection compliance. Our PETs case studies demonstrate how organisations can use PETs to fulfil a variety of purposes.
In addition to our existing efforts in supporting PETs, participants asked for the ICO to provide further regulatory clarity on their use. This included:
- integrating our PETs guidance into other guidance products, eg to reduce risks to people in AI use cases;
- publishing further case studies to demonstrate best practice for potential adopters;
- contributing to the development of standards and accreditations for PETs with relevant stakeholders; and
- clarifying when PETs can provide effective anonymisation and pseudonymisation.
As the UK’s data protection regulator, we are committed to providing regulatory clarity on the appropriateness of PETs to implement the data protection principles effectively and safeguard people’s rights when sharing personal information.
We will integrate the recently-published PETs guidance into other relevant guidance products to show how they aid data protection compliance.
We are committed to working with relevant stakeholders to identify opportunities for developing certification schemes as a way for PETs solutions to demonstrate compliance.
We have already published several case studies, 7 and we are committed to publishing a case study for each of the PETs currently featured in our guidance. 8 We encourage other organisations to continue to publish high quality case studies. 9
We will be providing further clarity on the use of PETs as a way to anonymise personal information in the upcoming anonymisation guidance.
Recommendations for other stakeholders
Participants also provided numerous recommendations for other groups and organisations. We present these here for the benefit of a wider audience. The recommendations below do not reflect ICO policy.
Recommendations for the PETs industry
- In order to ensure that data sharing solutions can effectively integrate PETs, technology providers should work closely with data sharers to develop solutions which integrate seamlessly with legacy systems.
- Technology providers should offer clear information on how their products provide compliance and risk mitigation from a technical standpoint.
- Technology providers should ensure that pricing for their solutions is clear and straightforward to understand for potential customers.
Recommendations for government departments
- Organisations considering PETs need effective tools for evaluating the costs and associated benefits in order to make a strong business case for their use. We recently published a blog, alongside the Responsible Technology Adoption Unit (RTAU), on assessing cost benefits for federated learning. Further guidance to assist with cost benefits analysis for various PETs will follow later in 2024.
- Public sector bodies require effective decision-making tools to assess whether PETs are suitable for their use cases. Tools should consider factors such as data sensitivity, data protection requirements and technical feasibility. The UK Government could work with the ICO to leverage existing guidance from the Data Standards Agency and the RTAU’s PETs adoption guide to assist the public sector in decision-making.
- Public sector organisations are constrained in their ability to procure new tools by public procurement processes. Government procurement options could ensure a wider choice of technology providers for PETs, appropriate for meeting public sector requirements.
Recommendations for funding bodies
- In order to move beyond the tipping point for PETs adoption, early adopters are needed first. Funding bodies should consider backing pilot projects within specific sectors to serve as a proof of concept and encourage broader adoption. The US-UK PETs prize challenge is a successful example of how PETs providers can collaborate with the public and private sectors.
Recommendations for organisations who want to share data
- Organisations should work with the PETs industry and standards bodies to identify opportunities and requirements for certification schemes to demonstrate compliance. We welcome proposals for appropriate certification schemes leveraging PETs. 10
- Public sector organisations should engage with private sector organisations with experience of successfully deploying PETs. Sharing knowledge and experiences can help to address the issue of information asymmetries.
- Organisations needing further advice on data protection compliance using PETs should consider using services provided by the ICO. For example, our Sandbox 11 and Innovation Advice Service 12 can help organisations to understand how innovative solutions utilising PETs can help provide data protection compliance.
Recommendations for sector-specific bodies
- Industry bodies responsible for governance over a specific sector should provide further guidance on effective governance measures for PETs in their sector.
- Industry bodies should work closely with data sharing organisations to identify replicable solutions that would benefit from certification schemes under the UK GDPR. These schemes can provide regulatory assurance for PETs solutions. 13
Recommendations for other regulators
- Data protection authorities from other jurisdictions should provide further guidance and clear incentives on the use of PETs for data protection compliance. This includes their suitability for international transfers and their applicability as anonymisation and pseudonymisation techniques.
- The ICO Sandbox and (IMDA) Singapore sandbox have demonstrated the value of sandboxes for exploring how PETs-based solutions interact with data protection and other relevant legislation. Data protection authorities and regulators should increase the availability of sandboxes for PETs to test deployment.
Recommendations for training and certification bodies
- Training and certification providers should collaborate with the PETs industry and customers to identify key skills gaps and incorporate PETs into their curriculum. Training should be both accessible and affordable to a wide range of sectors.
- Case studies on pseudonymisation and anonymisation techniques and privacy-enhancing technologies
- G7 DPAs' Emerging Technologies Working Group use case study on privacy-enhancing technologies
- ODI – PETs in Practice
- UK GDPR certification schemes
- ICO regulatory sandbox
- ICO Innovation advice service
Over 30 representatives took part in our workshop (see below for a full list). All quotes and contributions in this report were anonymised, as this enabled a more open discussion.
Attendees were chosen via an open application process, in which we selected participants across a range of sectors and developers. The workshop also included people from intermediary organisations with in-depth expertise, including RTAU (formerly CDEI), and consultancy and legal firms with expertise in the area of PETs.
- Benjamin Moore – Responsible Technology Adoption Unit (formerly Centre for Data Ethics and Innovation)
- Caroline Parks – Expedia Group
- Chris Watts – Numbereight AI
- Claire Clements – NHS
- Daniel Pike – Covatic
- Dylan Summers – Lloyds
- Georgi Ganev – Hazy.com
- Ian Redman – MBWW
- James Wiggins – Honda EU
- John Lawson – NHS Wales
- Julie Varcoecocks – Serco
- Kara Kelly – Deloitte
- Kate McBay – Research Data Scotland
- Kuan Hon – Dentons
- Laura Robbins – Essex Police
- Lorayne Liebel – Flo Health
- Luk Arbuckle – Privacy Analytics
- Manuel Capel – Inpher
- Mattia Fosci – Anonymised IO
- Maurice Coyle – Truata
- Nick New – Optalysys
- Odvar Bjerkholt – BT
- Robert Pisarczyk – Oblivious
- Ronen Cohen – Duality Tech
- Rosie Nance – Norton Rose Fulbright
- Santiago Zanella-Beguelin – Microsoft
- Sarasi Randombage – HSBC
- Simon Crane – DHSC
- Simone Mangiante – Vodafone
- Sussie Anie – Responsible Technology Adoption Unit (formerly Centre for Data Ethics and Innovation)
- Susy Ralph – City of London School
- Vanessa Cocca – Aindo
- Wendy Butcher – The National Police Freedom of Information and Data Protection Unit
- Zoher Kapacee – HRA
1 ICO. ICO urges organisations to harness the power of data safely by using privacy enhancing technologies .
2 ICO. Privacy-enhancing technologies (PETs) .
3 ICO. Case studies on pseudonymisation and anonymisation techniques and privacy enhancing technologies .
4 ICO. Workshop of privacy enhancing technologies .
5 DRCF. About the DRCF .
6 The Economist. What is information asymmetry?
7 ICO. Case studies on pseudonymisation and anonymisation techniques and privacy enhancing technologies .
8 ICO. G7 DPAs' Emerging Technologies Working Group use case study on privacy enhancing technologies .
9 For example: ODI. PETs in Practice .
10 For example, UK GDPR Certifications .
11 ICO. Regulatory Sandbox .
12 ICO. Innovation advice service .
13 ICO. Certification schemes .
You are using an unsupported browser ×
You are using an unsupported browser. This web site is designed for the current versions of Microsoft Edge, Google Chrome, Mozilla Firefox, or Safari.
Site Feedback
The Office of the Federal Register publishes documents on behalf of Federal agencies but does not have any authority over their programs. We recommend you directly contact the agency associated with the content in question.
If you have comments or suggestions on how to improve the www.ecfr.gov website or have questions about using www.ecfr.gov, please choose the 'Website Feedback' button below.
If you would like to comment on the current content, please use the 'Content Feedback' button below for instructions on contacting the issuing agency
Website Feedback
- Incorporation by Reference
- Recent Updates
- Recent Changes
- Corrections
- Reader Aids Home
- Using the eCFR Point-in-Time System
- Understanding the eCFR
- Government Policy and OFR Procedures
- Developer Resources
- My Subscriptions
- Sign In / Sign Up
Hi, Sign Out
The Electronic Code of Federal Regulations
Enhanced content :: cross reference.
Enhanced content is provided to the user to provide additional context.
Navigate by entering citations or phrases (eg: suggestions#fillExample" class="example badge badge-info">1 CFR 1.1 suggestions#fillExample" class="example badge badge-info">49 CFR 172.101 suggestions#fillExample" class="example badge badge-info">Organization and Purpose suggestions#fillExample" class="example badge badge-info">1/1.1 suggestions#fillExample" class="example badge badge-info">Regulation Y suggestions#fillExample" class="example badge badge-info">FAR ).
Choosing an item from citations and headings will bring you directly to the content. Choosing an item from full text search results will bring you to those results. Pressing enter in the search box will also bring you to search results.
Background and more details are available in the Search & Navigation guide.
- Title 29 —Labor
- Subtitle B —Regulations Relating to Labor
- Chapter XXV —Employee Benefits Security Administration, Department of Labor
- Subchapter C —Reporting and Disclosure Under the Employee Retirement Income Security Act of 1974
- Part 2520 —Rules and Regulations for Reporting and Disclosure
- § 2520.104-46
Enhanced Content - Table of Contents
The in-page Table of Contents is available only when multiple sections are being viewed.
Use the navigation links in the gray bar above to view the table of contents that this content belongs to.
Enhanced Content - Details
29 U.S.C. 1021-1025 , 1027 , 1029-31 , 1059 , 1134 and 1135 ; and Secretary of Labor's Order 1-2011, 77 FR 1088 (Jan. 9, 2012). Sec. 2520.101-2 also issued under 29 U.S.C. 1132 , 1181-1183 , 1181 note , 1185 , 1185a -b, 1191, and 1191a-c. Sec. 2520.101-5 also issued under 29 U.S.C. 1021(f) . Sec. 2520.101-6 also issued under 29 U.S.C. 1021(k) . Sec. 2520.103-13 also issued under 29 U.S.C. 1023 . Secs. 2520.102-3, 2520.104b-1, 2520.104b-3, and 2520.104b-31 also issued under 29 U.S.C. 1003 , 1181-1183 , 1181 note , 1185 , 1185a -b, 1191, and 1191a-c. Secs. 2520.104b-1 and 2520.107 also issued under 26 U.S.C. 401 note , 111 Stat. 788.
43 FR 10140 , Mar. 10, 1978, unless otherwise noted.
Enhanced Content - Print
Generate PDF
This content is from the eCFR and may include recent changes applied to the CFR. The official, published CFR, is updated annually and available below under "Published Edition". You can learn more about the process here .
Enhanced Content - Display Options
The eCFR is displayed with paragraphs split and indented to follow the hierarchy of the document. This is an automated process for user convenience only and is not intended to alter agency intent or existing codification.
A separate drafting site is available with paragraph structure matching the official CFR formatting. If you work for a Federal agency, use this drafting site when drafting amendatory language for Federal regulations: switch to eCFR drafting site .
Enhanced Content - Subscribe
Subscribe to: 29 CFR 2520.104-46
Enhanced Content - Timeline
No changes found for this content after 1/03/2017.
Enhanced Content - Go to Date
Enhanced content - compare dates, enhanced content - published edition.
View the most recent official publication:
- View Title 29 on govinfo.gov
- View the PDF for 29 CFR 2520.104-46
These links go to the official, published CFR, which is updated annually. As a result, it may not include the most recent changes applied to the CFR. Learn more .
Enhanced Content - Developer Tools
This document is available in the following developer friendly formats:
- Hierarchy JSON - Title 29
- Content HTML - Section 2520.104-46
- Content XML - Section 2520.104-46
Information and documentation can be found in our developer resources .
eCFR Content
The Code of Federal Regulations (CFR) is the official legal print publication containing the codification of the general and permanent rules published in the Federal Register by the departments and agencies of the Federal Government. The Electronic Code of Federal Regulations (eCFR) is a continuously updated online version of the CFR. It is not an official legal edition of the CFR.
§ 2520.104-46 Waiver of examination and report of an independent qualified public accountant for employee benefit plans with fewer than 100 participants.
( a ) General.
( 1 ) Under the authority of section 103(a)(3)(A) of the Act, the Secretary may waive the requirements of section 103(a)(3)(A) in the case of a plan for which simplified annual reporting has been prescribed in accordance with section 104(a)(2) of the Act.
( 2 ) Under the authority of section 104(a)(3) of the Act the Secretary may exempt any employee welfare benefit plan from certain annual reporting requirements.
( b ) Application.
( i ) The administrator of an employee pension benefit plan for which simplified annual reporting has been prescribed in accordance with section 104(a)(2)(A) of the Act and § 2520.104-41 is not required to comply with the annual reporting requirements described in paragraph (c) of this section, provided that with respect to each plan year for which the waiver is claimed—
( 1 ) At least 95 percent of the assets of the plan constitute qualifying plan assets within the meaning of paragraph (b)(1)(ii) of this section, or
( 2 ) Any person who handles assets of the plan that do not constitute qualifying plan assets is bonded in accordance with the requirements of section 412 of the Act and the regulations issued thereunder, except that the amount of the bond shall not be less than the value of such assets;
( B ) The summary annual report (described in § 2520.104b-10 ) or, in the case of plans subject to section 101(f) of the Act, the annual funding notice (described in § 2520.101-5 ), includes, in addition to any other required information:
( 1 ) Except for qualifying plan assets described in paragraph (b)(1)(ii)(A) , (B) and (F) of this section, the name of each regulated financial institution holding (or issuing) qualifying plan assets and the amount of such assets reported by the institution as of the end of the plan year;
( 2 ) The name of the surety company issuing the bond, if the plan has more than 5% of its assets in non-qualifying plan assets;
( 3 ) A notice indicating that participants and beneficiaries may, upon request and without charge, examine, or receive copies of, evidence of the required bond and statements received from the regulated financial institutions describing the qualifying plan assets; and
( 4 ) A notice stating that participants and beneficiaries should contact the Regional Office of the U.S. Department of Labor's Employee Benefits Security Administration if they are unable to examine or obtain copies of the regulated financial institution statements or evidence of the required bond, if applicable; and
( C ) in response to a request from any participant or beneficiary, the administrator, without charge to the participant or beneficiary, makes available for examination, or upon request furnishes copies of, each regulated financial institution statement and evidence of any bond required by paragraph (b)(1)(i)(A)( 2 ).
( ii ) For purposes of paragraph (b)(1), the term “qualifying plan assets” means:
( A ) Qualifying employer securities, as defined in section 407(d)(5) of the Act and the regulations issued thereunder;
( B ) Any loan meeting the requirements of section 408(b)(1) of the Act and the regulations issued thereunder;
( C ) Any assets held by any of the following institutions:
( 1 ) A bank or similar financial institution as defined in § 2550.408b-4(c) ;
( 2 ) An insurance company qualified to do business under the laws of a state;
( 3 ) An organization registered as a broker-dealer under the Securities Exchange Act of 1934; or
( 4 ) Any other organization authorized to act as a trustee for individual retirement accounts under section 408 of the Internal Revenue Code.
( D ) Shares issued by an investment company registered under the Investment Company Act of 1940;
( E ) Investment and annuity contracts issued by any insurance company qualified to do business under the laws of a state; and,
( F ) In the case of an individual account plan, any assets in the individual account of a participant or beneficiary over which the participant or beneficiary has the opportunity to exercise control and with respect to which the participant or beneficiary is furnished, at least annually, a statement from a regulated financial institution referred to in paragraphs (b)(1)(ii)(C) , (D) or (E) of this section describing the assets held (or issued) by such institution and the amount of such assets.
( A ) For purposes of this paragraph (b)(1) , the determination of the percentage of all plan assets consisting of qualifying plan assets with respect to a given plan year shall be made in the same manner as the amount of the bond is determined pursuant to §§ 2580.412-11 , 2580.412-14 , and 2580.412-15 .
( B ) Examples. Plan A, which reports on a calendar year basis, has total assets of $600,000 as of the end of the 1999 plan year. Plan A's assets, as of the end of year, include: investments in various bank, insurance company and mutual fund products of $520,000; investments in qualifying employer securities of $40,000; participant loans, meeting the requirements of ERISA section 408(b)(1), totaling $20,000; and a $20,000 investment in a real estate limited partnership. Because the only asset of the plan that does not constitute a “qualifying plan asset” is the $20,000 real estate investment and that investment represents less than 5% of the plan's total assets, no bond would be required under the proposal as a condition for the waiver for the 2000 plan year. By contrast, Plan B also has total assets of $600,000 as of the end of the 1999 plan year, of which $558,000 constitutes “qualifying plan assets” and $42,000 constitutes non-qualifying plan assets. Because 7%—more than 5%—of Plan B's assets do not constitute “qualifying plan assets,” Plan B, as a condition to electing the waiver for the 2000 plan year, must ensure that it has a fidelity bond in an amount equal to at least $42,000 covering persons handling non-qualifying plan assets. Inasmuch as compliance with section 412 requires the amount of bonds to be not less than 10% of the amount of all the plan's funds or other property handled, the bond acquired for section 412 purposes may be adequate to cover the non-qualifying plan assets without an increase ( i.e. , if the amount of the bond determined to be needed for the relevant persons for section 412 purposes is at least $42,000). As demonstrated by the foregoing example, where a plan has more than 5% of its assets in non-qualifying plan assets, the bond required by the proposal is for the total amount of the non-qualifying plan assets, not just the amount in excess of 5%.
( 2 ) The administrator of an employee welfare benefit plan that covers fewer than 100 participants at the beginning of the plan year is not required to comply with annual reporting requirements described in paragraph (c) of this section.
( c ) Waiver. The administrator of a plan described in paragraph (b)(1) or (2) of this section is not required to:
( 1 ) Engage an independent qualified public accountant to conduct an examination of the financial statements of the plan;
( 2 ) Include within the annual report the financial statements and schedules prescribed in section 103(b) of the Act and §§ 2520.103-1 , 2520.103-2 , and 2520.103-10 ; and
( 3 ) Include within the annual report a report of an independent qualified public accountant as prescribed in section 103(a)(3)(A) of the Act and § 2520.103-1 .
( d ) Limitations.
( 1 ) The waiver described in this section does not affect the obligation of a plan described in paragraph (b) (1) or (2) of this section to file a Form 5500 “Annual Return/Report of Employee Benefit Plan,” including any required schedules or statements prescribed by the instructions to the form. See § 2520.104-41 .
( 2 ) For purposes of this section, an employee pension benefit plan for which simplified annual reporting has been prescribed includes an employee pension benefit plan which elects to file a Form 5500 as a small plan pursuant to § 2520.103-1(d) with respect to the plan year for which the waiver is claimed. See § 2520.104-41 .
( 3 ) For purposes of this section, an employee welfare benefit plan that covers fewer than 100 participants at the beginning of the plan year includes an employee welfare benefit plan which elects to file a Form 5500 as a small plan pursuant to § 2520.103-1(d) with respect to the plan year for which the waiver is claimed. See § 2520.104-41 .
( 4 ) A plan that elects to file a Form 5500 as a large plan pursuant to § 2520.103-1(d) may not claim a waiver under this section.
( e ) Model notice. The appendix to this section contains model language for inclusion in the summary annual report to assist plan administrators in complying with the requirements of paragraph (b)(1)(i)(B) of this section to avail themselves of the waiver of examination and report of the independent qualified public accountant for employee benefit plans with fewer than 100 participants. Use of the model language is not mandatory. In order to use the model language in the plan's summary annual report, administrators must, in addition to any other information required to be in the summary annual report, select among alternative language and add relevant information where appropriate in the model language. Items of information that are not applicable to a particular plan may be deleted. Use of the model language, appropriately modified and supplemented, will be deemed to satisfy the notice content requirements of paragraph (b)(1)(i)(B) of this section.
Appendix to § 2520.104-46—Model Summary Annual Report Notice (Plan Administrators Will Need to Modify the Model to Omit Information That Is Not Applicable to the Plan)
The U.S. Department of Labor's regulations require that an independent qualified public accountant audit the plan's financial statements unless certain conditions are met for the audit requirement to be waived. This plan met the audit waiver conditions for the plan year beginning (insert year) and therefore has not had an audit performed. Instead, the following information is provided to assist you in verifying that the assets reported on the (Form 5500 or Form 5500-SF—select as applicable) were actually held by the plan.
At the end of the (insert year) plan year, the plan had (include separate entries for each regulated financial institution holding or issuing qualifying plan assets):
[Set forth amounts and names of institutions as applicable where indicated], [(insert $ amount) in assets held by (insert name of bank)], [(insert $ amount) in securities held by (insert name of registered broker-dealer)], [(insert $ amount) in shares issued by (insert name of registered investment company)], [(insert $ amount) in investment or annuity contract issued by (insert name of insurance company)].
The plan receives year-end statements from these regulated financial institutions that confirm the above information. [Insert as applicable—The remainder of the plan's assets were (1) qualifying employer securities, (2) loans to participants, (3) held in individual participant accounts with investments directed by participants and beneficiaries and with account statements from regulated financial institutions furnished to the participant or beneficiary at least annually, or (4) other assets covered by a fidelity bond at least equal to the value of the assets and issued by an approved surety company.]
Plan participants and beneficiaries have a right, on request and free of charge, to get copies of the financial institution year-end statements and evidence of the fidelity bond. If you want to examine or get copies of the financial institution year-end statements or evidence of the fidelity bond, please contact [insert mailing address and any other available way to request copies such as e-mail and phone number].
If you are unable to obtain or examine copies of the regulated financial institution statements or evidence of the fidelity bond, you may contact the regional office of the U.S. Department of Labor's Employee Benefits Security Administration (EBSA) for assistance by calling toll-free 1.866.444.EBSA (3272). A listing of EBSA regional offices can be found at http://www.dol.gov/ebsa .
General information regarding the audit waiver conditions applicable to the plan can be found on the U.S. Department of Labor Web site at http://www.dol.gov/ebsa under the heading “Frequently Asked Questions.”
[ 43 FR 10151 , Mar. 10, 1978, as amended at 43 FR 14010 , Apr. 4, 1978; 45 FR 51447 , Aug. 1, 1980; 54 FR 8629 , Mar. 1, 1989; 65 FR 21085 , Apr. 19, 2000; 65 FR 62973 , Oct. 19, 2000; 72 FR 64728 , Nov. 16, 2007; 80 FR 5663 , Feb. 2, 2015]
Reader Aids
Information.
- About This Site
- Legal Status
- Accessibility
- No Fear Act
- Continuity Information
- Environment
- Science & Technology
- Business & Industry
- Health & Public Welfare
- Topics (CFR Indexing Terms)
- Public Inspection
- Presidential Documents
- Document Search
- Advanced Document Search
- Public Inspection Search
- Reader Aids Home
- Office of the Federal Register Announcements
- Using FederalRegister.Gov
- Understanding the Federal Register
- Recent Site Updates
- Federal Register & CFR Statistics
- Videos & Tutorials
- Developer Resources
- Government Policy and OFR Procedures
- Congressional Review
- My Clipboard
- My Comments
- My Subscriptions
- Sign In / Sign Up
- Site Feedback
- Search the Federal Register
This site displays a prototype of a “Web 2.0” version of the daily Federal Register. It is not an official legal edition of the Federal Register, and does not replace the official print version or the official electronic version on GPO’s govinfo.gov.
The documents posted on this site are XML renditions of published Federal Register documents. Each document posted on the site includes a link to the corresponding official PDF file on govinfo.gov. This prototype edition of the daily Federal Register on FederalRegister.gov will remain an unofficial informational resource until the Administrative Committee of the Federal Register (ACFR) issues a regulation granting it official legal status. For complete information about, and access to, our official publications and services, go to About the Federal Register on NARA's archives.gov.
The OFR/GPO partnership is committed to presenting accurate and reliable regulatory information on FederalRegister.gov with the objective of establishing the XML-based Federal Register as an ACFR-sanctioned publication in the future. While every effort has been made to ensure that the material on FederalRegister.gov is accurately displayed, consistent with the official SGML-based PDF version on govinfo.gov, those relying on it for legal research should verify their results against an official edition of the Federal Register. Until the ACFR grants it official status, the XML rendition of the daily Federal Register on FederalRegister.gov does not provide legal notice to the public or judicial notice to the courts.
Design Updates: As part of our ongoing effort to make FederalRegister.gov more accessible and easier to use we've enlarged the space available to the document content and moved all document related data into the utility bar on the left of the document. Read more in our feature announcement .
Self-Regulatory Organizations; Nasdaq GEMX, LLC; Notice of Filing and Immediate Effectiveness of Proposed Rule Change To Amend the Exchange's Pricing Schedule at Options 7, Section 3
A Notice by the Securities and Exchange Commission on 08/19/2024
This document has been published in the Federal Register . Use the PDF linked in the document sidebar for the official electronic format.
- Document Details Published Content - Document Details Agency Securities and Exchange Commission Agency/Docket Numbers Release No. 34-100722 File No. SR-GEMX-2024-27 Document Citation 89 FR 67117 Document Number 2024-18476 Document Type Notice Pages 67117-67120 (4 pages) Publication Date 08/19/2024 Published Content - Document Details
- View printed version (PDF)
This table of contents is a navigational tool, processed from the headings within the legal text of Federal Register documents. This repetition of headings to form internal navigation links has no substantive legal effect.
I. Self-Regulatory Organization's Statement of the Terms of Substance of the Proposed Rule Change
Ii. self-regulatory organization's statement of the purpose of, and statutory basis for, the proposed rule change, a. self-regulatory organization's statement of the purpose of, and statutory basis for, the proposed rule change, 2. statutory basis, b. self-regulatory organization's statement on burden on competition, c. self-regulatory organization's statement on comments on the proposed rule change received from members, participants, or others, iii. date of effectiveness of the proposed rule change and timing for commission action, iv. solicitation of comments, electronic comments, paper comments.
This feature is not available for this document.
Additional information is not currently available for this document.
- Sharing Enhanced Content - Sharing Shorter Document URL https://www.federalregister.gov/d/2024-18476 Email Email this document to a friend Enhanced Content - Sharing
- Print this document
Document page views are updated periodically throughout the day and are cumulative counts for this document. Counts are subject to sampling, reprocessing and revision (up or down) throughout the day.
This document is also available in the following formats:
More information and documentation can be found in our developer tools pages .
This PDF is the current document as it appeared on Public Inspection on 08/16/2024 at 8:45 am.
It was viewed 0 times while on Public Inspection.
If you are using public inspection listings for legal research, you should verify the contents of the documents against a final, official edition of the Federal Register. Only official editions of the Federal Register provide legal notice of publication to the public and judicial notice to the courts under 44 U.S.C. 1503 & 1507 . Learn more here .
Document headings vary by document type but may contain the following:
- the agency or agencies that issued and signed a document
- the number of the CFR title and the number of each part the document amends, proposes to amend, or is directly related to
- the agency docket number / agency internal file number
- the RIN which identifies each regulatory action listed in the Unified Agenda of Federal Regulatory and Deregulatory Actions
See the Document Drafting Handbook for more details.
Securities and Exchange Commission
- [Release No. 34-100722; File No. SR-GEMX-2024-27]
Pursuant to Section 19(b)(1) of the Securities Exchange Act of 1934 (“Act”), [ 1 ] and Rule 19b-4 thereunder, [ 2 ] notice is hereby given that on August 1, 2024, Nasdaq GEMX, LLC (“GEMX” or “Exchange”) filed with the Securities and Exchange Commission (“SEC” or “Commission”) the proposed rule change as described in Items I, II, and III, below, which Items have been prepared by the Exchange. The Commission is publishing this notice to solicit comments on the proposed rule change from interested persons.
The Exchange proposes to amend the Exchange's Pricing Schedule at Options 7, Section 3.
The text of the proposed rule change is available on the Exchange's website at https://listingcenter.nasdaq.com/rulebook/gemx/rules , at the principal office of the Exchange, and at the Commission's Public Reference Room.
In its filing with the Commission, the Exchange included statements concerning the purpose of and basis for the proposed rule change and discussed any comments it received on the proposed rule change. The text of these statements may be examined at the places specified in Item IV below. The Exchange has prepared summaries, set forth in sections A, B, and C below, of the most significant aspects of such statements.
The purpose of the proposed rule change is to amend the Exchange's ( print page 67118) Pricing Schedule at Options 7, Section 3.
Today, as set forth in Options 7, Section 3, the Exchange assesses Market Makers [ 3 ] and Priority Customers [ 4 ] the below tiered maker/taker pricing for adding/removing liquidity in Penny Symbols.
| Market participant | Maker rebate: Tier 1 | Maker rebate: Tier 2 | Maker rebate: Tier 3 | Maker rebate: Tier 4 | Maker rebate: Tier 5 | Taker fee: Tier 1 | Taker fee: Tier 2 | Taker fee: Tier 3 | Taker fee: Tier 4 | Taker fee: Tier 5 |
|---|---|---|---|---|---|---|---|---|---|---|
| Market Maker | ($0.20) | ($0.25) | ($0.30) | ($0.32) | ($0.41) | $0.50 | $0.50 | $0.50 | $0.50 | $0.48 |
| Priority Customer | (0.25) | (0.43) | (0.48) | (0.51) | (0.53) | 0.41 | 0.41 | 0.41 | 0.41 | 0.41 |
The Exchange now proposes to assess Market Makers and Priority Customers separate pricing for SPY, QQQ, and IWM in lieu of the maker/taker pricing set forth above for other Penny Symbols. First, the Exchange proposes to pay Market Makers a $0.41 per contract Maker Rebate in Tiers 1-5 for SPY, QQQ, and IWM (instead of the current Maker Rebates in Tiers 1-5 ranging from $0.20 to $0.41 per contract). [ 5 ] Second, the Exchange proposes to assess Priority Customers a $0.45 per contract Taker Fee in Tiers 1-5 for SPY, QQQ, and IWM (instead of the current $0.41 per contract Taker Fee in Tiers 1-5). [ 6 ] Third, the Exchange proposes to reduce the new $0.45 per contract Taker Fee in Tiers 1-5 for SPY, QQQ, and IWM by $0.02 per contract when the Preferred Market Maker [ 7 ] transacts against a Priority Customer Order directed to that Preferred Market Maker for execution. [ 8 ]
The Exchange will set forth the above changes in proposed notes 15 and 17 of Options 7, Section 3. Proposed note 15 will provide: “Market Maker Tier 1 through Tier 5 Maker Rebates in Penny Symbols will be ($0.41) per contract for the following option symbols: SPY, QQQ and IWM. Priority Customer Tier 1 through Tier 5 Taker Fees in Penny Symbols will be $0.45 per contract for the following option symbols: SPY, QQQ and IWM.” Proposed note 17 will provide: “Priority Customer Tier 1 through Tier 5 Taker Fees in SPY, QQQ, and IWM set forth in note 15 above will be decreased by $0.02 per contract when the Preferred Market Maker transacts against a Priority Customer Order directed to that Preferred Market Maker for execution.”
The Exchange believes that its proposal is consistent with Section 6(b) of the Act, [ 9 ] in general, and furthers the objectives of Sections 6(b)(4) and 6(b)(5) of the Act, [ 10 ] in particular, in that it provides for the equitable allocation of reasonable dues, fees, and other charges among members and issuers and other persons using any facility, and is not designed to permit unfair discrimination between customers, issuers, brokers, or dealers.
The Exchange's proposed changes to its schedule of credits are reasonable in several respects. As a threshold matter, the Exchange is subject to significant competitive forces in the market for options securities transaction services that constrain its pricing determinations in that market. The fact that this market is competitive has long been recognized by the courts. In NetCoalition v. Securities and Exchange Commission, the D.C. Circuit stated as follows: “[n]o one disputes that competition for order flow is `fierce.' . . . As the SEC explained, `[i]n the U.S. national market system, buyers and sellers of securities, and the broker-dealers that act as their order-routing agents, have a wide range of choices of where to route orders for execution'; [and] `no exchange can afford to take its market share percentages for granted' because `no exchange possesses a monopoly, regulatory or otherwise, in the execution of order flow from broker dealers'. . . .” [ 11 ]
The Commission and the courts have repeatedly expressed their preference for competition over regulatory intervention in determining prices, products, and services in the securities markets. In Regulation NMS, while adopting a series of steps to improve the current market model, the Commission highlighted the importance of market forces in determining prices and SRO revenues and, also, recognized that current regulation of the market system “has been remarkably successful in promoting market competition in its broader forms that are most important to investors and listed companies.” [ 12 ]
Numerous indicia demonstrate the competitive nature of this market. For example, clear substitutes to the Exchange exist in the market for options security transaction services. The Exchange is only one of seventeen options exchanges to which market participants may direct their order flow. Within this environment, market participants can freely and often do shift their order flow among the Exchange and competing venues in response to changes in their respective pricing schedules. As such, the proposal represents a reasonable attempt by the Exchange to increase its liquidity and market share relative to its competitors.
The Exchange believes that the proposed changes to the maker/taker pricing in SPY, QQQ, and IWM for Market Makers and Priority Customers in the manner described above are reasonable, equitable and not unfairly discriminatory for the reasons that follow.
The Exchange believes it is reasonable to pay Market Makers a $0.41 per contract Maker Rebate in Tiers 1-5 for SPY, QQQ, and IWM (instead of the current Maker Rebates in Tiers 1-5 ranging from $0.20 to $0.41 per contract) because the proposed changes are intended to encourage Market Makers to add more liquidity in these three symbols. Specifically, the proposal ( print page 67119) generally provides Market Makers significantly higher Maker Rebates in SPY, QQQ, and IWM than they receive today except for the Tier 5 Maker Rebate, which is currently the highest Maker Rebate in Penny Symbols for Market Makers and will remain the same as today. Accordingly, the Exchange believes that Market Makers will continue to be incentivized to add liquidity in these symbols on the Exchange. Increased liquidity benefits all market participants by deepening the Exchange's liquidity pool and supporting the quality of price discovery.
The Exchange also believes that it is reasonable to assess Priority Customers a $0.45 per contract Taker Fee in Tiers 1-5 for SPY, QQQ, and IWM (instead of the current $0.41 per contract Taker Fee in Tiers 1-5). While Priority Customers will be charged higher Taker Fees for SPY, QQQ, and IWM than the Taker Fees currently assessed, the Exchange believes that the increased Taker Fees are appropriate to offset the proposed Maker Market Maker Rebates for SPY, QQQ, and IWM. Furthermore, Priority Customers will continue to be assessed lower Taker Fees in Penny Symbols compared to all other market participants today. [ 13 ]
The Exchange believes that reducing the Priority Customer Taker Fee in Tiers 1-5 for SPY, QQQ, and IWM by $0.02 per contract when the Preferred Market Maker transacts against a Priority Customer Order directed to that Preferred Market Maker for execution is reasonable because the Exchange seeks to incentivize Members to direct more Priority Customer order flow in these symbols to the Exchange. As discussed above, the proposal provides the reduced Taker Fee benefit to the Priority Customer. To the extent the proposal attracts more Priority Customer order flow in SPY, QQQ, and IWM to the Exchange, the Exchange believes that this will benefit all market participants through increased trading opportunities. The Exchange also represents that for orders directed to Preferred Market Makers, Preferred Market Makers are unaware of the identity of the contra-party prior to and at the time of the trade. Furthermore, Options 9, Section 1 (Just and Equitable Principles of Trade) and Options 9, Section 9 (Prevention of the Misuse of Material Nonpublic Information) [ 14 ] are intended to prohibit coordinated actions between Preferred Market Makers and Order Flow Providers, [ 15 ] and the Exchange proactively conducts surveillance for, and enforces against, such violations. Finally, of note, a Market Maker must be quoting at the better of the internal BBO or the NBBO at the time the Preferenced Order is received to be allocated, as required by Options 2, Section 10.
The Exchange also believes that assessing different pricing for SPY, QQQ and IWM, as compared to other symbols, is reasonable because trading in SPY, QQQ and IWM is different from trading in other symbols in that they are more liquid, have higher volume and competition for executions is more intense.
The Exchange believes that it is equitable and not unfairly discriminatory to provide the proposed Maker Rebate Tiers 1-5 for SPY, QQQ, and IWM to Market Makers because they have different requirements and additional obligations that other market participants do not (such as quoting requirements). [ 16 ] As discussed above, the proposed Maker Rebates of $0.41 per contract are designed to continue to incentivize Market Maker add liquidity activity in SPY, QQQ, and IWM, thereby facilitating tighter spreads and contributing towards a robust, well-balanced market ecosystem, to the benefit of all market participants.
The Exchange further believes that it is equitable and not unfairly discriminatory to assess Priority Customers a $0.45 per contract Taker Fee in Tiers 1-5 for SPY, QQQ, and IWM because Priority Customers will continue to be assessed lower Taker Fees in Penny Symbols compared to all other market participants today. As such, the Exchange believes that the proposed taker pricing will continue to incentivize Priority Customer order flow in SPY, QQQ, and IWM to the Exchange. An increase in Priority Customer order flow benefits all market participants by providing more trading opportunities, which attracts Market Makers. An increase in the activity of these market participants, in turn, facilitates tighter spreads, which may cause an additional corresponding increase in order flow from other market participants, to the benefit of all market participants.
The Exchange further believes it is equitable and not unfairly discriminatory to reduce the Priority Customer Taker Fee in Tiers 1-5 for SPY, QQQ, and IWM set forth in proposed note 15 by $0.02 per contract when the Preferred Market Maker transacts against a Priority Customer Order directed to that Preferred Market Maker for execution. Any Member can be an Order Flow Provider (as defined in Options 2, Section 10) and may direct a Priority Customer order to any Market Maker on the Exchange. [ 17 ] Furthermore, the proposal seeks to encourage more Priority Customer order flow in SPY, QQQ, and IWM to the Exchange by providing a reduced Taker Fee to Priority Customers in the manner discussed above. An increase in Priority Customer order flow benefits all market participants by providing more trading opportunities, which attracts Market Makers. An increase in the activity of these market participants, in turn, facilitates tighter spreads, which may cause an additional corresponding increase in order flow from other market participants, to the benefit of all market participants.
The Exchange does not believe that the proposed rule change will impose any burden on competition not necessary or appropriate in furtherance of the purposes of the Act.
In terms of intra-market competition, the Exchange does not believe that its proposal will place any category of market participants at a competitive disadvantage. The Exchange believes that all of the changes proposed above will incentivize market participants to direct more order flow to the Exchange, to the benefit of all market participants who may interact with this order flow. While some aspects of the proposal apply directly to Market Makers (through the Market Maker Tier 1 through Tier 5 Maker Rebates for SPY, QQQ, and IWM) or Priority Customers (through the Priority Customer Tier 1 through Tier 5 Taker Fees for SPY, QQQ, and IWM; and the reduced Priority Customer Tier 1 through 5 Taker Fees for SPY, QQQ, and IWM when the Preferred Market Maker transacts against a Priority Customer Order directed to that Preferred Market Maker for execution), the Exchange believes that the proposed changes taken together will fortify and encourage activity, especially Market Maker and Priority Customer activity, on the Exchange. As discussed above, all ( print page 67120) market participants will benefit from any increase in market activity that the proposal effectuates. As it relates to the reduced Taker Fee in SPY, QQQ, and IWM for Priority Customers, any Member can be an Order Flow Provider, and may direct a Priority Customer Order to any Market Maker at any time on an order by order basis.
In terms of inter-market competition, the Exchange notes that it operates in a highly competitive market in which market participants can readily favor competing venues if they deem fee levels at a particular venue to be excessive, or rebate opportunities available at other venues to be more favorable. In such an environment, the Exchange must continually adjust its fees to remain competitive with other options exchanges. Because competitors are free to modify their own fees in response, and because market participants may readily adjust their order routing practices, the Exchange believes that the degree to which fee changes in this market may impose any burden on competition is extremely limited. In sum, if the changes proposed herein are unattractive to market participants, it is likely that the Exchange will lose market share as a result. Accordingly, the Exchange does not believe that the proposed changes will impair the ability of members or competing order execution venues to maintain their competitive standing in the financial markets.
No written comments were either solicited or received.
The foregoing rule change has become effective pursuant to Section 19(b)(3)(A)(ii) of the Act. [ 18 ] At any time within 60 days of the filing of the proposed rule change, the Commission summarily may temporarily suspend such rule change if it appears to the Commission that such action is: (i) necessary or appropriate in the public interest; (ii) for the protection of investors; or (iii) otherwise in furtherance of the purposes of the Act. If the Commission takes such action, the Commission shall institute proceedings to determine whether the proposed rule should be approved or disapproved.
Interested persons are invited to submit written data, views and arguments concerning the foregoing, including whether the proposed rule change is consistent with the Act. Comments may be submitted by any of the following methods:
- Use the Commission's internet comment form ( https://www.sec.gov/rules/sro.shtml ); or
- Send an email to [email protected] . Please include file number SR-GEMX-2024-27 on the subject line.
- Send paper comments in triplicate to Secretary, Securities and Exchange Commission, 100 F Street NE, Washington, DC 20549-1090.
All submissions should refer to file number SR-GEMX-2024-27. This file number should be included on the subject line if email is used. To help the Commission process and review your comments more efficiently, please use only one method. The Commission will post all comments on the Commission's internet website ( https://www.sec.gov/rules/sro.shtml ). Copies of the submission, all subsequent amendments, all written statements with respect to the proposed rule change that are filed with the Commission, and all written communications relating to the proposed rule change between the Commission and any person, other than those that may be withheld from the public in accordance with the provisions of 5 U.S.C. 552 , will be available for website viewing and printing in the Commission's Public Reference Room, 100 F Street NE, Washington, DC 20549, on official business days between the hours of 10 a.m. and 3 p.m. Copies of the filing also will be available for inspection and copying at the principal office of the Exchange. Do not include personal identifiable information in submissions; you should submit only information that you wish to make available publicly. We may redact in part or withhold entirely from publication submitted material that is obscene or subject to copyright protection. All submissions should refer to file number SR-GEMX-2024-27 and should be submitted on or before September 9, 2024.
For the Commission, by the Division of Trading and Markets, pursuant to delegated authority. [ 19 ]
Sherry R. Haywood,
Assistant Secretary.
1. 15 U.S.C. 78s(b)(1) .
2. 17 CFR 240.19b-4 .
3. A “Market Maker” is a market maker as defined in Nasdaq GEMX Options 1, Section 1(a)(21).
4. A “Priority Customer” is a person or entity that is not a broker/dealer in securities, and does not place more than 390 orders in listed options per day on average during a calendar month for its own beneficial account(s), as defined in Nasdaq GEMX Options 1, Section 1(a)(36).
5. See proposed note 15 of Options 7, Section 3.
6. See id.
7. Today, an Electronic Access Member may designate a “Preferred Market Maker” on orders it enters into the System. A Preferred Market Maker may be the Primary Market Maker appointed to the options class or any Competitive Market Maker appointed to the options class. Market Makers may be categorized as Preferred Market Makers when such Market Makers execute against a “Preferenced Order” directed to them for execution by an Order Flow Provider. An Order Flow Provider means any Member that submits, as agent, orders to the Exchange. The Preferred Market Maker must be quoting at the better of the internal BBO or NBBO at the time the Preferenced Order is received in order to receive the Preferred Market Maker allocation described in Options 3, Section 10(c)(1)(C). See Options 2, Section 10. See also Securities Exchange Act Release No. 100612 (July 29, 2024) (SR-GEMX-2024-20) (amending, among other changes that are immediately effective but not yet operative, Options 2, Section 10 that sets forth the aforementioned definitions) .
8. See proposed note 17 of Options 7, Section 3.
9. 15 U.S.C. 78f(b) .
10. 15 U.S.C. 78f(b)(4) and (5) .
11. NetCoalition v. SEC, 615 F.3d 525, 539 (D.C. Cir. 2010) (quoting Securities Exchange Act Release No. 59039 (December 2, 2008), 73 FR 74770 , 74782-83 (December 9, 2008) (SR-NYSEArca-2006-21)).
12. Securities Exchange Act Release No. 51808 (June 9, 2005), 70 FR 37496 , 37499 (June 29, 2005) (“Regulation NMS Adopting Release”).
13. Specifically, Market Makers and Non-Nasdaq GEMX Market Makers are currently assessed Taker Fees in Penny Symbols ranging from $0.48 to $0.50 per contract. In addition, Firm Proprietary/Broker-Dealers and Professional Customers are currently assessed Taker Fees ranging from $0.49 to $0.50 per contract. See Options 7, Section 3.
14. GEMX Options 9, Sections 1 and 9 incorporates ISE Options 9, Sections 1 and 9 by reference.
15. An Order Flow Provider means any Member that submits, as agent, orders to the Exchange. See supra note 7.
16. See Options 2, Section 5.
17. An Order Flow Provider, by definition, means any Member that submits, as agent, orders to the Exchange. See supra note 7.
18. 15 U.S.C. 78s(b)(3)(A)(ii) .
19. 17 CFR 200.30-3(a)(12) .
[ FR Doc. 2024-18476 Filed 8-16-24; 8:45 am]
BILLING CODE 8011-01-P
- Executive Orders
Reader Aids
Information.
- About This Site
- Legal Status
- Accessibility
- No Fear Act
- Continuity Information

Want to create or adapt books like this? Learn more about how Pressbooks supports open publishing practices.
Presenting Your Research
49 Writing a Research Report in American Psychological Association (APA) Style
Learning objectives.
- Identify the major sections of an APA-style research report and the basic contents of each section.
- Plan and write an effective APA-style research report.
In this section, we look at how to write an APA-style empirical research report , an article that presents the results of one or more new studies. Recall that the standard sections of an empirical research report provide a kind of outline. Here we consider each of these sections in detail, including what information it contains, how that information is formatted and organized, and tips for writing each section. At the end of this section is a sample APA-style research report that illustrates many of these principles.
Sections of a Research Report
Title page and abstract.
An APA-style research report begins with a title page . The title is centered in the upper half of the page, with each important word capitalized. The title should clearly and concisely (in about 12 words or fewer) communicate the primary variables and research questions. This sometimes requires a main title followed by a subtitle that elaborates on the main title, in which case the main title and subtitle are separated by a colon. Here are some titles from recent issues of professional journals published by the American Psychological Association.
- Sex Differences in Coping Styles and Implications for Depressed Mood
- Effects of Aging and Divided Attention on Memory for Items and Their Contexts
- Computer-Assisted Cognitive Behavioral Therapy for Child Anxiety: Results of a Randomized Clinical Trial
- Virtual Driving and Risk Taking: Do Racing Games Increase Risk-Taking Cognitions, Affect, and Behavior?
Below the title are the authors’ names and, on the next line, their institutional affiliation—the university or other institution where the authors worked when they conducted the research. As we have already seen, the authors are listed in an order that reflects their contribution to the research. When multiple authors have made equal contributions to the research, they often list their names alphabetically or in a randomly determined order.
It’s Soooo Cute! How Informal Should an Article Title Be?
In some areas of psychology, the titles of many empirical research reports are informal in a way that is perhaps best described as “cute.” They usually take the form of a play on words or a well-known expression that relates to the topic under study. Here are some examples from recent issues of the Journal Psychological Science .
- “Smells Like Clean Spirit: Nonconscious Effects of Scent on Cognition and Behavior”
- “Time Crawls: The Temporal Resolution of Infants’ Visual Attention”
- “Scent of a Woman: Men’s Testosterone Responses to Olfactory Ovulation Cues”
- “Apocalypse Soon?: Dire Messages Reduce Belief in Global Warming by Contradicting Just-World Beliefs”
- “Serial vs. Parallel Processing: Sometimes They Look Like Tweedledum and Tweedledee but They Can (and Should) Be Distinguished”
- “How Do I Love Thee? Let Me Count the Words: The Social Effects of Expressive Writing”
Individual researchers differ quite a bit in their preference for such titles. Some use them regularly, while others never use them. What might be some of the pros and cons of using cute article titles?
For articles that are being submitted for publication, the title page also includes an author note that lists the authors’ full institutional affiliations, any acknowledgments the authors wish to make to agencies that funded the research or to colleagues who commented on it, and contact information for the authors. For student papers that are not being submitted for publication—including theses—author notes are generally not necessary.
The abstract is a summary of the study. It is the second page of the manuscript and is headed with the word Abstract . The first line is not indented. The abstract presents the research question, a summary of the method, the basic results, and the most important conclusions. Because the abstract is usually limited to about 200 words, it can be a challenge to write a good one.
Introduction
The introduction begins on the third page of the manuscript. The heading at the top of this page is the full title of the manuscript, with each important word capitalized as on the title page. The introduction includes three distinct subsections, although these are typically not identified by separate headings. The opening introduces the research question and explains why it is interesting, the literature review discusses relevant previous research, and the closing restates the research question and comments on the method used to answer it.
The Opening
The opening , which is usually a paragraph or two in length, introduces the research question and explains why it is interesting. To capture the reader’s attention, researcher Daryl Bem recommends starting with general observations about the topic under study, expressed in ordinary language (not technical jargon)—observations that are about people and their behavior (not about researchers or their research; Bem, 2003 [1] ). Concrete examples are often very useful here. According to Bem, this would be a poor way to begin a research report:
Festinger’s theory of cognitive dissonance received a great deal of attention during the latter part of the 20th century (p. 191)
The following would be much better:
The individual who holds two beliefs that are inconsistent with one another may feel uncomfortable. For example, the person who knows that they enjoy smoking but believes it to be unhealthy may experience discomfort arising from the inconsistency or disharmony between these two thoughts or cognitions. This feeling of discomfort was called cognitive dissonance by social psychologist Leon Festinger (1957), who suggested that individuals will be motivated to remove this dissonance in whatever way they can (p. 191).
After capturing the reader’s attention, the opening should go on to introduce the research question and explain why it is interesting. Will the answer fill a gap in the literature? Will it provide a test of an important theory? Does it have practical implications? Giving readers a clear sense of what the research is about and why they should care about it will motivate them to continue reading the literature review—and will help them make sense of it.
Breaking the Rules
Researcher Larry Jacoby reported several studies showing that a word that people see or hear repeatedly can seem more familiar even when they do not recall the repetitions—and that this tendency is especially pronounced among older adults. He opened his article with the following humorous anecdote:
A friend whose mother is suffering symptoms of Alzheimer’s disease (AD) tells the story of taking her mother to visit a nursing home, preliminary to her mother’s moving there. During an orientation meeting at the nursing home, the rules and regulations were explained, one of which regarded the dining room. The dining room was described as similar to a fine restaurant except that tipping was not required. The absence of tipping was a central theme in the orientation lecture, mentioned frequently to emphasize the quality of care along with the advantages of having paid in advance. At the end of the meeting, the friend’s mother was asked whether she had any questions. She replied that she only had one question: “Should I tip?” (Jacoby, 1999, p. 3)
Although both humor and personal anecdotes are generally discouraged in APA-style writing, this example is a highly effective way to start because it both engages the reader and provides an excellent real-world example of the topic under study.
The Literature Review
Immediately after the opening comes the literature review , which describes relevant previous research on the topic and can be anywhere from several paragraphs to several pages in length. However, the literature review is not simply a list of past studies. Instead, it constitutes a kind of argument for why the research question is worth addressing. By the end of the literature review, readers should be convinced that the research question makes sense and that the present study is a logical next step in the ongoing research process.
Like any effective argument, the literature review must have some kind of structure. For example, it might begin by describing a phenomenon in a general way along with several studies that demonstrate it, then describing two or more competing theories of the phenomenon, and finally presenting a hypothesis to test one or more of the theories. Or it might describe one phenomenon, then describe another phenomenon that seems inconsistent with the first one, then propose a theory that resolves the inconsistency, and finally present a hypothesis to test that theory. In applied research, it might describe a phenomenon or theory, then describe how that phenomenon or theory applies to some important real-world situation, and finally suggest a way to test whether it does, in fact, apply to that situation.
Looking at the literature review in this way emphasizes a few things. First, it is extremely important to start with an outline of the main points that you want to make, organized in the order that you want to make them. The basic structure of your argument, then, should be apparent from the outline itself. Second, it is important to emphasize the structure of your argument in your writing. One way to do this is to begin the literature review by summarizing your argument even before you begin to make it. “In this article, I will describe two apparently contradictory phenomena, present a new theory that has the potential to resolve the apparent contradiction, and finally present a novel hypothesis to test the theory.” Another way is to open each paragraph with a sentence that summarizes the main point of the paragraph and links it to the preceding points. These opening sentences provide the “transitions” that many beginning researchers have difficulty with. Instead of beginning a paragraph by launching into a description of a previous study, such as “Williams (2004) found that…,” it is better to start by indicating something about why you are describing this particular study. Here are some simple examples:
Another example of this phenomenon comes from the work of Williams (2004).
Williams (2004) offers one explanation of this phenomenon.
An alternative perspective has been provided by Williams (2004).
We used a method based on the one used by Williams (2004).
Finally, remember that your goal is to construct an argument for why your research question is interesting and worth addressing—not necessarily why your favorite answer to it is correct. In other words, your literature review must be balanced. If you want to emphasize the generality of a phenomenon, then of course you should discuss various studies that have demonstrated it. However, if there are other studies that have failed to demonstrate it, you should discuss them too. Or if you are proposing a new theory, then of course you should discuss findings that are consistent with that theory. However, if there are other findings that are inconsistent with it, again, you should discuss them too. It is acceptable to argue that the balance of the research supports the existence of a phenomenon or is consistent with a theory (and that is usually the best that researchers in psychology can hope for), but it is not acceptable to ignore contradictory evidence. Besides, a large part of what makes a research question interesting is uncertainty about its answer.
The Closing
The closing of the introduction—typically the final paragraph or two—usually includes two important elements. The first is a clear statement of the main research question and hypothesis. This statement tends to be more formal and precise than in the opening and is often expressed in terms of operational definitions of the key variables. The second is a brief overview of the method and some comment on its appropriateness. Here, for example, is how Darley and Latané (1968) [2] concluded the introduction to their classic article on the bystander effect:
These considerations lead to the hypothesis that the more bystanders to an emergency, the less likely, or the more slowly, any one bystander will intervene to provide aid. To test this proposition it would be necessary to create a situation in which a realistic “emergency” could plausibly occur. Each subject should also be blocked from communicating with others to prevent his getting information about their behavior during the emergency. Finally, the experimental situation should allow for the assessment of the speed and frequency of the subjects’ reaction to the emergency. The experiment reported below attempted to fulfill these conditions. (p. 378)
Thus the introduction leads smoothly into the next major section of the article—the method section.
The method section is where you describe how you conducted your study. An important principle for writing a method section is that it should be clear and detailed enough that other researchers could replicate the study by following your “recipe.” This means that it must describe all the important elements of the study—basic demographic characteristics of the participants, how they were recruited, whether they were randomly assigned to conditions, how the variables were manipulated or measured, how counterbalancing was accomplished, and so on. At the same time, it should avoid irrelevant details such as the fact that the study was conducted in Classroom 37B of the Industrial Technology Building or that the questionnaire was double-sided and completed using pencils.
The method section begins immediately after the introduction ends with the heading “Method” (not “Methods”) centered on the page. Immediately after this is the subheading “Participants,” left justified and in italics. The participants subsection indicates how many participants there were, the number of women and men, some indication of their age, other demographics that may be relevant to the study, and how they were recruited, including any incentives given for participation.

After the participants section, the structure can vary a bit. Figure 11.1 shows three common approaches. In the first, the participants section is followed by a design and procedure subsection, which describes the rest of the method. This works well for methods that are relatively simple and can be described adequately in a few paragraphs. In the second approach, the participants section is followed by separate design and procedure subsections. This works well when both the design and the procedure are relatively complicated and each requires multiple paragraphs.
What is the difference between design and procedure? The design of a study is its overall structure. What were the independent and dependent variables? Was the independent variable manipulated, and if so, was it manipulated between or within subjects? How were the variables operationally defined? The procedure is how the study was carried out. It often works well to describe the procedure in terms of what the participants did rather than what the researchers did. For example, the participants gave their informed consent, read a set of instructions, completed a block of four practice trials, completed a block of 20 test trials, completed two questionnaires, and were debriefed and excused.
In the third basic way to organize a method section, the participants subsection is followed by a materials subsection before the design and procedure subsections. This works well when there are complicated materials to describe. This might mean multiple questionnaires, written vignettes that participants read and respond to, perceptual stimuli, and so on. The heading of this subsection can be modified to reflect its content. Instead of “Materials,” it can be “Questionnaires,” “Stimuli,” and so on. The materials subsection is also a good place to refer to the reliability and/or validity of the measures. This is where you would present test-retest correlations, Cronbach’s α, or other statistics to show that the measures are consistent across time and across items and that they accurately measure what they are intended to measure.
The results section is where you present the main results of the study, including the results of the statistical analyses. Although it does not include the raw data—individual participants’ responses or scores—researchers should save their raw data and make them available to other researchers who request them. Many journals encourage the open sharing of raw data online, and some now require open data and materials before publication.
Although there are no standard subsections, it is still important for the results section to be logically organized. Typically it begins with certain preliminary issues. One is whether any participants or responses were excluded from the analyses and why. The rationale for excluding data should be described clearly so that other researchers can decide whether it is appropriate. A second preliminary issue is how multiple responses were combined to produce the primary variables in the analyses. For example, if participants rated the attractiveness of 20 stimulus people, you might have to explain that you began by computing the mean attractiveness rating for each participant. Or if they recalled as many items as they could from study list of 20 words, did you count the number correctly recalled, compute the percentage correctly recalled, or perhaps compute the number correct minus the number incorrect? A final preliminary issue is whether the manipulation was successful. This is where you would report the results of any manipulation checks.
The results section should then tackle the primary research questions, one at a time. Again, there should be a clear organization. One approach would be to answer the most general questions and then proceed to answer more specific ones. Another would be to answer the main question first and then to answer secondary ones. Regardless, Bem (2003) [3] suggests the following basic structure for discussing each new result:
- Remind the reader of the research question.
- Give the answer to the research question in words.
- Present the relevant statistics.
- Qualify the answer if necessary.
- Summarize the result.
Notice that only Step 3 necessarily involves numbers. The rest of the steps involve presenting the research question and the answer to it in words. In fact, the basic results should be clear even to a reader who skips over the numbers.
The discussion is the last major section of the research report. Discussions usually consist of some combination of the following elements:
- Summary of the research
- Theoretical implications
- Practical implications
- Limitations
- Suggestions for future research
The discussion typically begins with a summary of the study that provides a clear answer to the research question. In a short report with a single study, this might require no more than a sentence. In a longer report with multiple studies, it might require a paragraph or even two. The summary is often followed by a discussion of the theoretical implications of the research. Do the results provide support for any existing theories? If not, how can they be explained? Although you do not have to provide a definitive explanation or detailed theory for your results, you at least need to outline one or more possible explanations. In applied research—and often in basic research—there is also some discussion of the practical implications of the research. How can the results be used, and by whom, to accomplish some real-world goal?
The theoretical and practical implications are often followed by a discussion of the study’s limitations. Perhaps there are problems with its internal or external validity. Perhaps the manipulation was not very effective or the measures not very reliable. Perhaps there is some evidence that participants did not fully understand their task or that they were suspicious of the intent of the researchers. Now is the time to discuss these issues and how they might have affected the results. But do not overdo it. All studies have limitations, and most readers will understand that a different sample or different measures might have produced different results. Unless there is good reason to think they would have, however, there is no reason to mention these routine issues. Instead, pick two or three limitations that seem like they could have influenced the results, explain how they could have influenced the results, and suggest ways to deal with them.
Most discussions end with some suggestions for future research. If the study did not satisfactorily answer the original research question, what will it take to do so? What new research questions has the study raised? This part of the discussion, however, is not just a list of new questions. It is a discussion of two or three of the most important unresolved issues. This means identifying and clarifying each question, suggesting some alternative answers, and even suggesting ways they could be studied.
Finally, some researchers are quite good at ending their articles with a sweeping or thought-provoking conclusion. Darley and Latané (1968) [4] , for example, ended their article on the bystander effect by discussing the idea that whether people help others may depend more on the situation than on their personalities. Their final sentence is, “If people understand the situational forces that can make them hesitate to intervene, they may better overcome them” (p. 383). However, this kind of ending can be difficult to pull off. It can sound overreaching or just banal and end up detracting from the overall impact of the article. It is often better simply to end by returning to the problem or issue introduced in your opening paragraph and clearly stating how your research has addressed that issue or problem.
The references section begins on a new page with the heading “References” centered at the top of the page. All references cited in the text are then listed in the format presented earlier. They are listed alphabetically by the last name of the first author. If two sources have the same first author, they are listed alphabetically by the last name of the second author. If all the authors are the same, then they are listed chronologically by the year of publication. Everything in the reference list is double-spaced both within and between references.
Appendices, Tables, and Figures
Appendices, tables, and figures come after the references. An appendix is appropriate for supplemental material that would interrupt the flow of the research report if it were presented within any of the major sections. An appendix could be used to present lists of stimulus words, questionnaire items, detailed descriptions of special equipment or unusual statistical analyses, or references to the studies that are included in a meta-analysis. Each appendix begins on a new page. If there is only one, the heading is “Appendix,” centered at the top of the page. If there is more than one, the headings are “Appendix A,” “Appendix B,” and so on, and they appear in the order they were first mentioned in the text of the report.
After any appendices come tables and then figures. Tables and figures are both used to present results. Figures can also be used to display graphs, illustrate theories (e.g., in the form of a flowchart), display stimuli, outline procedures, and present many other kinds of information. Each table and figure appears on its own page. Tables are numbered in the order that they are first mentioned in the text (“Table 1,” “Table 2,” and so on). Figures are numbered the same way (“Figure 1,” “Figure 2,” and so on). A brief explanatory title, with the important words capitalized, appears above each table. Each figure is given a brief explanatory caption, where (aside from proper nouns or names) only the first word of each sentence is capitalized. More details on preparing APA-style tables and figures are presented later in the book.
Sample APA-Style Research Report
Figures 11.2, 11.3, 11.4, and 11.5 show some sample pages from an APA-style empirical research report originally written by undergraduate student Tomoe Suyama at California State University, Fresno. The main purpose of these figures is to illustrate the basic organization and formatting of an APA-style empirical research report, although many high-level and low-level style conventions can be seen here too.
Image Description
Figure 11.1 image description: Table showing three ways of organizing an APA-style method section.
In the simple method, there are two subheadings: “Participants” (which might begin “The participants were…”) and “Design and procedure” (which might begin “There were three conditions…”).
In the typical method, there are three subheadings: “Participants” (“The participants were…”), “Design” (“There were three conditions…”), and “Procedure” (“Participants viewed each stimulus on the computer screen…”).
In the complex method, there are four subheadings: “Participants” (“The participants were…”), “Materials” (“The stimuli were…”), “Design” (“There were three conditions…”), and “Procedure” (“Participants viewed each stimulus on the computer screen…”). [Return to Figure 11.1]
- Bem, D. J. (2003). Writing the empirical journal article. In J. M. Darley, M. P. Zanna, & H. R. Roediger III (Eds.), The complete academic: A practical guide for the beginning social scientist (2nd ed.). Washington, DC: American Psychological Association. ↵
- Darley, J. M., & Latané, B. (1968). Bystander intervention in emergencies: Diffusion of responsibility. Journal of Personality and Social Psychology, 4 , 377–383. ↵
An article that presents the results of one or more new studies.
A brief summary of the study's research question, methods, results and conclusions.
Describes relevant previous research on the topic and can be anywhere from several paragraphs to several pages in length.
Where you present the main results of the study, including the results of the statistical analyses.
Research Methods in Psychology Copyright © 2023 by William L. Kelemen, Rajiv S. Jhangiani, I-Chant A. Chiang, Carrie Cuttler, & Dana C. Leighton is licensed under a Creative Commons Attribution-NonCommercial-ShareAlike 4.0 International License , except where otherwise noted.
Share This Book
- Schools & departments

New paper on digital mental health co-produced by young people in Scotland and Generation Scotland
The paper, from authors including Generation Scotland research fellow Dr Zhuoni Xiao, outlines the new mental health study ‘Loneliness in the Digital World’, which is currently recruiting participants.
Generation Scotland is Scotland’s largest family health study, with over 36,000 participants, and aiming to recruit over 10,000 more. In particular, the Generation Scotland team aims to recruit more young people to help represent the mental and physical health of the youth of Scotland. ‘Loneliness in the Digital World’ was launched and shaped in collaboration with young people from across Scotland. The study, entitled ' Loneliness in the Digital World: protocol for a co-produced ecological momentary assessment study in adolescents' is published in BMJ Open.
Read the study here (external link)

Loneliness in adolescence is a prevalent and important public health issue, with higher levels of loneliness linking to negative mental and physical health outcomes, such as anxiety and poor sleep quality. This problem has grown since 2020 due to the changes in social interaction methods triggered by the Covid-19 pandemic. How social media and online social interactions link to loneliness is particularly understudied in young people.
This study uses a youth-centred approach, with a Young Person Advisory Group (YPAG) of ten young people proactively involved in developing the study protocol and shaping the research design. This co-developed protocol utilises increased smartphone usage in this demographic by creating an app-based approach using an 'Ecological Momentary Assessment'. This involves repeatedly sampling of behaviours and experiences in real-time, in a subjects’ natural environment and everyday life. This design allows real-time data to be collected, with young people using an app to answer prompts to report their social interactions, loneliness and moods throughout the day over a 2-week period. This data will then be analysed to answer core research questions about how social interactions (both in-person and online), loneliness and mental health are linked.
This study is now entering its second phase and is offering up to £20 compensation to volunteers involved in this important mental health study. Anyone aged 12-15 living in Scotland can take part.
I have had many experiences in my life where I have felt lonely, such as living through a pandemic where I couldn’t see my friends, having bad experiences with bullying in school and suffering from a hidden health condition. These have made me realise just how isolated you can feel and how this can affect other aspects of your life. Eva Drummond YPAG member
We would like to extend our heartfelt thanks to the amazing and inspiring YPAG members and researchers who have been instrumental in launching this study. Special thanks go to the following young people for their assistance in designing, co-producing, shaping ideas, providing valuable feedback and piloting the project: ‘Alasdair MacKenzie, Ava Marshall, Brody Pardoe Hay, Daniel Galloway, Eva Drummond, Gareth Stubbs, Jessica Ehimen, Sharon Ehimen, Shuman Zhao, and Tyler Hill. The team also appreciate the contributions of Lorna Caddick, Nan Peng, Ercan Ozdemir, and Dejla Hoxha for their assistance in piloting and offering valuable feedback on the project. Dr Zhuoni Xiao Generation Scotland Research Fellow
To find out more and join this study visit the link below or contact the team at [email protected] with any questions.
Generation Scotland Loneliness Teens (external site)
COMMENTS
In the methods section of an APA research paper, you report in detail the participants, measures, and procedure of your study.
Reporting Participant Characteristics in a Research Paper. A report on a scientific study using human participants will include a description of the participant characteristics. This is included as a subsection of the "Methods" section, usually called "Participants" or "Participant Characteristics.". The purpose is to give readers ...
In many cases, a Method section will include at least the three subsections described below (i.e., Participants, Materials, Procedure); these sections will provide the basic information for a research project. Additional sections can be added when needed to explain more complex designs (e.g., Apparatus, Design). Participants.
The methods section of a research paper describes the procedures, participants, and materials used in an experiment. Learn more about how to write a method section.
In this section, we look at how to write an APA-style empirical research report, an article that presents the results of one or more new studies. Recall that the standard sections of an empirical research report provide a kind of outline. Here we consider each of these sections in detail, including what information it contains, how that information is formatted and organized, and tips for ...
Method section Your method section provides a detailed overview of how you conducted your research. Because your study methods form a large part of your credibility as a researcher and writer, it is imperative that you be clear about what you did to gather information from participants in your study.
The APA methods section is a very important part of your academic paper, displaying how you conducted your research by providing a precise description of the methods and procedures you used for the study. This section ensures transparency, allowing other researchers to see exactly how you conducted your experiments. In APA style, the methods section usually includes subsections on participants ...
Include these in your results section: Participant flow and recruitment period. Report the number of participants at every stage of the study, as well as the dates when recruitment took place. Missing data. Identify the proportion of data that wasn't included in your final analysis and state the reasons.
In this section, we look at how to write an APA-style empirical research report, an article that presents the results of one or more new studies. Recall that the standard sections of an empirical research report provide a kind of outline.
The methods section of an APA-style paper is where you describe in detail how you conducted your research. This includes details about the participants, materials, and procedures used during the study. APA style provides distinct instructions on how to format your methodology section.
The methods section should describe what was done to answer the research question, describe how it was done, justify the experimental design, and explain how the results were analyzed. Scientific writing is direct and orderly. Therefore, the methods section structure should: describe the materials used in the study, explain how the materials ...
Reporting Standards for Qualitative Research in Psychology: What Are They, and Why Do We Need Them? Everyone loves a good story. A well-written or well-told story can draw you in and make you care about an issue that you never considered before. It can open new doors and change relationships by helping you understand others' experi-ences more deeply. It can teach you to develop empathy or ...
A research report is one type that is often used in the sciences, engineering and psychology. Here your aim is to write clearly and concisely about your research topic so that the reader can easily understand the purpose and results of your research.
Methods section is a crucial part of a manuscript and emphasizes the reliability and validity of a research study. And knowing how to write the methods section of a research paper is the first step in mastering scientific writing. Read this article to understand the importance, purpose, and the best way to write the methods section of a research paper.
In psychology, a lab report outlines a study's objectives, methods, results, discussion, and conclusions, ensuring clarity and adherence to APA (or relevant) formatting guidelines. A typical lab report would include the following sections: title, abstract, introduction, method, results, and discussion.
THE DEPARTMENT OF PSYCHOLOGY GUIDE TO WRITING RESEARCH REPORTS The following set of guidelines provides psychology students at Essex with the basic information for structuring and formatting reports of research in psychology. During your time here this will be an invaluable reference. You are encouraged to refer to this document each time you write a lab report.
Qualitative Research Part II: Participants, Analysis, and Quality Assurance. This is the second of a two-part series on qualitative research. Part 1 in the December 2011 issue of Journal of Graduate Medical Education provided an introduction to the topic and compared characteristics of quantitative and qualitative research, identified common ...
Research Report is a written document that presents the results of a research project or study, including the research question, methodology, results, and conclusions, in a clear and objective manner.
Structure of the Methodology In A Research Paper. The Methods section typically begins with a brief overview of its contents and a reiteration of the research question. This is followed by a description of the participants, detailing their demographics, and how they were recruited. The materials or apparatus used are then specified, from tools ...
An outline of the research questions and hypotheses; the assumptions or propositions that your research will test. Literature Review. Not all research reports have a separate literature review section. In shorter research reports, the review is usually part of the Introduction. A literature review is a critical survey of recent relevant ...
People participate in research in a variety of settings, including laboratories, homes, schools, businesses, clinics, and hospitals. Descriptive terms such as college students, children, or respondents, as well as the more general terms such as participants and subjects are acceptable.
What is the research paper Results section and what does it do? The Results section of a scientific research paper represents the core findings of a study derived from the methods applied to gather and analyze information. It presents these findings in a logical sequence without bias or interpretation from the author, setting up the reader for later interpretation and evaluation in the ...
The student title page includes the paper title, author names (the byline), author affiliation, course number and name for which the paper is being submitted, instructor name, assignment due date, and page number, as shown in this example.
Report outline. The report contains three main sections. Section one presents our research on the barriers to PETs adoption and our reasoning for convening the workshop to explore potential solutions. Section two discusses the barriers to the adoption identified by participants throughout the workshop and anonymised survey responses.
The appendix to this section contains model language for inclusion in the summary annual report to assist plan administrators in complying with the requirements of paragraph (b)(1)(i)(B) of this section to avail themselves of the waiver of examination and report of the independent qualified public accountant for employee benefit plans with ...
The Securities and Exchange Commission today announced charges against OTC Link LLC, a New York-based broker-dealer, for failing to file numerous reports of suspicious financial transactions, known as Suspicious Activity Reports (SARs), for a period of more than three years.
An increase in the activity of these market participants, in turn, facilitates tighter spreads, which may cause an additional corresponding increase in order flow from other market participants, to the benefit of all market participants.
In this section, we look at how to write an APA-style empirical research report, an article that presents the results of one or more new studies. Recall that the standard sections of an empirical research report provide a kind of outline.
The paper, from authors including Generation Scotland research fellow Dr Zhuoni Xiao, outlines the new mental health study 'Loneliness in the Digital World', which is currently recruiting participants.